Tepid Growth for Q1 GDP

By Thomas Cooley, Ben Griffy and Peter Rupert

Today’s announcement of a 1.1% increase for the final estimate for Q1 real GDP from the BEA produced a small upward revision from the second estimate (was 0.8%), but more than doubled the advance estimate (was 0.5%). While the upward revision was certainly welcome, the overall picture is still one of weak growth overall. gdprealchgm-2016-06-28

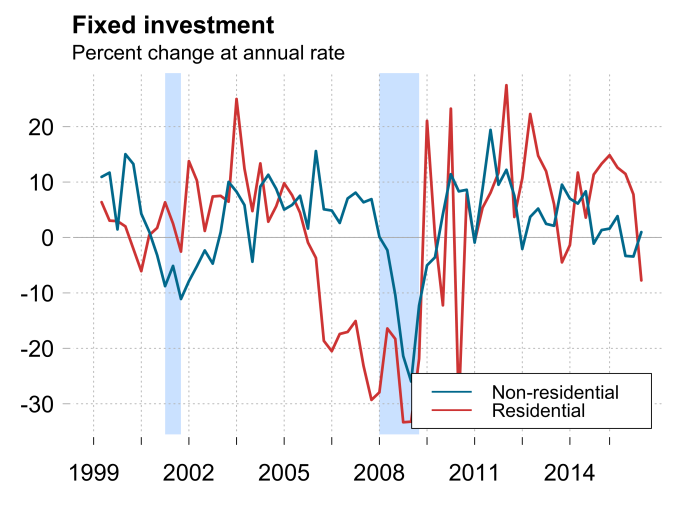
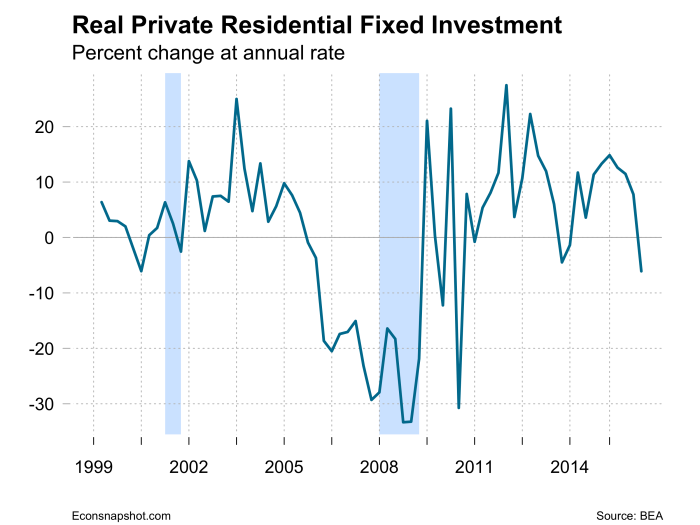
Consumption spending drove most of the increase in growth,  personal consumption expenditures grew +1.5% and the services component at +2.1%. Gross private domestic investment declined -1.8% and has declined for three consecutive quarters. Nonresidential structures and equipment fell substantially, -7.9% and -8.7%. Residential structures, on the other hand, grew at its highest rate in over two years, +15.6%.

The weak-ish growth and the Brexit have contributed to the overall global uncertainty concerning future growth–and future policy. The dollar-pound exchange rate fell to its lowest level in about 30 years, as of this writing on July 1, it is 1.33 dollars per pound. Not to mention England lost to Iceland 2-1 (which we term “Brexit II”)!

dollar-pound-2016-06-28

The real effects of Brexit will take some time to sort out. How the EU reacts remains to be seen. In the short run, however, uncertainty can have real effects. Investment is likely to decline in both the UK and EU given the uncertainty surrounding future policy, such as tariffs and labor mobility. But note that tariffs and immigration controls are policy choices. If free and open trade and open borders benefit the citizens of the two areas then the choices by government should reflect that. However, as Chancellor Angela Merkel remarked, “Whoever decides to leave that family cannot expect all obligations to be omitted while keeping its privileges.”

Within the US, Brexit has been influential in causing the Fed to taper its stated goals of two interest increases during the year. Given the uncertainty surrounding Brexit and the EU, as well as the upcoming presidential election, this seems prudent. As the economy has been displaying tepid progress over the past few months in the United States, we can only hope that Brexit is not the final push for a teetering US and global economy.

The May Jobs Report Stifles Optimism

By Thomas Cooley, Ben Griffy and Peter Rupert

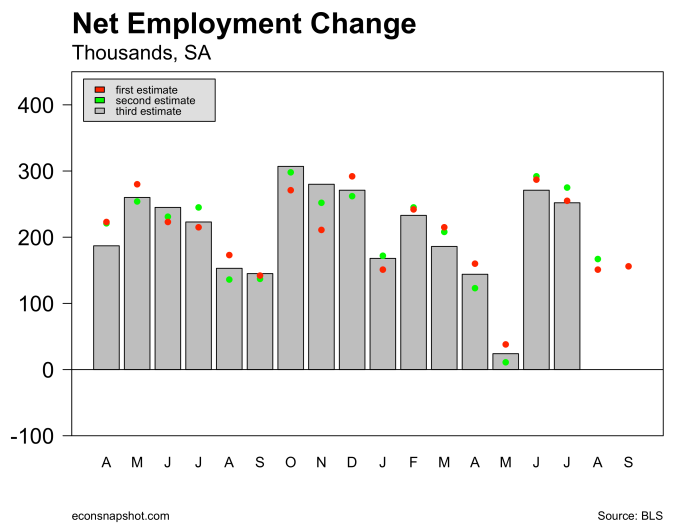
In recent weeks there has been increasing optimism about the strengthening U.S. economy based on increases in consumption and improvements in the housing sector.  This was accompanied by increasing chatter about a possible June or mid-summer rate increase by the Fed. The latest jobs report throws cold water on that optimism. The Bureau of Labor Statistics announced that payroll employment increased only 38,000 in May, the smallest increase since June of 2011. Of the 38,000 increase 25,000 was in the private sector. In addition, there were downward revisions to the previous two months totalling 59,000; down 22,000 in March and 37,000 in April.

empchgm-2016-06-03


emp-rec-rec-2016-06-03

The service sector was the driver of the increase, up 61,000, and almost all of that in health care, up 55,400. Mining employment continued its decline, down 11,000 after falling 26,000 over the previous two months.

Average weekly hours has been stuck at 34.4 for the past three months and average hourly earnings showed almost no change over the month, $25.54 in April and $25.59 in May.

avghours-2016-06-03

The household survey from the BLS shows a 458,000 decline in the labor force (employed plus unemployed), and the number of persons unemployed fell by 484,000, leading to an  unemployment rate decline from 4.98% to 4.69%. The employment to population ratio held steady at 59.7.

lfp-2016-06-03
epr-2016-06-03

uu6rate-2016-06-03

These tepid results may be a delayed reflection of the slow growth in the first quarter and it may be the Q2 will continue to look stronger.  It does suggest that the Fed may scale back its intentions to continue to raise interest rates above the zero lower bound. In addition, slowing wage growth implies that inflation may flag as well, further depressing the nominal interest rate. There will undoubtedly be calls for more direct fiscal stimulus in the form of infrastructure investment to counter the low rate of investment and job growth. But that is unlikely to be forthcoming in an election year and given the increasing debt/gdp of the U.S..

As the rest of the world has stagnated, the United States has been the largest source of growth over the past few years. With poor employment reports over the past few months, it is unclear whether the US economy is strong enough to continue to be the global driver of growth.


Labor market adds to weak outlook

By Thomas Cooley, Ben Griffy and Peter Rupert

The Bureau of Labor Statistics provided some additional bad news with employment increasing only 160,000 for the month of April. The private sector gained 171,000 however, with government shedding 11,000. Moreover, previous estimates were also revised down,  March 208,000 from 215,000 and February from 245,000 to 233,000. Mining employment continued its decline, down 8,000. empchgm-2016-05-06

Average weekly hours were up from 34.4 to 34.5 and average hourly wages ticked up.

avghours-2016-05-08.png
The household survey also provided evidence of weakness: the unemployment rate remained essentially unchanged at 4.99%, the labor force fell 362,000 and the participation rate fell by 0.2%.

lfp-2016-05-08epr-2016-05-08

The household survey and establishment survey moved in decidedly different directions, with employment from the household survey falling 316,000.

estabhouse-2016-05-08.png

The Q1 Disappointments Continue

by Thomas Cooley, Ben Griffy and Peter Rupert

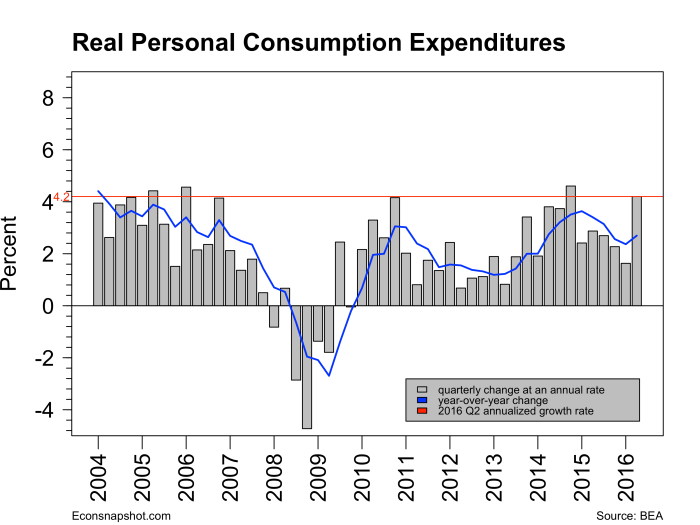
The BEA reported today that real GDP for the first quarter (advance estimate) grew at an annual rate of only 0.5%. This continues the pattern of deeply disappointing first quarter results.  This, however, is not just a seasonal anomaly. GDP growth has been slowing steadily since the strong second quarter of last year. These results were expected but they are worrisome in several respects. While personal consumption expenditures were fairly strong, growing at 1.9%, the previous three quarters grew at a more robust 3.0%. Non-residential fixed investment fell 5.9% from the previous quarter and equipment investment fell by a whopping 8.6% – these do not bode well for future growth.

gdprealchgm-2016-04-28pcerealchgm-2016-04-28


nrfi-cyc-trough-2016-04-28residentialinv-2016-04-28

Residential fixed investment increased by 14.8%, a strong performance compared to previous quarters.  The core PCE index increased at a 2.1% annual rate suggesting that inflation may be getting near its target level. Exports fell by 2.6% holding back growth.

The steady downward march these last three quarters is cause for concern. But for the past several years dismal first quarters have been followed by rebounds. Will that pattern continue?

FOMC statement, April 27

The most recent statement from the FOMC delivered a weaker outlook than their previous statement. In addition, they removed the “headwinds” from global and financial concerns. Still, much of Europe and Japan remain weak.

gdp-various-2016-04-28


When the Fed decided to hold off on rate increases they were clearly concerned about weak domestic fundamentals and waiting to see if the economy is going to continue to stagnate.  For the time being we must all play the waiting game and look for signs of renewed vigor in the monthly numbers. But what if the subsequent numbers show continued slow growth?  It isn’t clear that the Fed has much more that they can do. They are likely not ready to go to negative interest rates as other central banks have done. That leaves fiscal policy.

What Would Donald or Hillary Do?

This of course will be the great guessing game and subsequent reveal of the next many months. But so far the only revelation is an antipathy to trade on both their parts, which if brought to the fore could seriously hamper economic growth for decades to come.  But, it is time to start looking for – demanding – clues to their economic savvy beyond the campaign bloviating.

4th Quarter revised up…again

by Thomas Cooley, Ben Griffy and Peter Rupert

The final estimate of 4th quarter GDP for 2015, 1.4% doubled the first estimate from January, 0.7%.  Yet, looking at the year -over-year change (the blue line in the graph below) growth has slowed over the past several quarters and one can pick out some “mini-cycles” since the Great Recession. The final estimate for annual growth for 2015 came out at 2.4%, exactly the same as 2014.

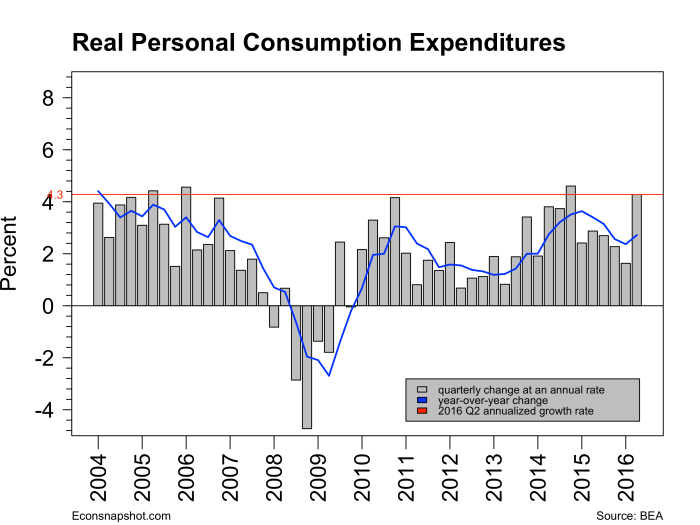
Real personal consumption expenditures (PCE) grew at 2.4%, a slight revision up as well, but again shows a downward trend over the past year or so. Residential fixed investment (structures) grew at a solid 10.1% and has remained at fairly steady pace since the 4th quarter of 2014. However, nonresidential structures declined at a 5.1% pace after declining 7.2% in the 3rd quarter of 2015.

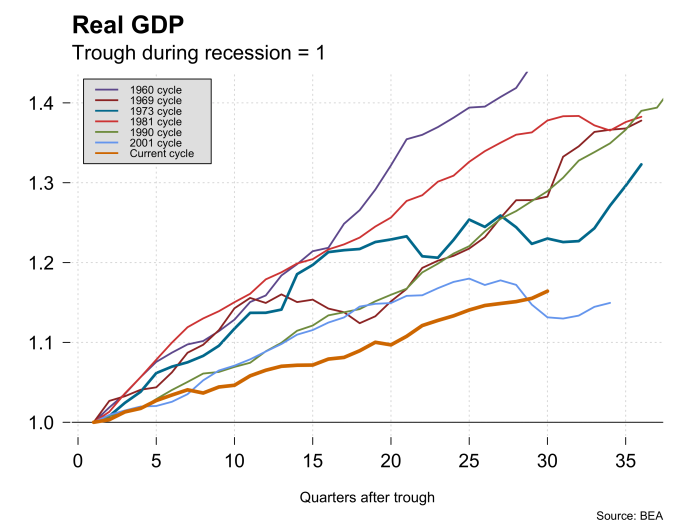
gdprealchgm-2016-03-25pcerealchgm-2016-03-25Since the trough of the last recession, dated Q2 of 2009 from the NBER, the recovery has been the weakest in recent history, as can be seen in the graph below. For example, take the 1969 cycle, about in the middle of the lines below. Roughly 7 years after bottoming out, the economy grew by about 25%. The current recovery is  but 15% higher 7 years after the trough. The same slow growth is true about consumption.

gdp-cyc-trough2016-03-25pce-cyc-trough2016-03-26
The table below shows the averages for contractions and expansions since 1854. Over time the contractions have gotten shorter and the expansions longer. Just as a point of reference, the current expansion is about 28 quarters long.

Cycles Contraction (quarters) Expansion (quarters)
1854-1919 (16 cycles) 21.6 26.6
1919-1945 (6 cycles) 18.2 35.0
1945-2009 (11 cycles) 11.1 58.4
1960-2009 (8 cycles) 11.6 65.1

February Employment and Revised Q4 GDP Show a Healthy U.S. Economy

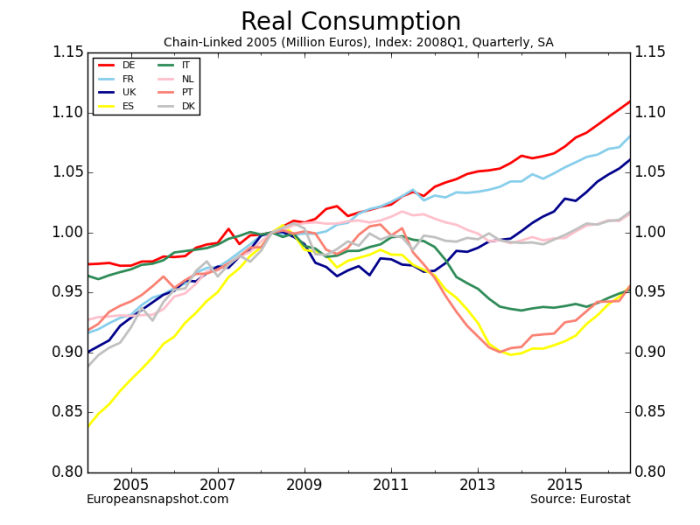
The U.S. economy continues to grow and add jobs in spite of  weakness elsewhere in the world.  We are now well beyond talking about this as a recovery – it is a mature expansion albeit with growth rates slightly lower than we would like and lower than previous recoveries as our graphs show. The good news is that we have full employment and we continue to grow and be a driving force in the world economy in spite of weakness almost every where we look. The slowdown in China, the contractions in Japan, Brazil and other emerging markets, and the uneven growth in Europe have not been enough to interfere with our party. This does not mean there are no problems – labor force participation rates and wage growth are low and thus are not making inroads into the declining fortunes of the middle class.  These problems are long term and structural and to a large extent the result of the most recent wave of globalization.

GDP Growth

Last Friday’s release of the 2nd estimate for real GDP in Q4 2015 increased growth from the advance estimate of 0.7% to 1.0% at a seasonally adjusted annual rate. The revision increase was mainly from inventories, according to the BEA. The report did little to change the perception of the underlying strength of the economy. According to ActionEconomics!, the big upward surprise to inventories was primarily due to the difficulty estimating quarter-end prices from such large declines in oil prices. Overall, for 2015, GDP increased 2.4%, the same as in 2014.

gdp-cyc-2016-02-29gdprealchgm-2016-02-29

Growth in Personal Consumption Expenditures (PCE) was a major contributor to strength, but its growth has slowed over the past few quarters, increasing at a 2.0% clip.

pcerealchgm-2016-02-29.png

Employment

The Bureau of Labor Statistics released the employment situation for February, revealing a 242,000 increase in payroll employment. In addition, employment was revised up for both December, +9,000 and January +21,000.

empchgm-2016-03-04.png

The 254,000 increase in private service producing jobs was led by health care and social assistance, +57,400, retail trade, +54,900 and leisure and hospitality, +48,000. The goods producing sector, on the other hand, shed -15,000, led by the continued decline in the mining and logging sector (oil), -18,000 and manufacturing -16,000; however, the construction sector added +19,000.

emp-construction-2016-03-04emp-mining-logging-2016-03-04

While the overall employment numbers are encouraging, average weekly hours fell slightly to 34.4, and there was a slight decline in average hourly earnings, $25.38. These are not significant given the extent of variation in these numbers. What is clear is that wage growth is beginning to look more like previous cycles and as the job markets tighten it may be that this trend will improve. Productivity, which had been showing signs of improvement, drifted down slightly but some of this may be seasonal. compensation-cyc-2016-03-04 prod-cyc-2016-03-04


Interestingly, the household measure of employment has shown an acceleration over the past four or five months.

estabhouse-2016-03-04.png

Both the participation rate and the employment to population ratio ticked up to 62.9 and 59.8 percent respectively, while unemployment was essentially unchanged at 4.92%.

lfp-2016-03-04epr-2016-03-04

Overall, the employment picture along with the GDP data suggest growth, but there is enough weakness around to give the Fed pause at the next meeting.

Understanding the Decline in US Labor Force Participation.

By Ben Griffy

The past 15 years have seen a striking decrease in the ratio of civilians employed to the size of the total working population. From 1948 (the earliest date at which statistics are available) to 2000, the labor force participation rate (LFPR) increased from 58.6 percent to 67.3 percent. Since, the LFPR has fallen to 62.4 percent, a rate last matched in the 1970s. us-lfpr.pngFurthermore, we have not seen a similar drop among Eurozone economies, creating some cause for concern that these changes are a sign of structural labor market weakness in the United States.LFPR.png

There are a number of factors that could be driving the current decline and the differences across countries. Demographic changes are certainly an important component, both in the increase in LFPR and the current decline. From 1948 to 2000, female labor force participation increased from 32 percent to 60.1 percent (see above), accounting for the increase in overall participation.  Male labor force participation declined during the same period: (see above). Another important factor is that the United States population has been aging during this time period, and different age groups exhibit different participation rates, as well as different numbers of hours worked at the intensive (i.e. number of hours worked at a single job) margin. This blog post by the St. Louis Fed suggests that if we control for the decline in “prime working age” adults, there has only been a small decline in the overall participation rates during the same time period. However, since 2010, there has still been a more than 2 percentage point decline in the LFPR. This may support the idea that labor markets have weakened in the United States.

Demographics alone do not explain why the labor market in the United States appears to be weakening. Europe has experienced an aging demography in larger magnitudes (see here) and have shown small, if any, declines in LFPR. A recent article in the Financial Times details the stark differences in labor force participation across countries, most notably the difference between the United States and Japan, an economy with a much older labor force. However, there are structural differences between the US and Europe that are worth addressing.

It is important to distinguish here between the intensive and extensive margins. Since 1980, the United States has seen only a small decline in average hours worked by an employed individual (see here), while there has been a large decline in the equivalent measures in both the UK and Japan. Here, it is important to note that the UK has a substantially larger share of individuals employed part-time, and the size of this share has accelerated relative to the United States. When we break employment down into part-time and full-time components, we see a different picture of the labor market. Namely, part-time employment has fallen in the US, while part-time employment has risen in comparable European economies.

This distinction is important when comparing the health of labor markets across countries. The United States has maintained strong full-time employment even following the Great Recession, while part-time continued a trend of longer-term decline. This translates into a very different story in terms of hours worked:hrs-wrked-fred.pngThe United States has had a small decline in hours worked over the past twenty years, while Europe has seen a drop from either similar levels to significantly lower levels than the United States, or previously higher levels than the United States to similar levels. The differences is that the United States has maintained higher levels of full-time employment, while Europe has averaged fewer hours at full-time work, and seen increases in part-time work.Full-Time.pngHours-Worked-Main.pngPart-Time.png


We see a similar story when we distinguish by age group. Economists are particularly concerned about the participation of “prime-aged male workers,” those from ages 25-54, when they could be expected to contributing most to the economy. However, there is little evidence of a decline in full-time employment among this age group:FT-by-age.png

We see that the United States has experienced little to no change in the percent of age 25-54 workers with full-time employment, outside of cyclical changes. Certainly, one cannot distinguish a long-term decline relative to European peers.

Europe and the United States are commonly juxtaposed to show that the US has suffered a weakened labor market. It is true that the United States has seen large declines in labor force participation when compared with the European Union. However, there are a number of factors at play that suggest the labor market has not weakened as substantially as the data on labor force participation might suggest. The United States population has aged during the same period, which accounts for some of the differences in LFPR. Additionally, the US appears to have undergone different structural changes than its European counterparts: most of the gains in participation rate in Europe have been through part-time jobs, while the United States has seen gains to both hours worked and full-time employment. Thus, while the participation rate suggests that the health of the labor market in the United States has declined relative to its European peers, other indicators make such a conclusion unclear.


Weak Employment on the Heels of weak GDP

by Thomas Cooley, Ben Griffy and Peter Rupert

Reading through today’s release of the employment situation from the BLS one is struck by how many times the phrase “little changed” shows up. Employment gains from the establishment survey were weak, up 151,000. Revisions over the past two months were almost off-setting, up 28,000 for November and down 30,000 for December, so, little change there.

empchgm-2016-02-05

Employment in mining and logging continues to decline, down 7,000 and down 29,000 over that past three months.
Manufacturing was up 29,000 and services up 118,000. However, temporary services declined 25,200. Health care and social assistance as well as leisure and hospitality rose by 44,000.

emp-mining-logging-2016-02-05

temps-2016-02-05

Average weekly hours were up to 34.6 but have bounced between 34.5 and 34.6 since March of 2014. Average hourly earnings rose from $25.27 to $25.39, up 2.5% over the year.

avghours-2016-02-05

The household survey also showed very little change in most headline numbers. The unemployment rate remained at 4.9% and the unemployment rate including marginally attached workers remained at 9.9%. Here are the numbers for the unemployment rate since September, with a lot of digits:

2015-09-01 0.05052050
2015-10-01 0.05028136
2015-11-01 0.05035331
2015-12-01 0.05007825
2016-01-01 0.04920580

uu6rate-2016-02-05

Given the amount of vacancies out there, however, the unemployment rate remains somewhat high, as can be seen in the Beveridge Curve.

beveridge-2016-02-05

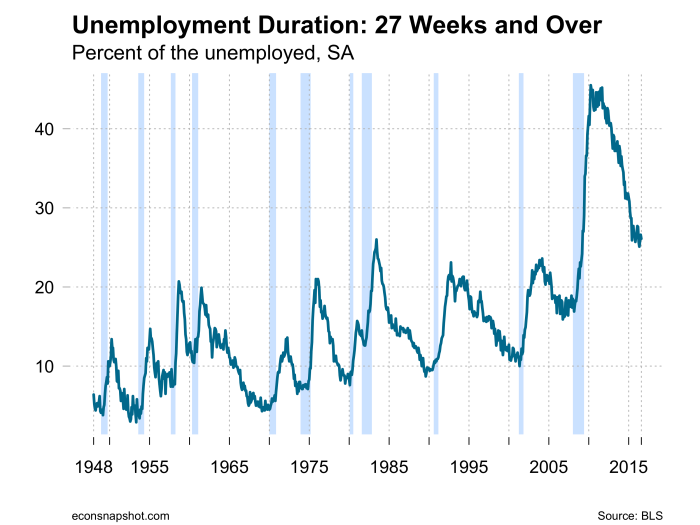
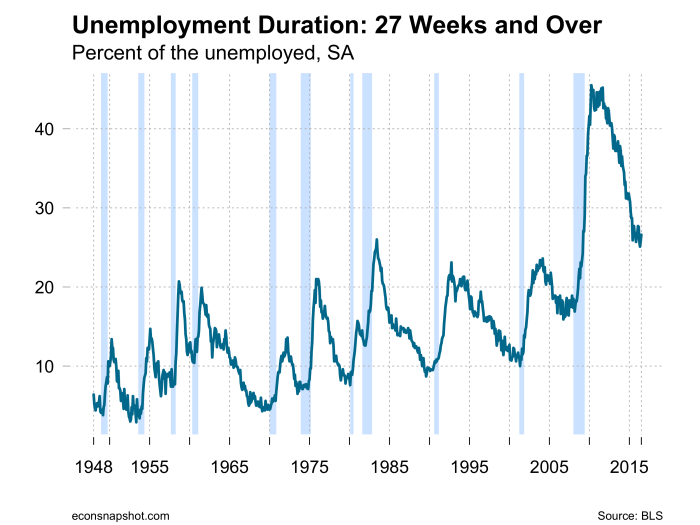
There has been no significant change in the employment to population ratio or the labor force participation rate, those unemployed 27 weeks and longer, or those working part time for economic reasons.

epr-2016-02-05

lfp-2016-02-05

udur27-2016-02-05

parttimefrac-2016-02-05

Output per hour fell 3.0% at an annual rate in the fourth quarter of 2015 and has not shown any upward trend over the recovery. Indeed, it is only about 7% higher today compared to the peak before the great recession, by far the slowest rate of growth across all recessions and recoveries since the 1960’s, except for the 1973 recovery.

prodbar-2016-02-05

prod-cyc-2016-02-05

The BLS also undertook the annual revision to earlier data based on a more complete set of data. The annual revisions lowered December payrolls by 105k. The total nonfarm employment level for March 2015 was revised downward by
206,000 but this left a boost for job growth as the over-the-year change in total nonfarm employment for 2015 was revised from 2,650,000 to 2,735,000.

Overall, then, the slow GDP growth reported earlier this month along with the fairly weak labor report shows an economy that continues to grow at a fairly anemic pace. Moreover, it seems less likely the Fed will signal any moves in the near future.

Tighten Your Seatbelt

By Thomas Cooley, Ben Griffy and Peter Rupert

Today’s release of the “advance” estimate for GDP for 2015 QIV shows 2015 ending with a dud as growth slowed throughout the year. Real GDP increased only 0.7% at a seasonally adjusted annual rate. Both real GDP and real personal consumption expenditures (PCE) have taken a decidedly downward turn. The weak numbers were widely anticipated, presaged by falling industrial production, declining exports and weak consumer demand. The question on everyone’s mind is whether this portends a more prolonged contraction in the economy.

gdprealchgm-2016-01-29

pcerealchgm-2016-01-29

Looking at previous business cycles, it is clear that this recovery, while weak, is beginning to look mature.  Job growth has continued strong and the unemployment rate is low  but this recovery has been in progress for several years now.  What are the forces weighing on economic growth that would tip the economy into a contraction?

gdp-cyc-2016-01-29

nrfi-cyc-2016-01-29

rfi-cyc-2016-01-29

Exports have shown gradual flattening out and then more recently a decline precipitated by weak demand elsewhere in the world and a strong dollar. Expectations are that this will continue and continue to pull down U.S. growth.  Consumption was also weaker in the fourth quarter after looking stronger earlier. PCE slowed to 2.2% after growing 3.6% and 3.0% in QII and QIII, respectively. Moreover, as the graph below shows, once PCE goes south it takes a while to reverse course. Investment in non-residential structures (-5.3%) and equipment (-2.5%) fell sharply, leading to an overall investment decline of -2.5%. Residential structures, however, grew at 8.1%.
useuro-2016-01-29
exp-cyc-2016-01-29


Headwinds

The U.S. economy has always been an important driver for growth elsewhere in the world. As the first picture below shows the fate of the U.S. economy is closely aligned with the fate of nearest and most important trading partners, Mexico and the U.S. but in the age of globalization other trading partners – China, Europe Japan are very important as well. As you can see from the following charts, Europe and Japan are stagnant and the emerging markets, while not completely foundering, are likely not to lift others, particularly as China’s growth slows.  These are serious concerns for the future strength of the U.S. recovery.


gdp-US-CAN-MEX-2016-01-29

gdp-US-EU17-Japan-UK2016-01-29


gdp-trbrics-various-2016-01-29


A Strong Labor Market in the Face of Global Headwinds

by Thomas Cooley, Ben Griffy and Peter Rupert

The December employment situation delivered this morning from the BLS showed continued strength across the board. Payroll employment increased 292,000 and the news gets better as payrolls were revised up for both October (+9,000) and November (+41,000). The mining and logging sector continued to decline, falling another 8,000 after falling 11,000 in November and 1,000 in October as a result of the continued decline in oil prices. The motor vehicle and parts sector also fell for the third straight month, shedding 6,500 jobs over that time span.

Most of the job gains were in the service sector with health care and temporary services showing significant gains. In the goods producing sector most of the gains were in construction.

Average weekly hours were essentially unchanged as were average hourly earnings.  The latter is important because it means that strong job growth has not yet generated more upward pressure on wages.  But a more careful look at wages is provided by the Federal Reserve Bank of Atlanta’s wage tracker. It shows across a broad set of categories a three month moving average of median wage growth of roughly 3.1% . This is a sign of a healthy labor market. The labor force participation rate and the employment population ratio also inched up very slightly. These strong results provide some validation for the Federal Reserve’s first interest rate hike in nearly a decade, which occurred in December.

Global weakness as well as falling oil prices still loom on the horizon. On two separate occasions this week, the Chinese stock market fell by more than 7 percent, prompting a halt to trading on Wednesday. Uncertainty about the interest rate environment, as well as concern about the Chinese stock market caused the Dow, Nasdaq, and S&P 500 to close down, despite the strong jobs report. This, among other data concerns prompted GDP Now, a predictive algorithm maintained by the Federal Reserve Bank of Atlanta, to revise its estimate of quarterly GDP in the fourth quarter of 2015 from 1.0 percent to 0.8 percent.

Many observers noted weakness in the U.S. economy in the fourth quarter – signs that showed up mainly in the purchasing managers indices and industrial production. So far that pressure has not appeared in the U.S.  labor market.  The number of people employed part time for economic reasons has continued to decline as has the duration of unemployment.

How long this recovery can continue in the face of much global turmoil remains to be seen, but for the time being the major puzzles of the labor market seem to be structural not cyclical.  We will discuss these structural issues in a subsequent post.

empchgm-2016-01-08

oil-2016-01-08
Average hours of work remained at 34.5 and average hourly pay fell slightly to $25.24 from $25.25.

avghours-2016-01-08

epr-2016-01-08


compensation-cyc-2016-01-08


prod-cyc-2016-01-08 uduration-2016-01-08

udur27-2016-01-08


parttime-2016-01-08


beveridge-2016-01-08