By Thomas Cooley, Ben Griffy and Peter Rupert
The BLS announced this morning that the establishment survey data revealed only a modest increase in employment of 156,000 for September. In addition, the July number was revised down from 275,000 to 252,000 but August was revised up from 151,000 to 167,000, so overall pretty much a wash as to the overall state of employment.
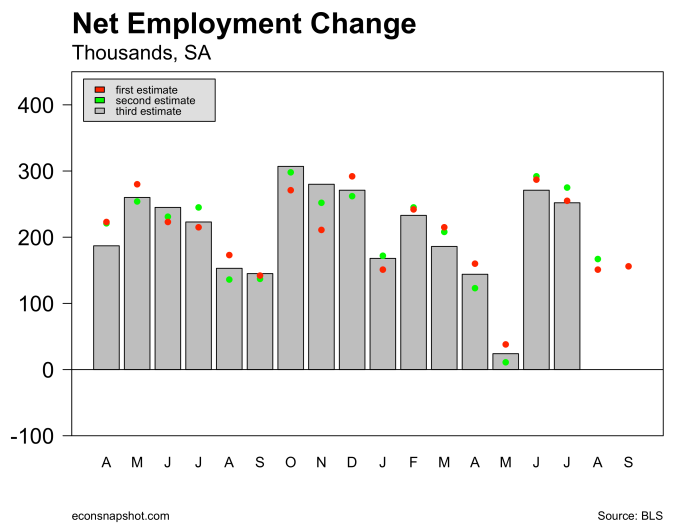
The labor market has averaged around 200,000 per month over the previous year. It appears clear from this report that it provides little help in assessing the next FOMC move.
Private sector employment was up 167,000 and government employment fell 11,000. This was consistent with the GDP report for Q2, which reported that state and local government spending had fallen. The mining and logging sector (oil sector is included) showed no decline in employment, the first non-negative number in two years.

Employment in the manufacturing sector shrank for the second consecutive month, down 16,000 in August and 13,000 this month. The services sector gained 157,000 jobs.
Average weekly hours rose slightly from 34.3 to 34.4.
The household survey showed a somewhat more robust looking labor market. The number of employed according that survey increased 354,000, with the labor force increasing 444,000. The overall impact drove the labor force participation rate up from 62.8 to 62.9.

The increase in the labor force moved the unemployment rate up slightly from 4.92% to 4.96%, so does not look quite as drastic as going from 4.9% to 5.0% as reported.

Looking at the composition of the unemployed since 2007 shows that job losers as a fraction of the unemployed are even lower than they were in 2007 and reentrants are a higher fraction of the unemployed. Job losers at the nadir of the recession accounted for about 65% of the unemployed but only about 50% today. On the other hand new entrants accounted for about 6.5% of the unemployed at the nadir and now account for over 10%. The graph below shows how each of those changed since 2007.

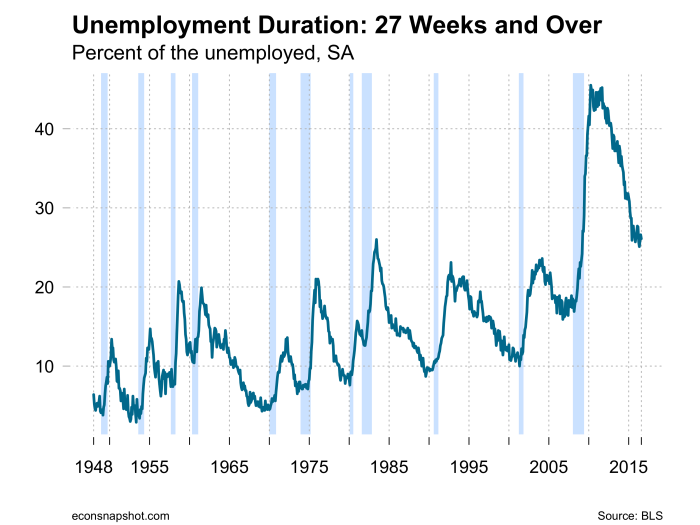
The number of persons unemployed 27 weeks and longer fell slightly but is moving quite sluggishly and as a fraction of the unemployed remains at about a quarter, still higher than any time since 1948.
Once again the employment report does not help much in assessing what the FOMC will do at the next meeting. While the report showed continuing strength in the labor market and according to some beat expectations…still nothing to write home about.