Q3 GDP Gets a Lift and Invites a Global Perspective on the U.S. Economy.

by Zach Bethune, Thomas Cooley and Peter Rupert

GDP Report

The BEA announced the second estimate for real GDP this morning, boosting Q3 growth to 3.9% from 3.5% announced in the advance estimate. The increase came largely from boosts in  business investment and consumption. The equipment component of business fixed investment increased 10.7%. Residential structures showed only a 2.7% rise while the Case-Shiller and FHFA home price indices were essentially flat.

The contribution of investment to GDP growth was less than a third of the contribution in the second quarter while the contribution of Exports, while still positive, was less than a half of what it was.  The GDP numbers suggest that the U.S. economy is strong and resilient although there are reasons for concern. Chief among these concerns is that major trading partners of the U.S. are struggling – some of them mightily.  In this post we look at the U.S.in relation to other major trading partners and the powerful emerging economies. Our comparisons are somewhat hampered by the reliability and availability of data (see our rant on europeansnapshot) but we show what we can.

gdprealchgm-2014-11-25
The U.S. in Perspective

North America

The first thing to note is that North American Economy as a whole is recovering well. The U.S., Canada and Mexico are all expanding in the seven years since the financial crisis of 2007-2009 brought many of the worlds economies to their knees. The picture below shows the trajectory of the North American economies since the financial crisis.  This is important because Canada is the top U.S. trading partner and Mexico ranks third behind China. If these economies were faltering that would hold back the U.S. but they are not.


gdp-US-CAN-MEX-2014-11-26


Europe and Japan

Outside of North America the other most important trade relationship is with Europe. Taken as a whole the EU accounts for 17% of world GDP, slightly more than the U.S. Europe – U.S. trade accounts for 40% of world trade in services and 30% of world trade in goods. Japan accounts for about 5% of world GDP and is the fourth largest trading partner.  The picture below shows that Europe and Japan are both stagnant.  The European debt crisis is in the past but the crisis revealed many weaknesses in the design and execution of European integration that has resulted in what we called Europe’s Lost Decade on our companion blog. Japan has experienced two quarters of recession as Mr. Abe’s “three arrows” policy has seemingly backfired.  Although the U.S. looks strong by comparison to these major trading partners their weakness constitutes a major headwind for the U.S. economy.  If they are not well it is harder for us to do well.

gdp-US-EU-Japan-2014-11-26


GDP slowing in BRICS

Much of the momentum in the world economy for the past decade has been contributed by the fast growing emerging market economies referred to as the BRICS – Brazil, Russia, India, China and South Africa. Data limitations are a major limitation in looking at these economies but the pictures below give a sense of the recent pattern. Brazil has slipped into recession as has Russia. Partial data suggests that Chinese growth is slowing. The BRICS excluding China seem to be slowing somewhat, growing more at the pace of the U.S. than at their historical pace.

gdp-US-BRICS-2014-11-26

gdp-US-EU17-Japan-BRICS-2014-11-26

gdp-US-EU17-Japan-BRICS-no-china-2014-11-26

The Engine of World Growth? 
However disappointing we may find the pace of this recovery, The U.S. and North American economies look decidedly stronger than those of our other major trading partners. Without more widespread recovery U.S. growth will be held back. But Japan and Europe suffer from structural problems – unfavorable demographics and inefficient labor markets that are not easily fixed. It may be that we should be giving thanks for our blessings.

The Labor Market is Recovering Well and the Case Strengthens for the Fed to Normalize

by: Zach Bethune, Thomas Cooley, Peter Rupert

The Bureau of Labor Statistics release of the October jobs report showed continued steady improvement in the US labor market. Total non-farm payroll employment increased by 214,000, just slightly below the average monthly gain of 222,000 observed over the previous twelve months. Moreover, September employment gains were revised up by 8,000.

empchgm-2014-11-07

While the gains were broad-based, the bulk of the increase occurred in private service sector at 181,000. Employers are increasing their work force at both the extensive margin (jobs) and the intensive margin (hours). Average weekly hours increased slightly as did average hourly earnings.

avghours-2014-11-07

ahe-2014-11-07

The official unemployment rate moved down to 5.8%, the lowest rate since July, 2008, and the U-6 rate (Total unemployed, plus all persons marginally attached to the labor force, plus total employed part time for economic reasons, as a percent of the civilian labor force plus all persons marginally attached to the labor force) fell to 11.5%. The employment to population ratio and labor force participation increased.

uu6rate-2014-11-07

epr-2014-11-07

lfp-2014-11-07


Transition Rate Up for Long-term Unemployed…

While the median unemployment duration ticked up in October from 31.5 to 32.7 weeks, the rate at which workers are finding jobs has shown steady improvement. Since early 2014, the unemployment to employment transition rate has increased for all workers, particularly for those unemployed less than 14 weeks.

UE-rate-duration-2014-10-03

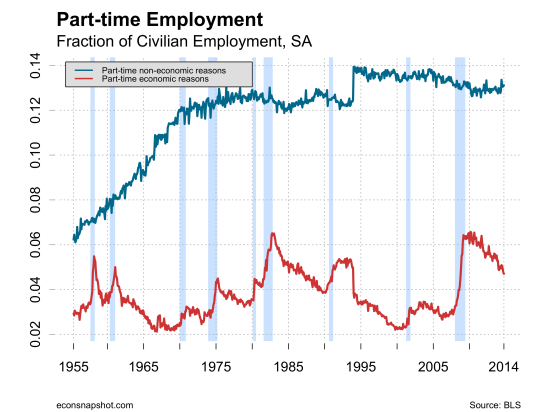
The number of employees working part-time for economic reasons (PTER) has also declined as the number of persons stating they could only find part-time employment fell by 115,000. This group of workers has been a focus of the Fed in describing the ‘slack’ still existent in the labor market.

parttimefrac-2014-11-07

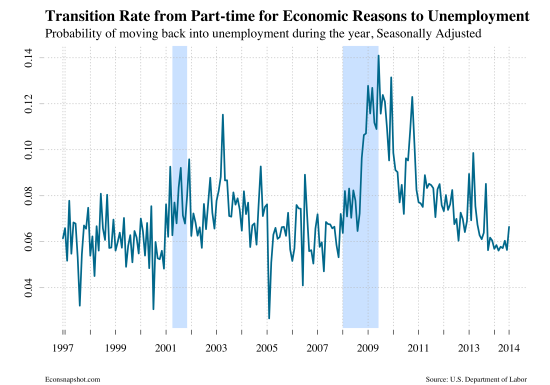
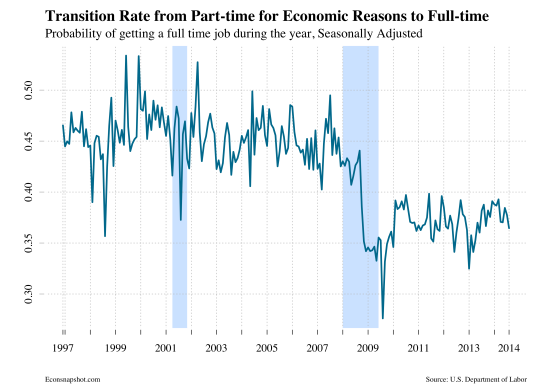
In the figures below, we show the rate at which these workers either return to unemployment or find full-time work. The transition rate into unemployment has entirely returned to its pre-recession level. PTER workers are not losing their jobs as frequently as during the depths of the recession. However, we do still see that these workers aren’t finding full-time employment at the rate they once did before 2007. In fact, the transition rate from PTER into full-time employment hasn’t shown any signs of improving in the previous 5 years, despite accommodative monetary policy.

rate-pter-unmp-2014-10-28

rate-pter-fter-2014-10-28


This is all evidence of a healthy, recovering labor market.  Some of the overhang of the great recession will be with us for a long time. For instance, people unemployed for long durations are going to move only very slowly back to employment because long spells of unemployment erode skills and diminish employability.  Stimulus policies will not impact these workers very much – only targeted skill building programs will.


A Fed Call to Arms?

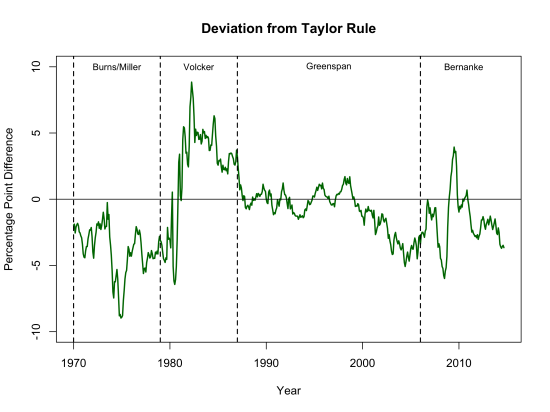
Given that the labor market now seems reliably recovered and GDP growth is steadily positive it seems to be time for Fed  to put aside its fear of the consequences and restore normalcy to monetary policy.  It is important not only because of the dangers of waiting too long but also because of the hidden costs of the current policy. Keeping the Federal Funds rate at zero for an extended period has distorted economic decisions and financial markets as investors search for yield and seem to take on more risk. It has also arguably increased income inequality precisely because of the wealth effect the policy was designed to create. Moving back to a normal monetary policy need not be disruptive and should enhance the Fed’s credibility going forward.  The graph below shows the Federal Funds rate implied by the Fed’s earlier announced goal of a 6.5% unemployment rate. While everyone realizes that is not the current goal it illustrates the case for a return to conventional monetary policy.

taylor-rule-2014-11-08 taylor-rule-deviation-2014-11-08


Q3 GDP: Continued (Sporadic) Recovery

by Zach Bethune, Thomas Cooley and Peter Rupert

GDP Report

The BEA announced in the advance estimate that real GDP increased at a s.a.a.r. of 3.5% for 2014 Q3. The estimate is down over a percentage point from the 4.6% growth rate in the second quarter, although it is still in line with the average pace of growth during the current recovery of 2.16%.

gdprealchgm-2014-10-30


expansion-growth2014-10-30

The growth in GDP was led by an increase of 1.8% in personal consumption expenditures which also cooled off from its 2.5% rate in the second quarter. Other components contributing to the increase were exports (7.8%), nonresidential fixed investment (5.5%), and both federal (10.0%) and state and local (1.3%) government spending. The increase in federal defense spending (16.0%) was the largest since 2009 Q2. Defense spending and inventories have a habit of reversing in subsequent quarters so it is not necessarily a robust improvement in the outlook.

pcerealchgm-2014-10-30


Real personal income increased at an annual rate of 3.2%, up slightly from its second quarter growth rate of 2.9%.

rpichgm-2014-10-30

ahe-2014-11-01 eci-2014-11-01


A day before the BEA release, the FOMC released this statement on October 29. The FOMC ended Q3, but kept the possibility that if things deteriorated they could drag it out again. The statement was guarded when talking about recent conditions (highlighted text is ours):

…economic activity is expanding at a moderate pace. Labor market conditions improved somewhat further, with solid job gains and a lower unemployment rate. On balance, a range of labor market indicators suggests that underutilization of labor resources is gradually diminishing. Household spending is rising moderately and business fixed investment is advancing, while the recovery in the housing sector remains slow.


The most significant early signal of improvements in the labor market came from the employment cost index ( abroad measure that includes benefits) which, after months of staying flat, showed a sharp spike up in recent months.  Average hourly earnings are also moving higher in recent months.  Fed watchers will be watching this closely in the coming months to see if it portends increasing price pressure elsewhere in the economy. Nevertheless, the most likely outcome for the near future is that inflation will continue to be below target and interest rates will continue at their current level.