By Ben Griffy
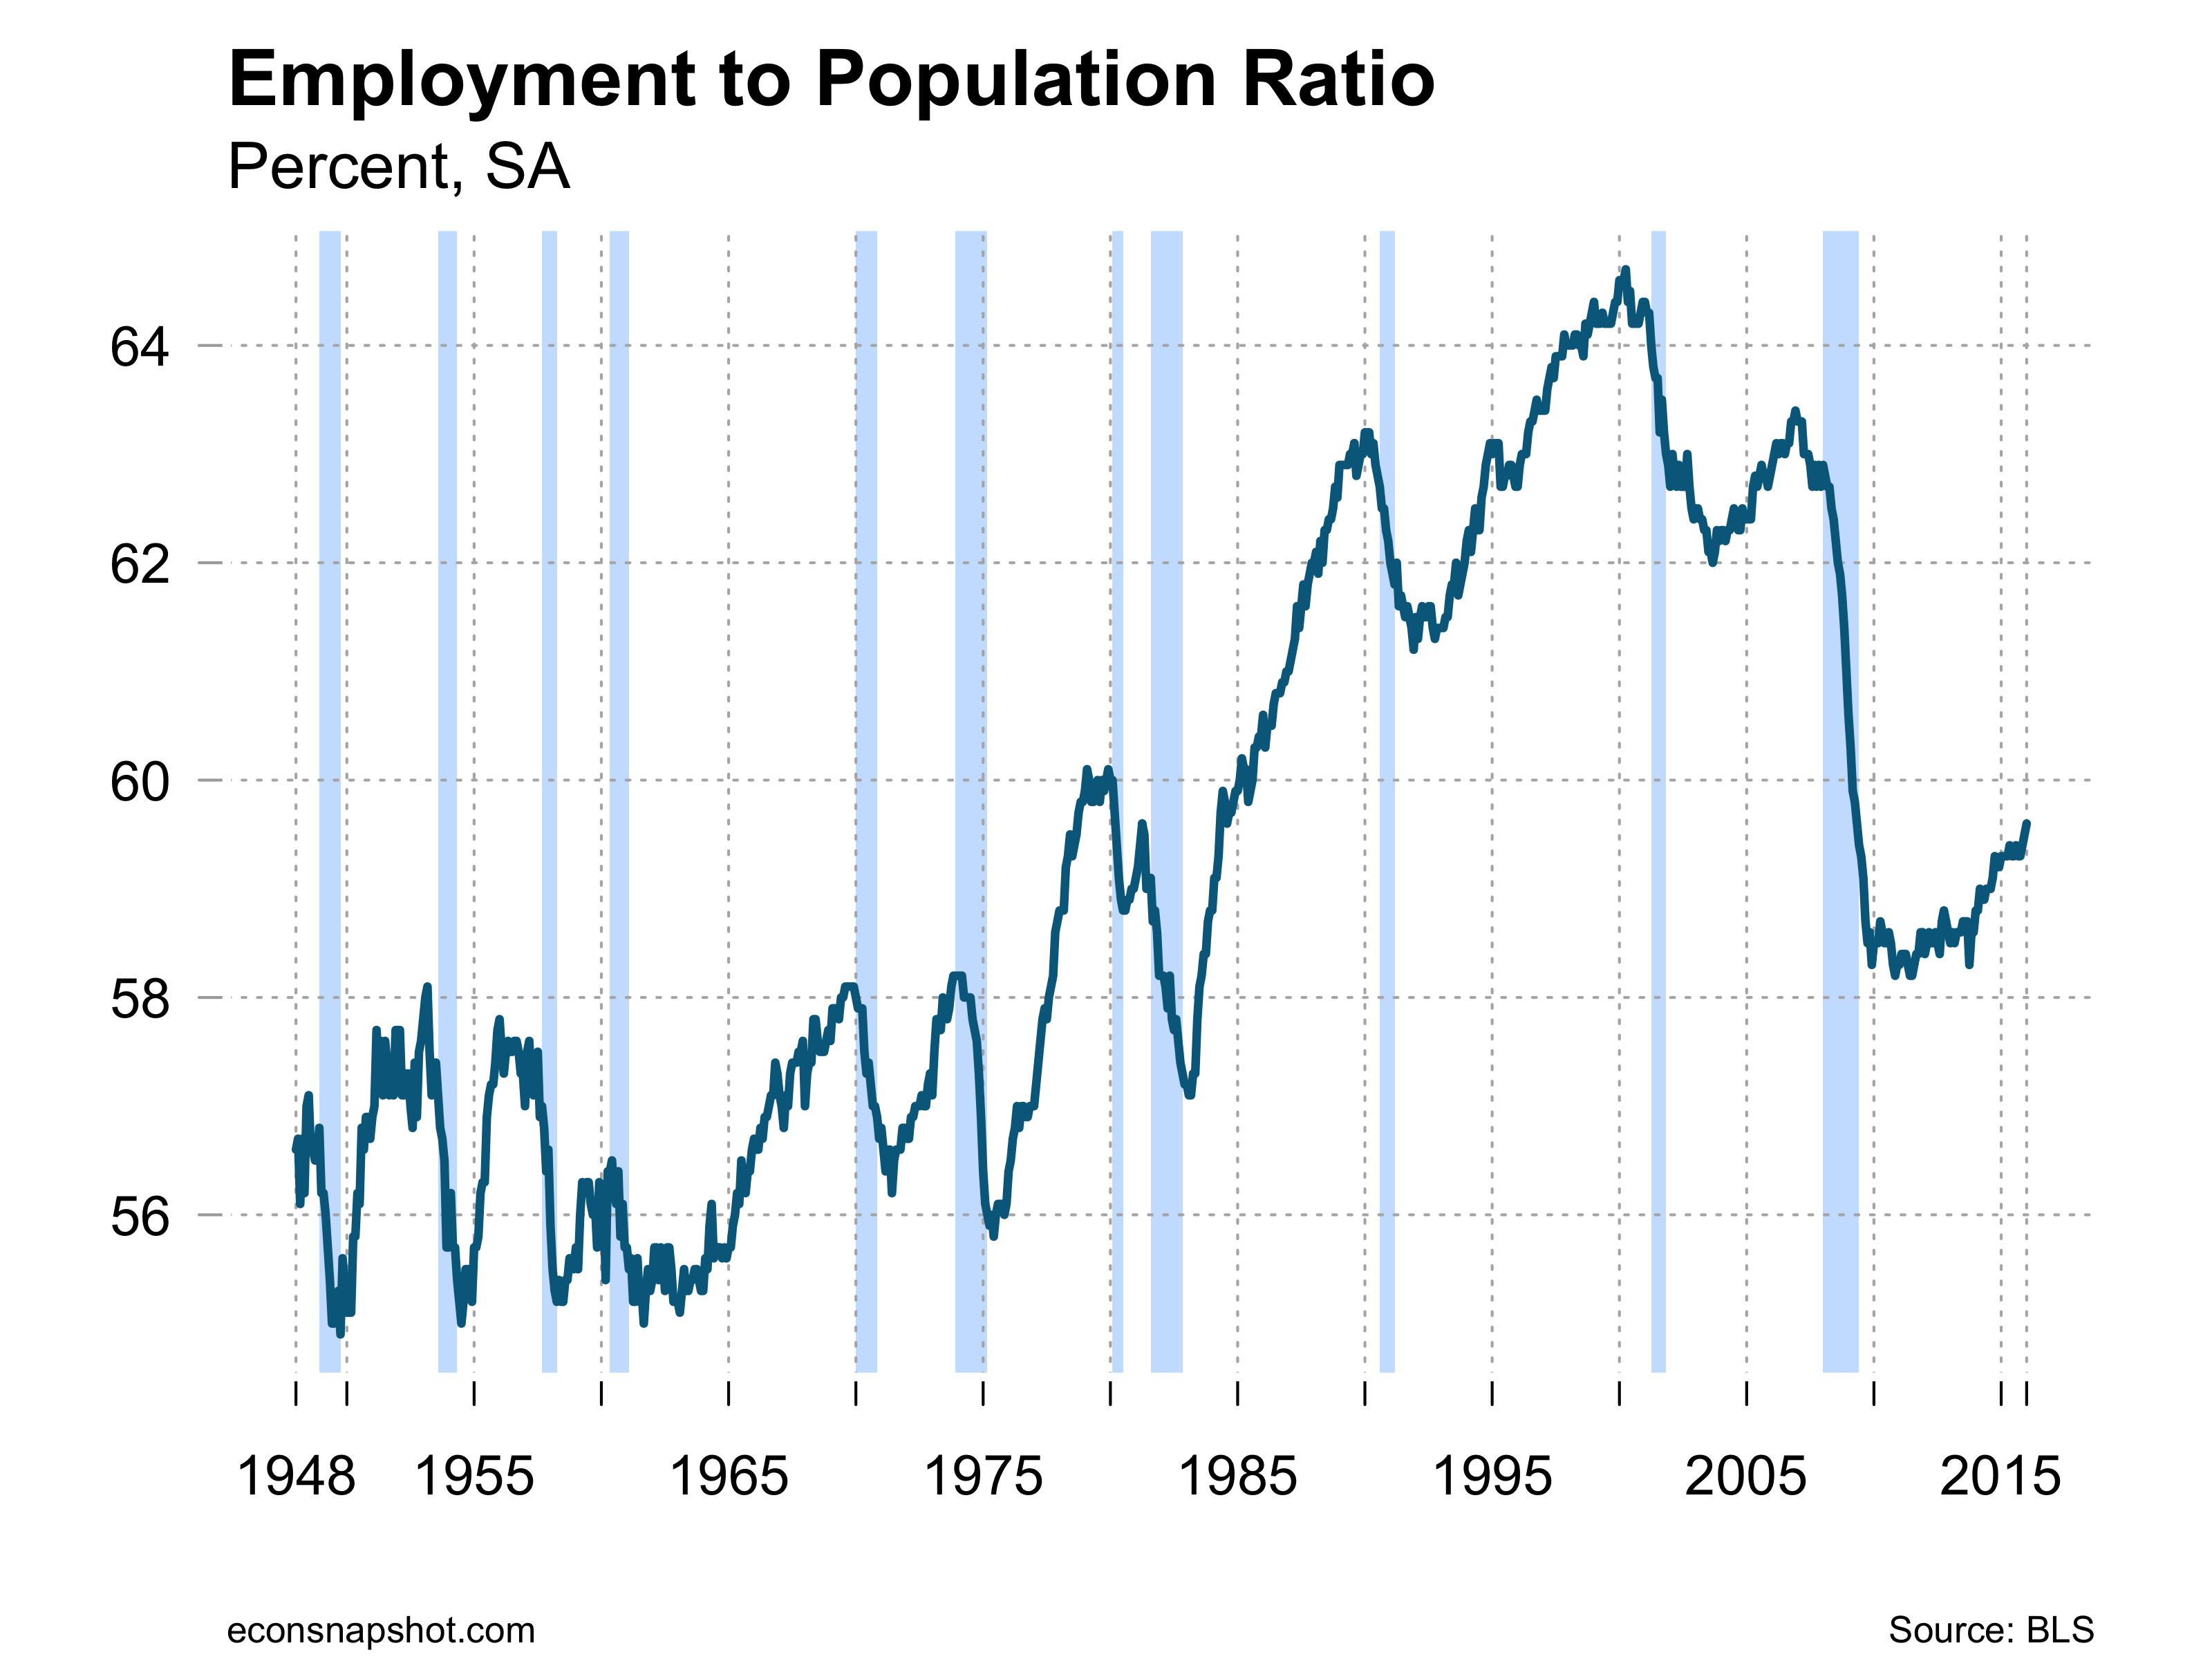
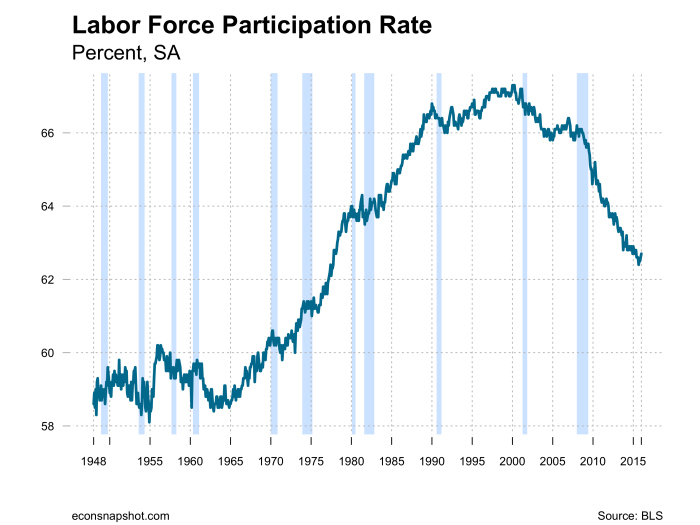
The past 15 years have seen a striking decrease in the ratio of civilians employed to the size of the total working population. From 1948 (the earliest date at which statistics are available) to 2000, the labor force participation rate (LFPR) increased from 58.6 percent to 67.3 percent. Since, the LFPR has fallen to 62.4 percent, a rate last matched in the 1970s. 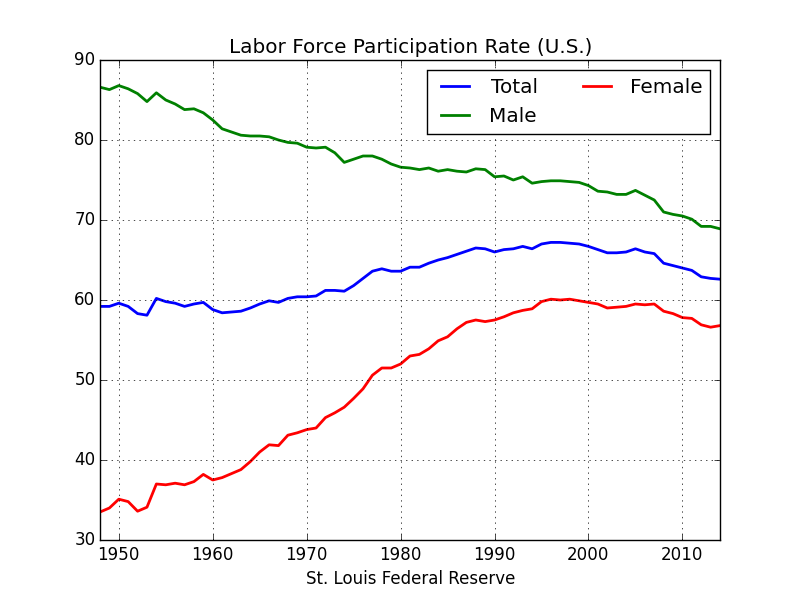 Furthermore, we have not seen a similar drop among Eurozone economies, creating some cause for concern that these changes are a sign of structural labor market weakness in the United States.
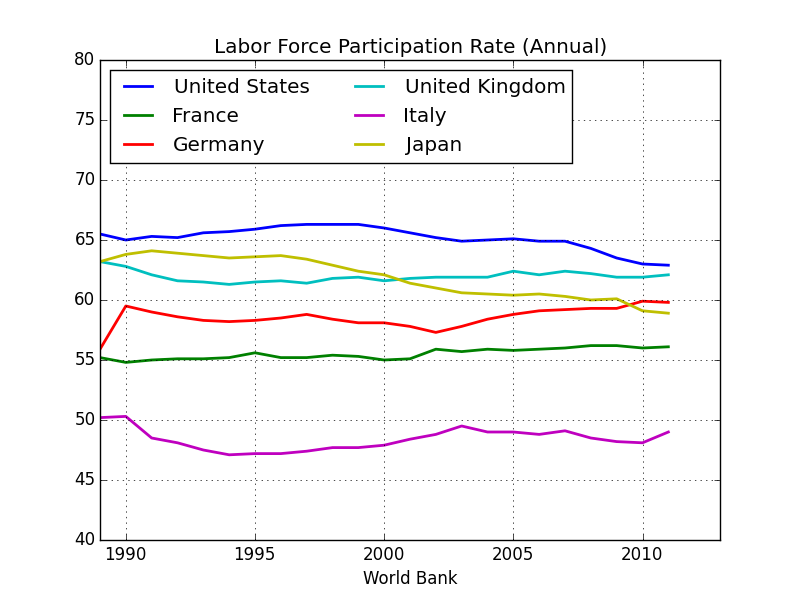
There are a number of factors that could be driving the current decline and the differences across countries. Demographic changes are certainly an important component, both in the increase in LFPR and the current decline. From 1948 to 2000, female labor force participation increased from 32 percent to 60.1 percent (see above), accounting for the increase in overall participation. Male labor force participation declined during the same period: (see above). Another important factor is that the United States population has been aging during this time period, and different age groups exhibit different participation rates, as well as different numbers of hours worked at the intensive (i.e. number of hours worked at a single job) margin. This blog post by the St. Louis Fed suggests that if we control for the decline in “prime working age” adults, there has only been a small decline in the overall participation rates during the same time period. However, since 2010, there has still been a more than 2 percentage point decline in the LFPR. This may support the idea that labor markets have weakened in the United States.
Demographics alone do not explain why the labor market in the United States appears to be weakening. Europe has experienced an aging demography in larger magnitudes (see here) and have shown small, if any, declines in LFPR. A recent article in the Financial Times details the stark differences in labor force participation across countries, most notably the difference between the United States and Japan, an economy with a much older labor force. However, there are structural differences between the US and Europe that are worth addressing.
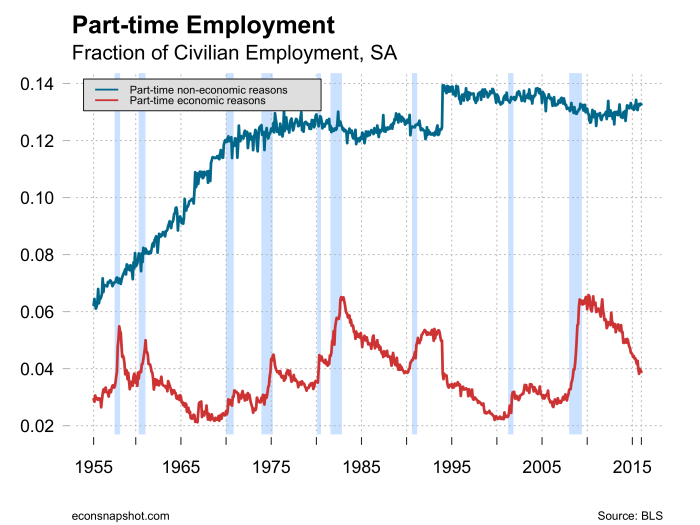
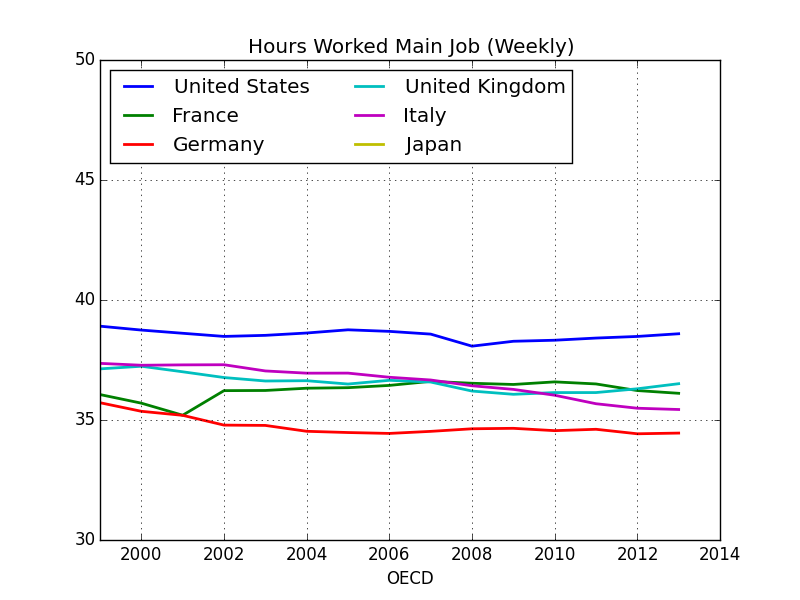
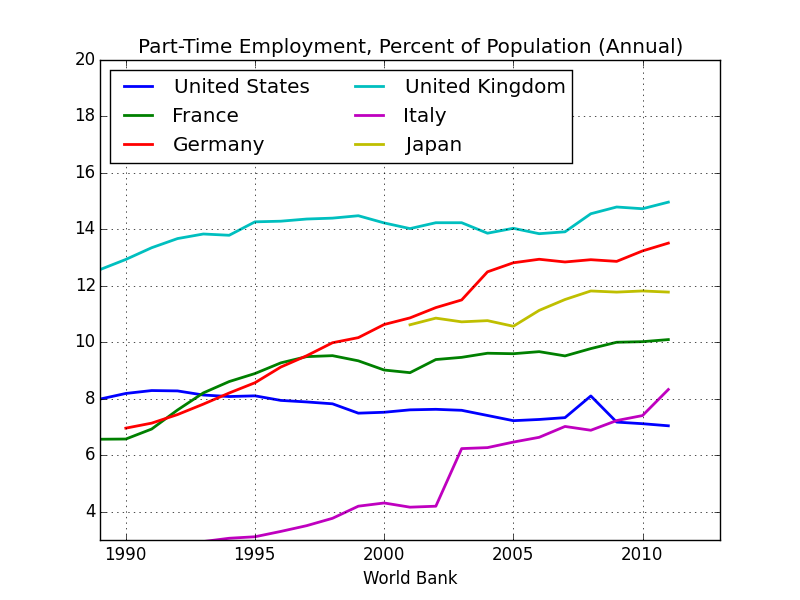
It is important to distinguish here between the intensive and extensive margins. Since 1980, the United States has seen only a small decline in average hours worked by an employed individual (see here), while there has been a large decline in the equivalent measures in both the UK and Japan. Here, it is important to note that the UK has a substantially larger share of individuals employed part-time, and the size of this share has accelerated relative to the United States. When we break employment down into part-time and full-time components, we see a different picture of the labor market. Namely, part-time employment has fallen in the US, while part-time employment has risen in comparable European economies.
This distinction is important when comparing the health of labor markets across countries. The United States has maintained strong full-time employment even following the Great Recession, while part-time continued a trend of longer-term decline. This translates into a very different story in terms of hours worked: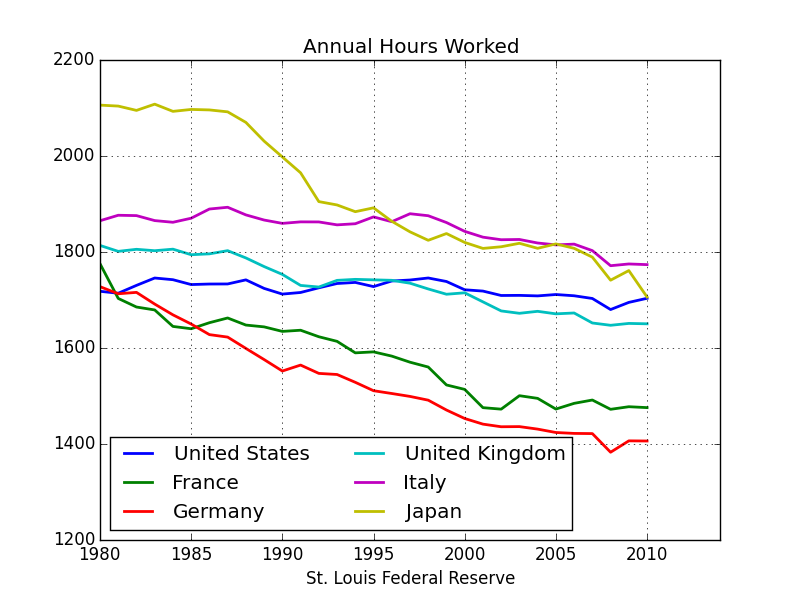 The United States has had a small decline in hours worked over the past twenty years, while Europe has seen a drop from either similar levels to significantly lower levels than the United States, or previously higher levels than the United States to similar levels. The differences is that the United States has maintained higher levels of full-time employment, while Europe has averaged fewer hours at full-time work, and seen increases in part-time work.
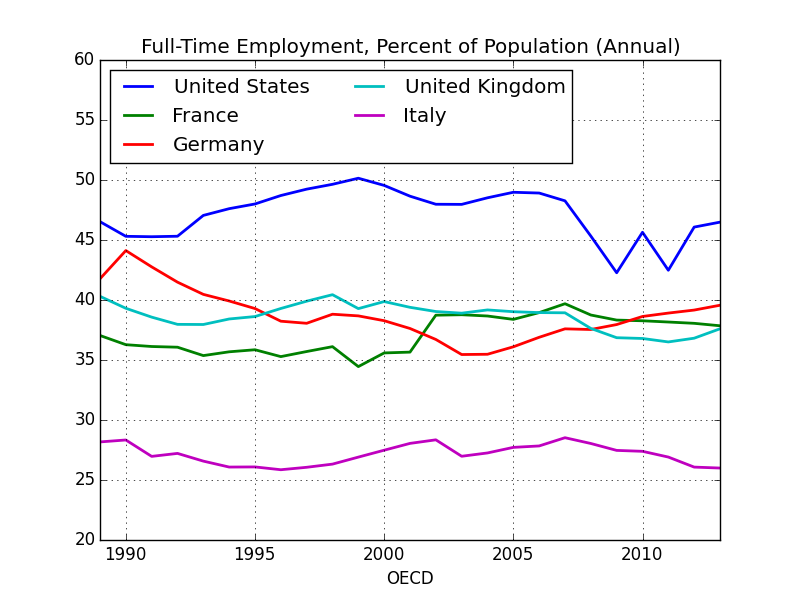
We see a similar story when we distinguish by age group. Economists are particularly concerned about the participation of “prime-aged male workers,” those from ages 25-54, when they could be expected to contributing most to the economy. However, there is little evidence of a decline in full-time employment among this age group: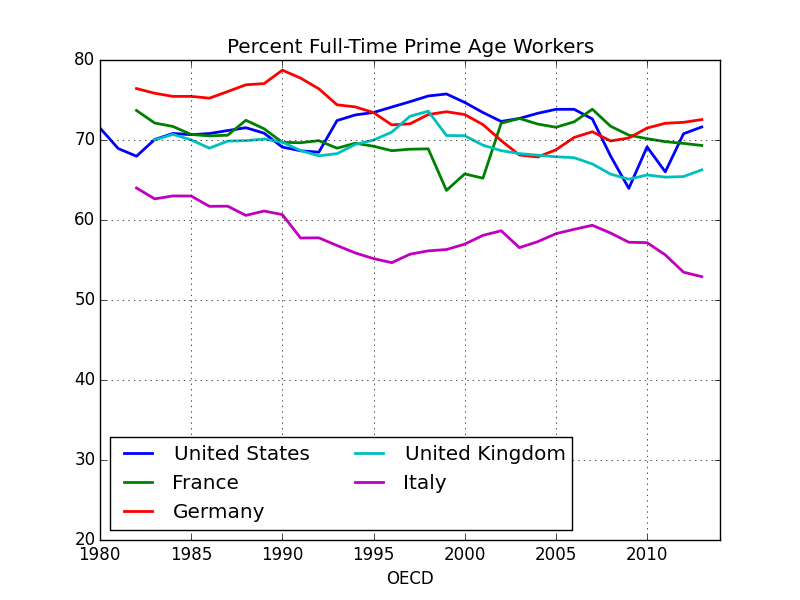
We see that the United States has experienced little to no change in the percent of age 25-54 workers with full-time employment, outside of cyclical changes. Certainly, one cannot distinguish a long-term decline relative to European peers.
Europe and the United States are commonly juxtaposed to show that the US has suffered a weakened labor market. It is true that the United States has seen large declines in labor force participation when compared with the European Union. However, there are a number of factors at play that suggest the labor market has not weakened as substantially as the data on labor force participation might suggest. The United States population has aged during the same period, which accounts for some of the differences in LFPR. Additionally, the US appears to have undergone different structural changes than its European counterparts: most of the gains in participation rate in Europe have been through part-time jobs, while the United States has seen gains to both hours worked and full-time employment. Thus, while the participation rate suggests that the health of the labor market in the United States has declined relative to its European peers, other indicators make such a conclusion unclear.
