By Thomas Cooley, Ben Griffy, and Peter Rupert
There has been a rash of recent data showing the U.S. economy growing stronger. Rising incomes, stronger domestic demand, and rising net exports are signaling a more robust economy. The upward revisions to second quarter GDP support that view and the hope and reasonable expectation is that the third quarter will be stronger still setting the table for a Fed rate hike later this year. The third estimate for second quarter GDP growth, released this morning by the BLS (link) estimates that the US economy grew at an annualized rate of 1.4% in the second quarter, up from a previous estimate of 1.1%, and up from the first quarter, in which the rate was 0.8%.

These gains were largely accrued from increases in personal consumption expenditures, which increased at an annualized rate of 4.3%, exports, which grew at a rate of 1.8%, and fixed nonresidential investment, which grew at a rate of 1.0%. Offsetting these gains were declines in residential investment, of 7.7%, government spending (national fell 0.4%, while state and local fell 2.5%), and imports, which rose 0.2%. It should be noted that the levels of the categories that grew dwarf the levels of those that declined, leading to the overall increase in headline numbers.

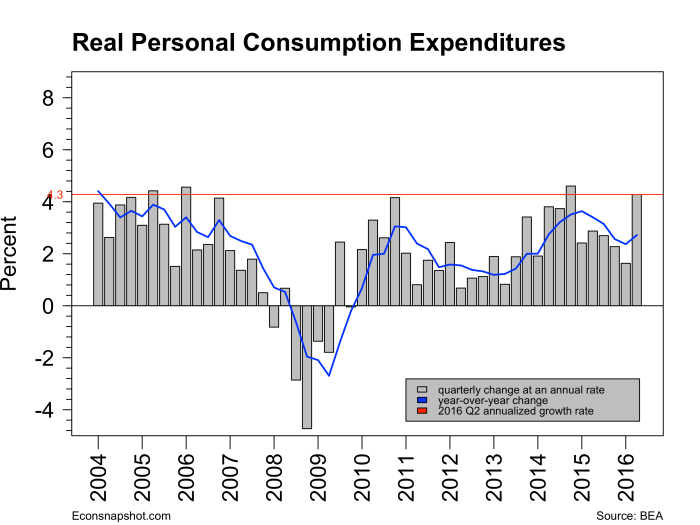
As noted, personal consumption expenditures (PCE) played the largest role in GDP growth last quarter. This bucked a trend over the previous four quarters in which percent growth in the component had fallen, while still remaining positive. Growth in the component more than doubled over the Q1 figure, and was nearly at its highest rate of growth since the Great Recession. This is a strong indication that US consumers are confident in the direction of the US economy. For comparison, many European economies have not seen consumption growth of 4.3% in total since the beginning of the Great Recession: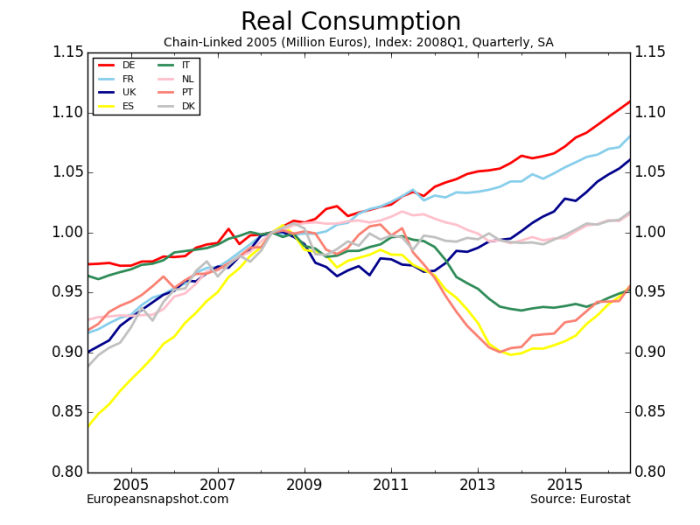
Which shows the importance that the US economy has as a global driver of growth. In total, changes in PCE would have caused a 2.88% increase in GDP, all else equal.
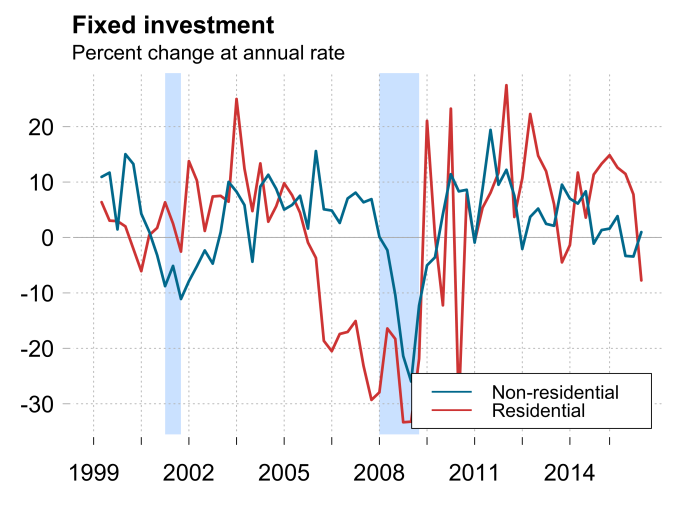

Residential and non-residential investment swapped growth trends, with non-residential investment ticking positive for the first time in three quarters, and residential investment turning negative for the first time since 2013Q4. Nonresidential investment was driven up by increases in expenditures on industrial equipment, and intellectual property products, with the latter increasing by 9.0% at an annualized rate. Overall, Gross Private Domestic Investment caused a decline in GDP of 1.34%, if all other components were held constant.
The report should be taken with cautious optimism that the US has absorbed some of the global economic uncertainty in stride. Even more cause for optimism is that GDP growth would have been 1.7% annualized if the contribution of government spending had been removed, a highly variable series that has limited forecasting ability on the health of the economy, particularly in an election year. These figures are perhaps inauspicious in comparison to the halcyon heights of US economic history, but in the context of our times, they continue to reflect the strength of the US economy in period of great uncertainty.


