Final Estimate of 4th Quarter GDP

by: Zach Bethune, Thomas Cooley, Peter Rupert

The third and final estimate of GDP released today by the Bureau of Economic Analysis provides no substantial new information on the growth of the economy…and therefore little to guide us to the future of interest rate changes by the FOMC. The final number for real GDP growth for Q4 is 2.2%, seasonally adjusted at an annual rate.

gdprealchgm-2015-03-27

Since the negative growth rates in 2008 and 2009, real GDP growth has been weak, but fairly steady year to year, 2010: 2.5%, 2011: 1.6%, 2012: 2.3%, 2013: 2.2%, and 2014: 2.4%; but, as noted here and elsewhere, quite slow relative to previous expansions.

gdp-cyc-2015-03-27

Consumption growth received a small boost, as did net exports, but inventories took a hit.

pce-cyc-2015-03-27

Real investment took about 25 quarters to get back to it 2007 peak, typically taking only about 10 quarters. Residential fixed investment has yet to get back to its peak in 2007, it is still about 14% below that level.

inv-cyc-2015-03-27

nrfi-cyc-2015-03-27

rfi-cyc-2015-03-27

imp-cyc-2015-03-27

exp-cyc-2015-03-27

There is still real debate within the FOMC, however. From KC President George’s remarks: “While the FOMC has made no decisions about the timing of this action, I continue to support liftoff towards the middle of this year due to improvement in the labor market, expectations of firmer inflation, and the balance of risks over the medium and longer run. Liftoff in the middle of this year, in my view, would be fully consistent with the FOMC’s Statement on Goals and Monetary Policy Strategy, which reminds the public that monetary policy actions tend to influence economic activity and prices with a lag.” But, Chicago President Evans from a speech in London: “What is my personal view of the appropriate path for Fed policy? I think economic conditions are likely to evolve in a way such that it will be appropriate to hold off on raising short-term rates until 2016.”

In their own words, the future of lift-off will be “data-driven.” When isn’t it?

February Employment Stays Strong

by: Zach Bethune, Thomas Cooley, Peter Rupert

According to the Bureau of Labor Statistics establishment survey, employment increased 295,000 from January to February and has increased by about 3.3 million since February 2014. January employment was revised down slightly by 18,000 and December had no revision.  This continues the trend of strong employment growth consistent with an an ongoing robust recovery.  The unemployment rate fell further to 5.5% average weekly hours were flat and average hourly earnings rose only slightly. 

empchgm-2015-03-06

Job gains were robust, only mining and logging, non-durable goods, and temporary help services saw small declines. Is the decline in temporary help services, for the second month in a row,  a signal of underlying strength in that firms are relying more on full-time workers rather than temps?  Maybe, but, as the chart below shows, as a fraction of total employment, firms use temp help much less during downturns.  Moreover, the use of temp services has doubled relative to total employment since the early 1990’s.

temps-2015-03-06

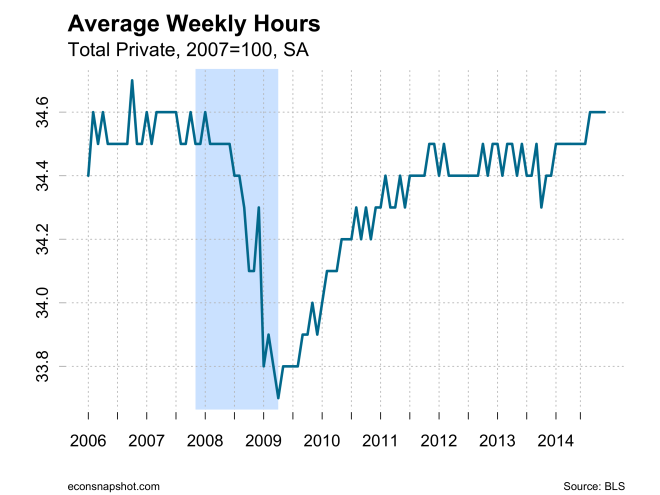
Average weekly hours have remained fixed at 34.6 for the past 5 months after being stuck at 34.5 for the previous 7 months. Average hourly earnings rose only slightly from $24.75 to $24.78.

avghours-2015-03-06

While the establishment survey provided solid numbers, the household survey provided some mixed messages. True, the unemployment rate fell from 5.7% to 5.5%.

unrate-2015-03-06

But the labor force fell by 178,000 leading to a decline in labor force participation from 62.9 to 62.8 and no change in the employment to population ratio at 59.3.

lfp-2015-03-06

epr-2015-03-06

The number of persons working part time for economic reasons fell by 175,000, with 165,000 fewer reporting slack work reasons. The number of persons reporting part time for non-economic reasons increased by 15,000.

parttimefrac-2015-03-06

All of this seems to provide further support for the view that the Fed should begin normalizing monetary policy sooner rather than later. Although recent communications have emphasized the view that they could be “patient,” we expect that language to disappear. The graphs below show the continued strength in the labor market, albeit slower than coming out of previous recessions.

emp-rec-rec-2015-03-06

unemp-rec-rec-2015-03-06

4th Quarter GDP….Downward Revision….Keeps Us Guessing

by Zach Bethune, Thomas Cooley and Peter Rupert

GDP Report
The BEA’s second estimate of 4th quarter GDP trimmed the growth rate to 2.2% from 2.6%. The downward revision will certainly give those more “patient” policy makers additional ammo to sit back and let the dust settle further before making any moves.

gdprealchgm-2015-02-27

Since the recovery began, real GDP has continued a long, slow climb out of the depths. As is evident in the graph below, the growth has been weaker than the typical recovery. Said differently, almost 30 quarters since the previous peak real GDP is less then 10% higher now; however, in the past real GDP was 20-30% higher after 30 quarters from the previous peak.

gdp-cyc-2015-02-27

Meanwhile, a version of the Taylor Rule with unemployment targeted at 6% and inflation at 2% calls out for an increase…and has been for more than 4 years.

taylor-rule-2015-02-27

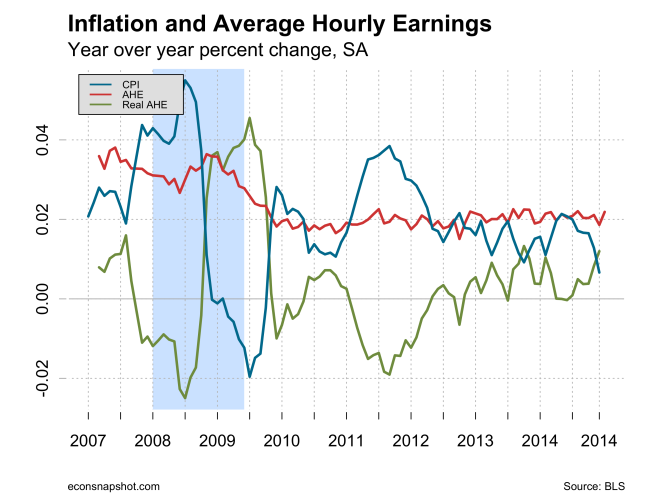
However, average hourly earnings growth has been anemic, stuck around 2% since 2010, meaning any changes in real earnings came from changes in inflation. The latest drop in inflation has meant an increase in real hourly earnings of about 2%. As can be seen in the graph below real hourly earnings growth since 2010 spent lots of time in negative territory, rarely hit even 1% and has averaged about zero.

ahecpi-2015-02-28

Moreover, five year out inflation expectations are also low.

inflation5yr-2015-02-28

With no inflation pressures now or later, many on the FOMC likely feel little reason to begin liftoff. Indeed, from Chair Yellen’s remarks to Congress,

In sum, since the July 2014 Monetary Policy Report, there has been important progress toward the FOMC’s objective of maximum employment. However, despite this improvement, too many Americans remain unemployed or underemployed, wage growth is still sluggish, and inflation remains well below our longer-run objective.

While many were thinking that liftoff might begin in the middle of this year, but these words from her testimony imply later rather than sooner,

The FOMC’s assessment that it can be patient in beginning to normalize policy means that the Committee considers it unlikely that economic conditions will warrant an increase in the target range for the federal funds rate for at least the next couple of FOMC meetings. If economic conditions continue to improve, as the Committee anticipates, the Committee will at some point begin considering an increase in the target range for the federal funds rate on a meeting-by-meeting basis.

But recent data have confirmed that falling oil and commodity prices may be masking movements in prices. Core inflation – excluding food and energy – jumped at the last reading and markets reacted.  The FOMC seems to be leery of acting too soon on liftoff but the bigger worry is that the costs of acting too late might be higher.

Finally, from the end of the testimony,

As always, the Federal Reserve remains committed to employing its tools to best promote the attainment of its objectives of maximum employment and price stability.

Good to know, thanks.

Strong January Employment Report

by: Zach Bethune, Thomas Cooley, Peter Rupert

The Bureau of Labor Statistics release of the January jobs report shows continued strength in the labor market, with total nonfarm employment rising 257,000. Moreover, the current increase, along with revisions over the past two months show employment growth averaging 336,000 over the past three months. The revision to November, up to 423,000, was the largest monthly increase since May of 2010.

empchgm-2015-02-06

In addition to the usual monthly revisions, the BLS also undertook annual re-benchmarking:

With the release of January 2015 data on February 6, 2015, the Bureau of Labor Statistics (BLS) introduced its annual revision of national estimates of employment, hours, and earnings from the Current Employment Statistics (CES) monthly survey of nonfarm establishments. Each year, the CES survey realigns its sample-based estimates to incorporate universe counts of employment—a process known as benchmarking. Comprehensive counts of employment, or benchmarks, are derived primarily from unemployment insurance (UI) tax reports that nearly all employers are required to file with State Workforce Agencies.

For those data geeks wanting to know more about benchmark revisions, here is the full article from the BLS. Summarizing that article, “The March 2014 benchmark level for total nonfarm employment is 137,214,000; this figure is 67,000 above the sample-based estimate for March 2014, an adjustment of less than 0.05 percent.” The BLS then uses the re-benchmarked data to revise the rest of the year, “From April 2014 to December 2014, the net birth/death model cumulatively added 968,000, compared with 841,000 in the previously published April to December employment estimates.”

Employment gains were robust, the only major sector to shed jobs was the Government sector, losing 10,000, meaning that Private sector jobs increased by 267,000.

Average weekly hours, however, have shown no change over the past 3 months, stuck at 34.6.
avghours-2015-02-06

Average hourly earnings ticked up slightly to $24.75, and growth has averaged about 2% per year since 2010, but with CPI inflation running below 2% of late means real hourly earnings are growing, albeit modestly.

ahecpi-2015-02-06

While the strong report certainly keeps the Fed on a steady *normalization* pace, there are still areas in the labor market that, if not troublesome, remain nagging issues. While the employment to population took a nose dive during the great recession…and is still quite low relative to its all-time (at least since WWII) peak…

epr-2015-02-06

…however, if one zooms in, there has been a steady increase over the past year and a half or so…

epr2-2015-02-06

Another somewhat nagging issue is the fate of the long term unemployed. Indeed, the number of those unemployed 27 weeks or longer actually rose in January, from 2.785 million to 2.80 million persons. The percent of the unemployed who are unemployed 27 weeks or longer has been bouncing between 31% and 32% for the last six months or so….
udur27a-2015-02-06The number of persons employed part time for economic reasons (or involuntary part-time workers) also didn’t improve in January. There remains 6.8 million individuals who would like to be working full time but couldn’t because the were unable to find full time work or had their hours cut back.

pter-2015-02-06

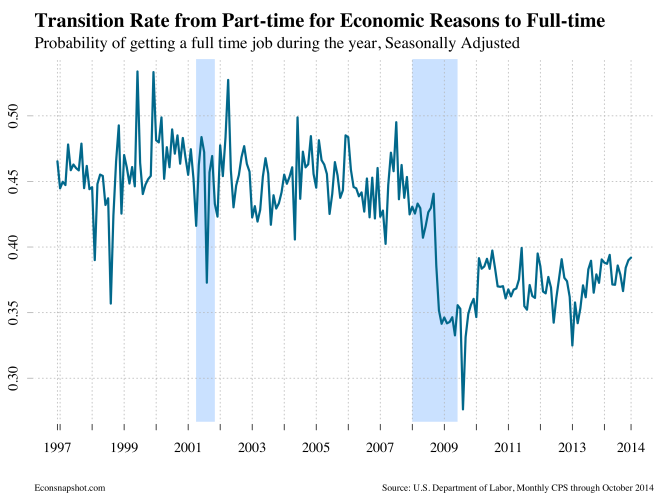
The rate at which these workers are transitioning into full time continues to show no improvement…rate-pter-fter-2015-02-06

…and their wages are declining relative to full time workers.
wage-ratio-2015-02-06It is no surprise that, despite a low 5.7% unemployment rate since October, there is still concern about the health of the labor market.

4th Quarter GDP and Compensation

by Zach Bethune, Thomas Cooley and Peter Rupert

GDP Report
The BEA’s advance estimate of GDP  for the 4th quarter shows a 2.6% increase in real GDP, sharply lower than the 4- 5.0% rises for the 2nd and 3rd quarter. This was below prior estimates and was largely taken by the markets as negative overall. Personal consumption expenditures led the positive side of things, growing at 4.3%, making it the largest contributor to growth. Exports and private nonresidential fixed investment also contributed to the growth. Working against that growth was an increase in imports, growing 8.9%, contributing -1.39 percentage points to the growth. Government spending also saw a large decline.

Although the growth was below the prior quarters, the economy increased at a rate of 2.5% over the prior year.  This continues to be respectable recovery although not as fast as many prior rebounds.  The open question is whether the moderation of the rebound reflects the drag created by the stagnant European and Japanese Economies and the slowing of the BRICS.  The strengthening of the dollar will begin to take a toll on exports over the coming quarters so it remains to be seen if the recovery can pick up any momentum.

gdprealchgm-2015-01-30 gdp-cyc-2015-01-30 pce-cyc-2015-01-30 inv-cyc-2015-01-30


Labor Markets

Also out today is the Employment Cost Index from the BLS. The ECI for all civilian workers increased 0.6% in the 4th quarter. Wages and salaries (70% of compensation) rose 0.5% while benefits (30% of compensation) increased 0.6%. Plaguing some policy makers is the weak response of compensation of employees; however, some are less concerned. From the FOMC minutes of the December meeting:

Although a few participants suggested that the recent uptick in the employment cost index or average hourly earnings could be a tentative sign of an upturn in wage growth, most participants saw no clear evidence of a broad-based acceleration in wages. A couple of participants, however, pointing to the weak statistical relationship between wage inflation and labor market conditions, suggested that the pace of wage inflation was providing relatively little information about the degree of labor underutilization.

Further, they see the recent decline in energy prices as helpful in supporting consumption growth. From Wednesday’s FOMC statement (emphasis added):

Information received since the Federal Open Market Committee met in December suggests that economic activity has been expanding at a solid pace.  Labor market conditions have improved further, with strong job gains and a lower unemployment rate.  On balance, a range of labor market indicators suggests that underutilization of labor resources continues to diminish.  Household spending is rising moderately; recent declines in energy prices have boosted household purchasing power.

compensation-cyc-2015-01-30

World Prices

by Thomas Cooley, Peter Rupert, and Zach Bethune

The problem of deflation is not just a concern for fans of American Football. It has been troubling economists and financial market observers since Japan slipped into deflation in their lost decade of the 1990’s and the concern has become more pronounced as the European Economy, particularly the Eurozone, has struggled to escape from a lost decade of its own following the financial crisis of 2007-2009 and has been on the brink of deflation – a sustained fall in the price level – for the past few years. Now, with commodity prices falling and the European Economy in continued stagnation, the ECB has finally decided to undertake some serious monetary stimulus in the form of large scale purchases of sovereign debt, as has been done in most of the other major economies of the world over the past few years. Their goal is to stimulate their stagnant economy, improve their competitiveness by lowering the value of the Euro relative to the dollar, and stave off deflation. In a global economy domestic policy actions have ripple effects, sometimes large ones, on other economies. If countries were all trying to improve their competitiveness at once it can look like a currency war or at least be confusing.

The U.S. Bureau of Labor Statistics recent release showed the U.S. CPI declining at the end of 2014 raising the issue of downward price pressures in the U.S. Not all of this was a reflection of declining energy prices – they have been falling rapidly in the past year – because core inflation, excluding food and energy, has been falling as well. What is going on with world prices and how does it impact the U.S. economy? Since the economy is recovering well as we have documented in previous posts, the pressure on the Federal Reserve to normalize monetary policy and begin raising interest rates should come about largely because of concerns about inflation. But, the current environment is one in which the struggles of some our most important trading partners has incentivized them to push the value of their currencies down, lowering import prices in the U.S. but also stimulating capital inflows to the strong U.S. economy.

First, lets look at prices in a collection of important economies. The picture below shows the broad CPI or equivalent for Japan, the U.S. and some key European economies.

cpi-all-items-foreign-2015-01-21
Prices have turned down, more dramatically in some countries than others, and as the following picture shows it is not just energy prices that is driving them.
cpi-core-foreign-2015-01-21

These price levels reflect a complex set of drivers and ultimately what is going to be most important is the relative price of currencies. The countries that have been most stagnant are the Euro area nations and Japan. (An earlier post also contrasted these areas to the BRICs). The picture below shows the relative performance of these economies in the aftermath of financial crises. Real GDP growth is stagnant in Japan and the Eurozone economies as we have documented before. The U.S. and U.K. in contrast are recovering well and showing steady growth.

gdp-US-EU17-Japan-UK2015-01-21

More important than the price level, however, is the relative price of the currencies. The picture below shows the real effective exchange rates for the Euro, Yen, Pound and Dollar. What they show is that the dollar and pound have appreciated sharply and the Yen has depreciated sharply.  The Euro, adjusted for domestic inflation, has not moved much.  The Euro zone countries need the real value of their exchange rate to decline sharply with the ECB’s policy in order to restore their competitiveness.  But they are hampered in the end by the fact it is one currency that links very disparate economies.  It remains to be seen how effective they are.

real-exchange-rates-2015-01-21

The Labor Market Downturn and the Role of Consumer Credit

by Zach Bethune, Thomas Cooley and Peter Rupert

The labor market added 252,000 jobs in December according to the Employment Situation released today. In addition, there were substantial positive revisions to last two months: 243k to 261k in October and 321k to 353k in November.

empchgm-2015-01-09

The unemployment rate declined to 5.6%, which marks the lowest it has been since mid 2008. While the number of unemployed workers hasn’t fallen to its pre-recession level, the remaining ‘slack’ left in the labor market is largely due to the longer-term unemployed or those with jobs but who are underutilized, like the part-time workers for economic reasons. The story in terms of how (and in which dimensions) the labor market is recovering remains the same: slow but continued progress after a historically deep recession.

emp-rec-rec-2015-01-09

Our usual goal in these posts is to describe where the US is in its now 7-year recovery from the recent recession. However, we ask a different question in this post (one that has been the central focus of many economists since the crisis started): why was the downturn in the labor market so deep?

The Labor Market Downturn

Compared to past recessions, the increase in unemployment during the Great Recession was the worst since the Great Depression. The unemployment rate more than doubled from mid 2007 to late 2009. Even compared to recent recessions, this crisis was particularly severe. What factors led to such a severe recession? In my job market paper, “Consumer Credit, Unemployment, and Aggregate Labor Market Dynamics”,  I study the role of  households’ ability to access and use consumer credit when they become unemployed and ask if this relationship, at the household level, can help us explain the depth of the recent recession.
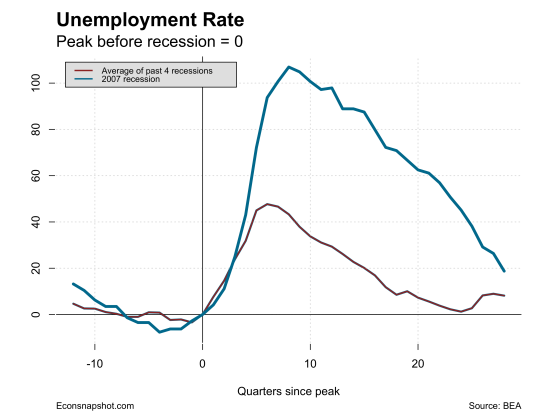
urate-cyc-2015-01-09

The Role of Consumer Credit

The Great Recession was unique in many respects, but a feature that continually stands out has been the response of household debt and borrowing. The credit boom of the late 1990s led many households to increase their reliance on debt to finance consumption and investment. The ratio of debt-to-income increased from around 0.6 in the 1980s to nearly 1.2 at the peak of the boom in 2007. During the crash, both debt and borrowing fell at rates never seen before as the unemployment rate doubled. Debt-to-income currently stands around 0.95.

Not only was the pattern in unemployment and borrowing similar in the aggregate, we also see them linked if we look across regions of the US. For instance, counties that had the largest increase, and subsequent fall, in borrowing during the Great Recession also tended to be the counties that experienced the largest declines in employment or increases in unemployment (see an excellent non-technical summary of this work here). These facts have led to a new emphasis on research into how problems in household financial markets might exacerbate recessions.

One area of household debt that was a strong predictor of the response of unemployment was borrowing on consumer credit lines, mostly comprised of credit cards(Mian and Sufi, 2009). The fall in consumer credit borrowing between 2007 and 2009 was nearly twice as large as in the previous 4 recessions.

cc-borrow-2015-01-09

Not only were households borrowing less, it was also more difficult to access the consumer credit market. Evidence from the Federal Reserve Board’s Senior Loan Officer’s Survey suggests that lenders were tightening credit card standards and also decreasing limits on outstanding accounts. Consumer credit became more difficult to access during the Great Recession at the same time that the labor market was deteriorating.

credit-standards2

This leads to the question of what was happening at the household level between a consumer’s access to credit and their labor market status. Evidence from the 2007-2009 Panel Survey of Consumer Finances suggests that not only was credit being tightened for all consumers over this time period, but that it was being tightened more strongly for consumers that lost their jobs. These households applied for credit more frequently and were denied at a higher rate. The difference in the rate of denials was driven by denials that were employment and income related, being told by lenders that their income was too low. In the end, the rate of monthly borrowing fell 60% more for an average consumer that lost their job than an average consumer that maintained employment. Put simply, a job loss over the Great Recession corresponded to a significant reduction in a household’s ability to borrow on consumer credit.

Accounting for this relationship in a macroeconomic model leads to recessions that are around 70% deeper than what a standard model would predict. A shock to the economy, say a fall in productivity or house prices, gets amplified if the unemployed face tighter credit constraints. As the unemployment rate increases, a higher fraction of households are credit constrained, borrowing falls, and subsequently the demand for firms’ products. The decrease in ‘aggregate demand’ lowers firms’ demand for labor which induces more unemployment. This cycle repeats itself, causing the recession to become deeper.

Conclusions

The evidence above highlights two aspects of why the fall in household borrowing between 2007 and 2009 corresponded closely with the increase in unemployment. First, the complementarities between the household credit market and the labor market run down to the household level. It became more difficult to borrow precisely for households that demanded it the most, the unemployed. Second, this relationship affected the incentives for firms to hire, which exacerbated the initial causes of the recession.  Accounting for the relationship between borrowing and unemployment at the household level is important in understanding the trends we see aggregate data.


Sources

Bethune, Zachary (2014), “Consumer Credit, Unemployment, and Aggregate Labor Market Dynamics” in mimeo. 

Mian, Atif and Amir Sufi (2010), “Household Leverage and the Recession of 2007 to 2009” IMF Economic Review, Palgrave Macmillan, vol. 58(1), pages 74-117, August.

Q3 GDP Final Estimate: Christmas Came in The Third Quarter

by Zach Bethune, Thomas Cooley and Peter Rupert

GDP Report

The BEA announced in the 3rd estimate that real GDP increased at a s.a.a.r. of 5.0% for 2014 Q3. This was the strongest quarterly growth rate in over a decade.  It seems clear that the U.S. recovery is continuing apace and, if the economy is not held back by weak growth in Europe and the BRICS, we should continue to improve. A favorable sign is that personal consumption expenditures (PCE) contributed about half of the total, split pretty evenly between goods and services. Durable goods expenditures continued to be strong, increasing 9.2% after a 14.1% increase in the 2nd quarter.


gdprealchgm-2014-12-24


pcerealchgm-2014-12-23

How confident should we be that this expansion has legs?

Five percent growth is a healthy number and a good excuse for an extra glass of holiday cheer. It still makes sense, however, to view this recovery in the context of other business cycles. When we do, it is apparent that this economy is still climbing out of what was a very deep hole and very tepid recovery to date. The pictures below show the path of GDP, Consumption and Investment, in this recovery contrasted with the paths of other post-war business cycles. This makes it clear that, while things are looking better, we might want to keep the good champagne corked for a while longer. The fact that this recovery is set against the background of a world economy that is very feeble is a cause for tempering the optimism.
gdp-cyc-2014-12-24
pce-cyc-2014-12-24
inv-cyc-2014-12-24
gdpconinv-2014-12-25

Another positive sign for the holiday is the report from the BLS today that, once again, initial claims for unemployment has declined. The 4-week moving average has been trending down and now is as low as at any time over the last several decades.

claims4w-2014-12-24

The Context

The picture below reprises a theme from our previous post.  The U.S. recovery looks great when contrasted with Japan and Europe. The question is can we continue to sustain this progress when they are struggling? Economic linkages wax and wane as the terms of trade change between nations. Falling commodity prices have strengthened the U.S. dollar. Some trading partners have pushed down the value of their currencies. These contribute to keeping inflation low and this in turn helps domestic consumption. Most signs point to the recovery continuing to be robust but there are many moving parts to this picture and we will have to continue to watch them all.
 

gdp-US-EU17-Japan-2014-12-23

November Employment Crushes Estimates

by: Zach Bethune, Thomas Cooley, Peter Rupert

The Employment Situation released Friday by the Bureau of Labor Statistics reported that payroll employment increased 321,000 in November, beating the “best guesses” by roughly 100,000 jobs! This represents the largest gain since May, 2010. Moreover, the number of jobs have been revised up for the previous two months: 23,000 more in September and 29,000 more in October. Indeed, revisions to employment have been positive for almost all of the last year!

empchgm-2014-12-05

According to the household survey the unemployment rate was unchanged at 5.8%; however, the unemployment rate actually rose from 5.67% to 5.82% as there were only 4,000 more employed according to the household survey while the labor force expanded by 119,000. The employment to population ratio was unchanged at 59.2 and the labor force participation rate was also unchanged, remaining at 62.8. The number of persons working part time for economic reasons (PTER) fell by 177,000 and most of that decline (150,000) came from a reduction in those reporting slack work or business conditions. However, while the latest report is the strongest in some time, the transition rates we calculate from CPS microdata illustrate that these part-time workers are still having trouble finding full-time work. There are still 6.9 million PTER workers that would like to be working full-time; nearly two million more than there where pre-Great Recession. Given that the transition rates slow little signs of improvement, we expect the number of PTER workers to decline slowly.

uu6rate-2014-12-05

epr-2014-12-05

lfp-2014-12-05

parttimefrac-2014-12-05

pter-2014-12-05 rate-pter-fter-2014-12-05 rate-pter-unmp-2014-12-05

Further evidence that the labor market is strengthening is that average hours of work increased as did average hourly earnings.

avghours-2014-12-05

ahe-2014-12-06

The stronger labor force was a reflection of the stronger economy overall that we discussed in our last report.  The fall in people working part time for economic reasons is another sign that constraints are easing. The strength of the report adds strength to the argument for the Fed to begin increasing rates sooner rather than later.

Q3 GDP Gets a Lift and Invites a Global Perspective on the U.S. Economy.

by Zach Bethune, Thomas Cooley and Peter Rupert

GDP Report

The BEA announced the second estimate for real GDP this morning, boosting Q3 growth to 3.9% from 3.5% announced in the advance estimate. The increase came largely from boosts in  business investment and consumption. The equipment component of business fixed investment increased 10.7%. Residential structures showed only a 2.7% rise while the Case-Shiller and FHFA home price indices were essentially flat.

The contribution of investment to GDP growth was less than a third of the contribution in the second quarter while the contribution of Exports, while still positive, was less than a half of what it was.  The GDP numbers suggest that the U.S. economy is strong and resilient although there are reasons for concern. Chief among these concerns is that major trading partners of the U.S. are struggling – some of them mightily.  In this post we look at the U.S.in relation to other major trading partners and the powerful emerging economies. Our comparisons are somewhat hampered by the reliability and availability of data (see our rant on europeansnapshot) but we show what we can.

gdprealchgm-2014-11-25
The U.S. in Perspective

North America

The first thing to note is that North American Economy as a whole is recovering well. The U.S., Canada and Mexico are all expanding in the seven years since the financial crisis of 2007-2009 brought many of the worlds economies to their knees. The picture below shows the trajectory of the North American economies since the financial crisis.  This is important because Canada is the top U.S. trading partner and Mexico ranks third behind China. If these economies were faltering that would hold back the U.S. but they are not.


gdp-US-CAN-MEX-2014-11-26


Europe and Japan

Outside of North America the other most important trade relationship is with Europe. Taken as a whole the EU accounts for 17% of world GDP, slightly more than the U.S. Europe – U.S. trade accounts for 40% of world trade in services and 30% of world trade in goods. Japan accounts for about 5% of world GDP and is the fourth largest trading partner.  The picture below shows that Europe and Japan are both stagnant.  The European debt crisis is in the past but the crisis revealed many weaknesses in the design and execution of European integration that has resulted in what we called Europe’s Lost Decade on our companion blog. Japan has experienced two quarters of recession as Mr. Abe’s “three arrows” policy has seemingly backfired.  Although the U.S. looks strong by comparison to these major trading partners their weakness constitutes a major headwind for the U.S. economy.  If they are not well it is harder for us to do well.

gdp-US-EU-Japan-2014-11-26


GDP slowing in BRICS

Much of the momentum in the world economy for the past decade has been contributed by the fast growing emerging market economies referred to as the BRICS – Brazil, Russia, India, China and South Africa. Data limitations are a major limitation in looking at these economies but the pictures below give a sense of the recent pattern. Brazil has slipped into recession as has Russia. Partial data suggests that Chinese growth is slowing. The BRICS excluding China seem to be slowing somewhat, growing more at the pace of the U.S. than at their historical pace.

gdp-US-BRICS-2014-11-26

gdp-US-EU17-Japan-BRICS-2014-11-26

gdp-US-EU17-Japan-BRICS-no-china-2014-11-26

The Engine of World Growth? 
However disappointing we may find the pace of this recovery, The U.S. and North American economies look decidedly stronger than those of our other major trading partners. Without more widespread recovery U.S. growth will be held back. But Japan and Europe suffer from structural problems – unfavorable demographics and inefficient labor markets that are not easily fixed. It may be that we should be giving thanks for our blessings.