A Few More Workers…
The BLS Employment Situation report for August indicates a 169,000 increase in total non-farm employment. The gain in August was in line with expectations (which weren’t very strong to begin with), but the report also included large downward revisions to June and July (-74K in total). This lackluster report essentially means that the FOMC will likely keep its head down for a while longer.

The employment gains in August mostly came from the Trade, Transportation, and Utilities (+65K) and Education and Health (+43K) sectors. The chart below shows the change in employment by industry with the width of each bar representing the share of that industry’s employment out of total employment.

…But Fewer Participants…
The household survey also reveals a drop in the labor force participation rate from 63.4 to 63.2. The unemployment rate was essentially unchanged at 7.3%.

The participation rate continued its decline, falling to a level not seen since August 1978. This decline raises an interesting question about the Fed’s “forward guidance.” It has been reported over and over that the Fed will keep its accommodative stance until the unemployment rate reaches 6.5%, the “threshold.” However, as many have mentioned this threshold is not a “trigger.” So, suppose the labor force participation rate declines by 1 percentage point, from 63.2 (green line in the chart) to say 62.2 (the orange line). According to the Federal Reserve Bank of Atlanta’s Jobs Calculator given that participation rate, how many jobs need to be created per month to get to a 6.5% unemployment rate one year from now? The answer is….the economy would have to create approximately ZERO jobs per month!! And if it fell to 62.0% would even have to LOSE jobs! Surely, no one would argue that the labor market has improved enough to begin the taper! While forward guidance may indeed have been somewhat instructive, it appears that it is providing very little, if any, information for the future stance of policy, other than: if things are “bad” we will continue our accommodative stance, if they are “good”, we won’t. Choosing simple thresholds, targets, triggers, to make things more transparent may help to provide a framework, but the markets want to respond to the vast and myriad details….like a poor jobs report, etc.
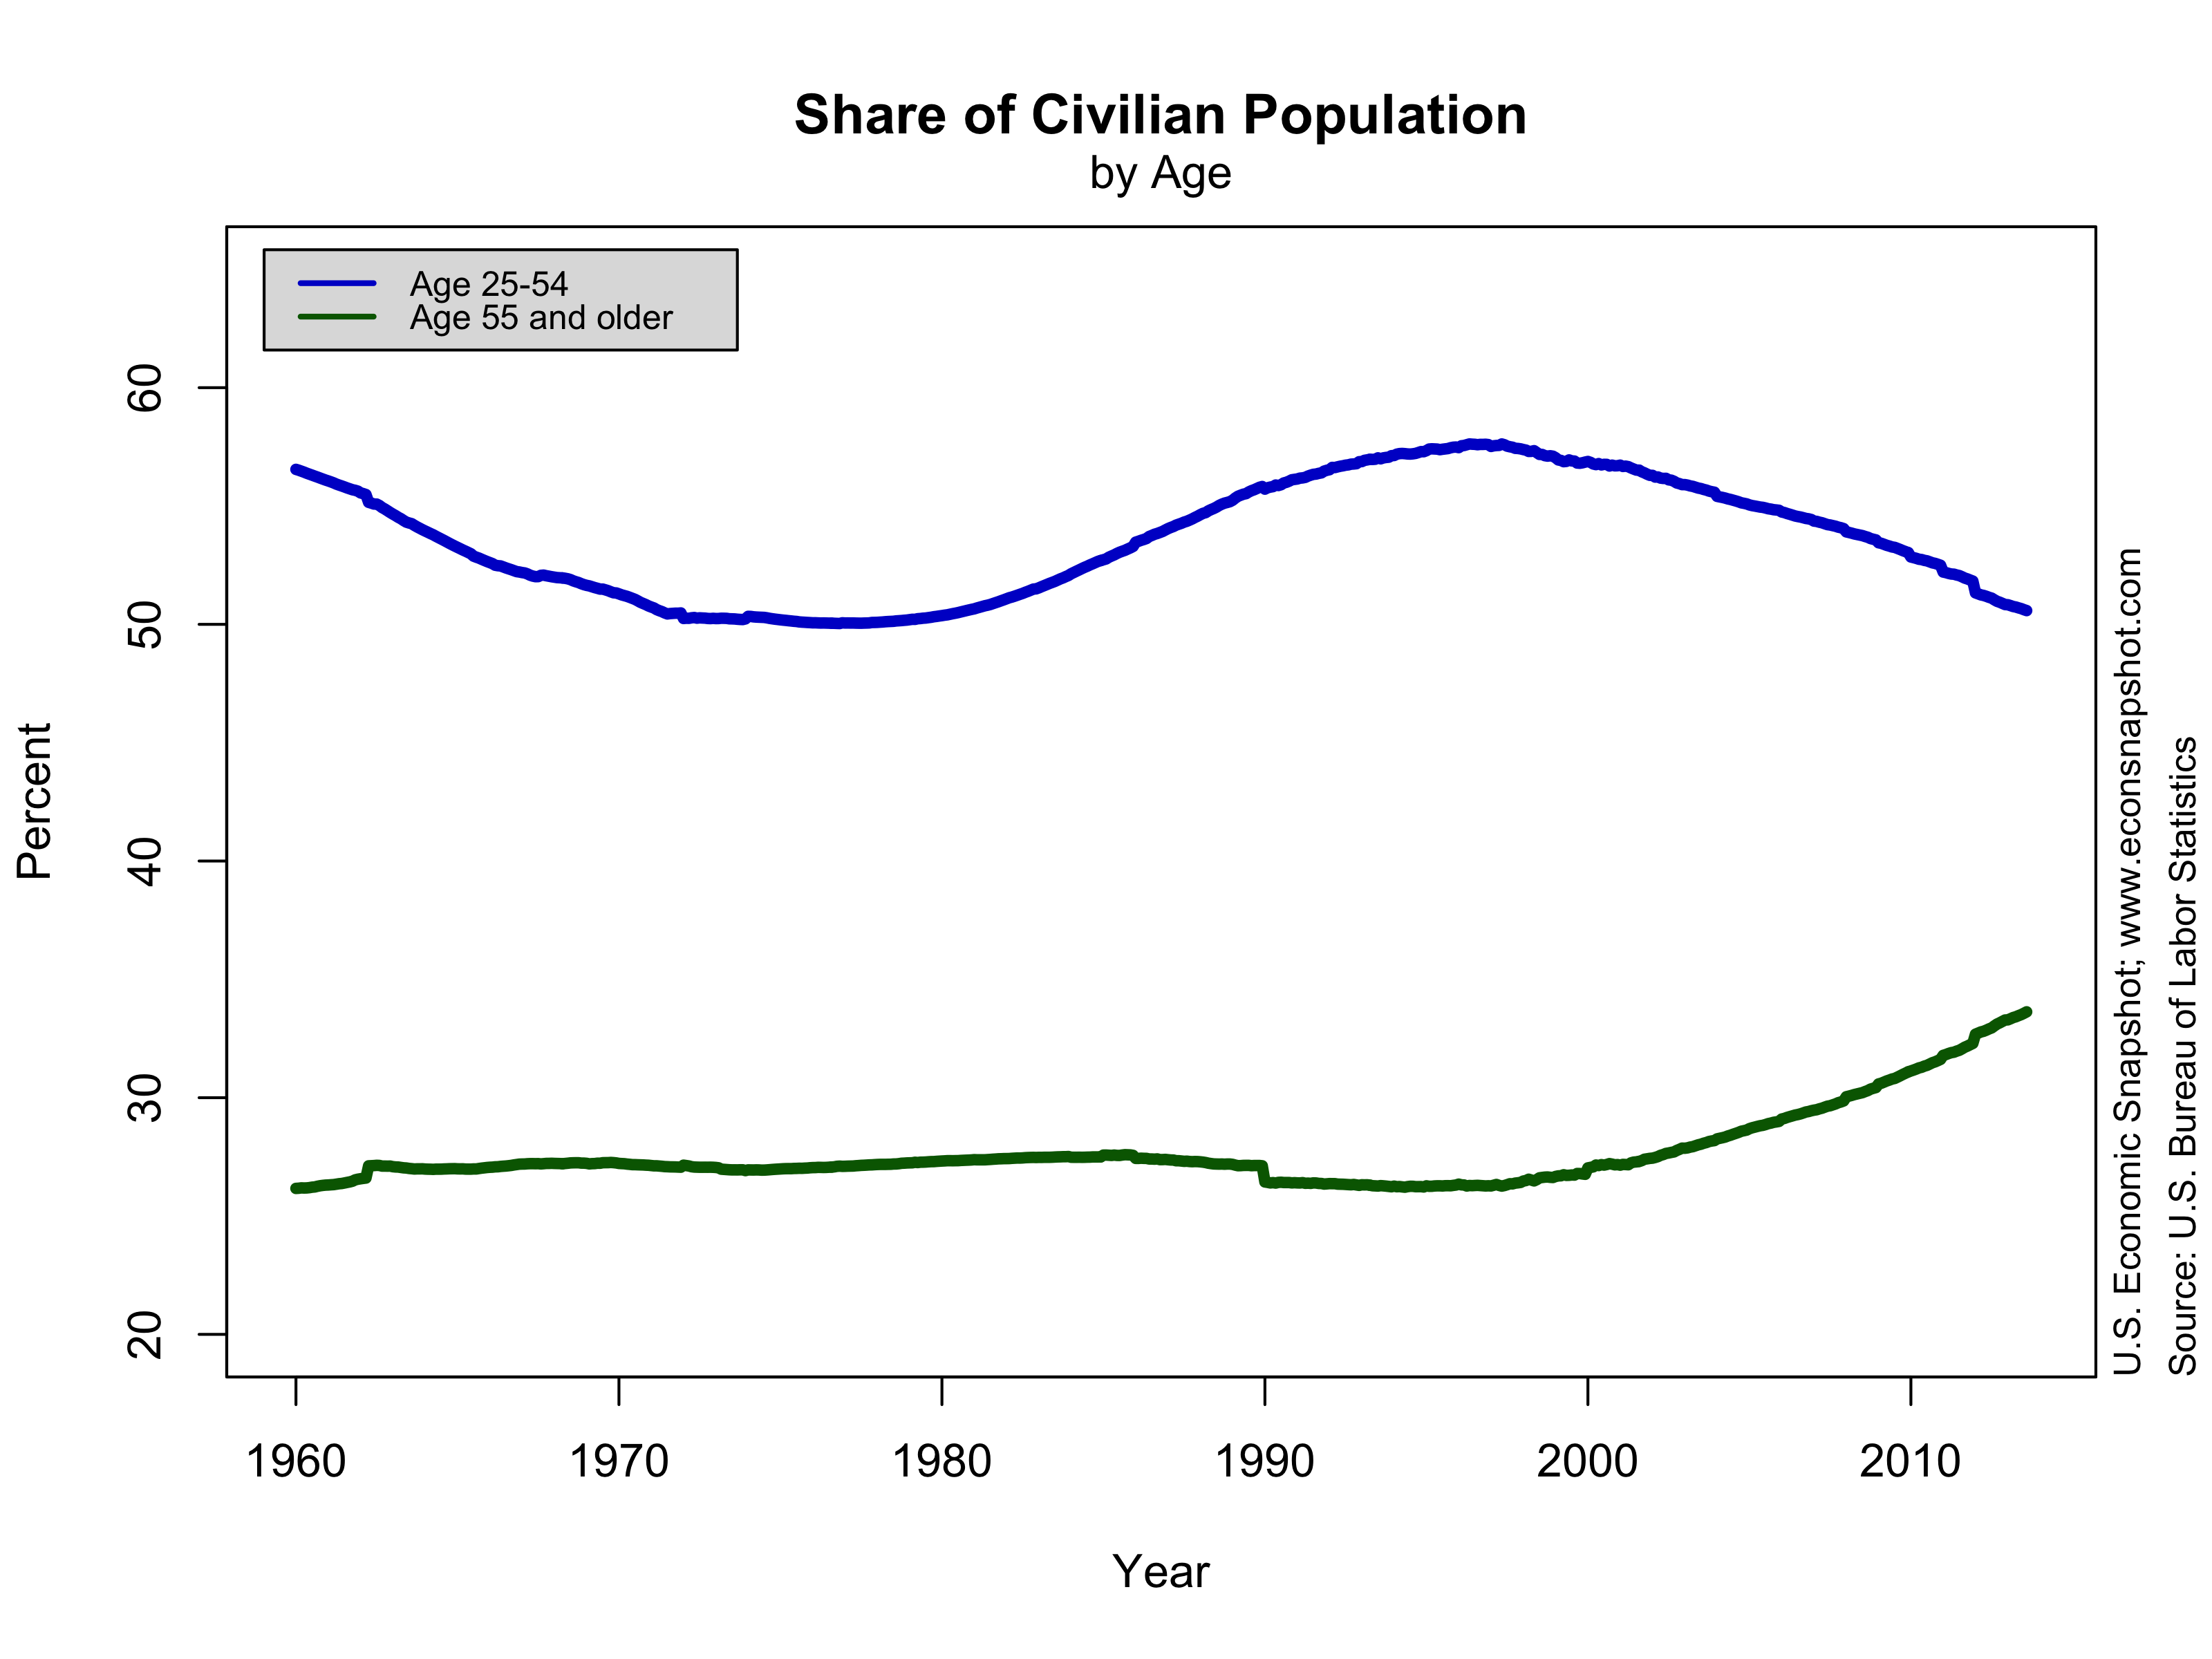
A portion of the decline in participation since 2008 (note, however, that participation started to decline in the late 1990’s/early 2000’s) is likely a result of discouraged workers leaving the labor force, but there are also demographic factors that decrease participation. For instance, changes in the age distribution have had an effect the overall participation rate. As a share of the civilian population, the share of people over the age of 55 has increased. Since these workers naturally have a lower participation rate, this reduces the participation rate in the aggregate, albeit the participation of those over 55 has actually increased.

It’s important to know exactly why participation has fallen, particularly because of its implications on the unemployment rate, which the Fed seems to be using as its sole measure of labor market health in its forward guidance, as San Francisco Fed President John Williams pointed out this past week [the emphasis is ours]:
“Clearly, the unemployment rate plays an important role in our thinking and communication about future policy. Therefore, an important issue is whether it is giving an accurate read on where things stand relative to our maximum employment mandate. […]
Over the past few years, labor force participation has plunged below 64 percent, a level not seen in almost 30 years. This drop in labor force participation explains how the unemployment rate can be falling while the employment-to-population ratio has been roughly stagnant. The overall ranks of the unemployed have been declining because many people are leaving the labor force, rather than finding jobs. But, it’s important to remember that much of this decline in labor force participation reflects demographic trends, such as retiring baby boomers leaving the workforce. In addition, in recent years, there has been a big exodus of young people and so-called prime-age adults. Again, some of this is related to ongoing trends, such as an increasing share of young adults enrolling in school, and workers moving onto disability rolls.
Nonetheless, a portion of the exodus from the labor market is due to the recession and slow recovery. It appears that unprecedented numbers of young and prime-age workers have been bailing out of the labor force because the job market has looked dismal. Many of these prime-age workers who have left the labor force say they want jobs and are available to work. But they don’t think they can find work, so they’ve given up looking and therefore they’re not counted as unemployed. Many of these people will probably return to the job market as conditions improve.
All this gets quite complex. On the one hand, we have structural trends, like the aging of the workforce and young people spending more time in school. On the other hand, we have the effects of a weak economy, that discourages people from looking for work. From the standpoint of gauging the state of the labor market for monetary policy, it is crucial that we distinguish between structural developments in the labor market and the effects of a weak economy.
The idea behind that last point is that monetary stimulus is meant to address the latter issue (a weak economy) and cannot influence ‘structural’ things such as demographic changes. That’s certainly true in some sense. No amount of stimulus can slow down the aging of the workforce. But, that’s not to say that some of the policy actions the Fed has taken alters the way structural changes influence the labor market.