by: Zach Bethune, Thomas Cooley, Peter Rupert
The past week has seen upward revisions to the initial estimate of Q2 GDP: from 4.0% growth to 4.2% growth in the second estimate to 4.6% growth for the final estimate, following a negative growth rate in Q1. That report was followed today by the September Jobs report that showed an addition to total non-farm payroll employment of 248,0000. These are all positive signs. The key question is whether they show enough improvement in the labor market to stiffen the resolve of the Fed to ease its foot off the accelerator.
LABOR MARKETS
The Establishment Survey from the BLS released on October 3 indicates that Total Nonfarm Employment increased 248,000 in September, slightly beating expectations that ranged from 200k to 220k. Private employment increased 236,000 and 207,000 of that was in service producing jobs. In addition, July employment was revised up by 31,000 and August up 38,000.
The Fed has indicated that there is still slack in the labor market, evidently the sentiment reflects part-time workers. In Yellen’s speech at Jackson Hole on August 22, the word “slack” was used about 22 times and “part-time” 7 times. Indeed, those working part-time for economic reasons has fallen to its lowest level, (6.99 million) since November, 2008, roughly a 25% decline since the peak when nearly 9.2 million workers were employed part-time for economic reasons.
However, the rate at which those workers are exiting into full time employment hasn’t shown any signs of recovery. In normal times that rate is around 0.45. Since the recession is has fallen and has stayed around 0.37.

The employment to population ratio seems stuck at 59%…the third straight report with that reading.
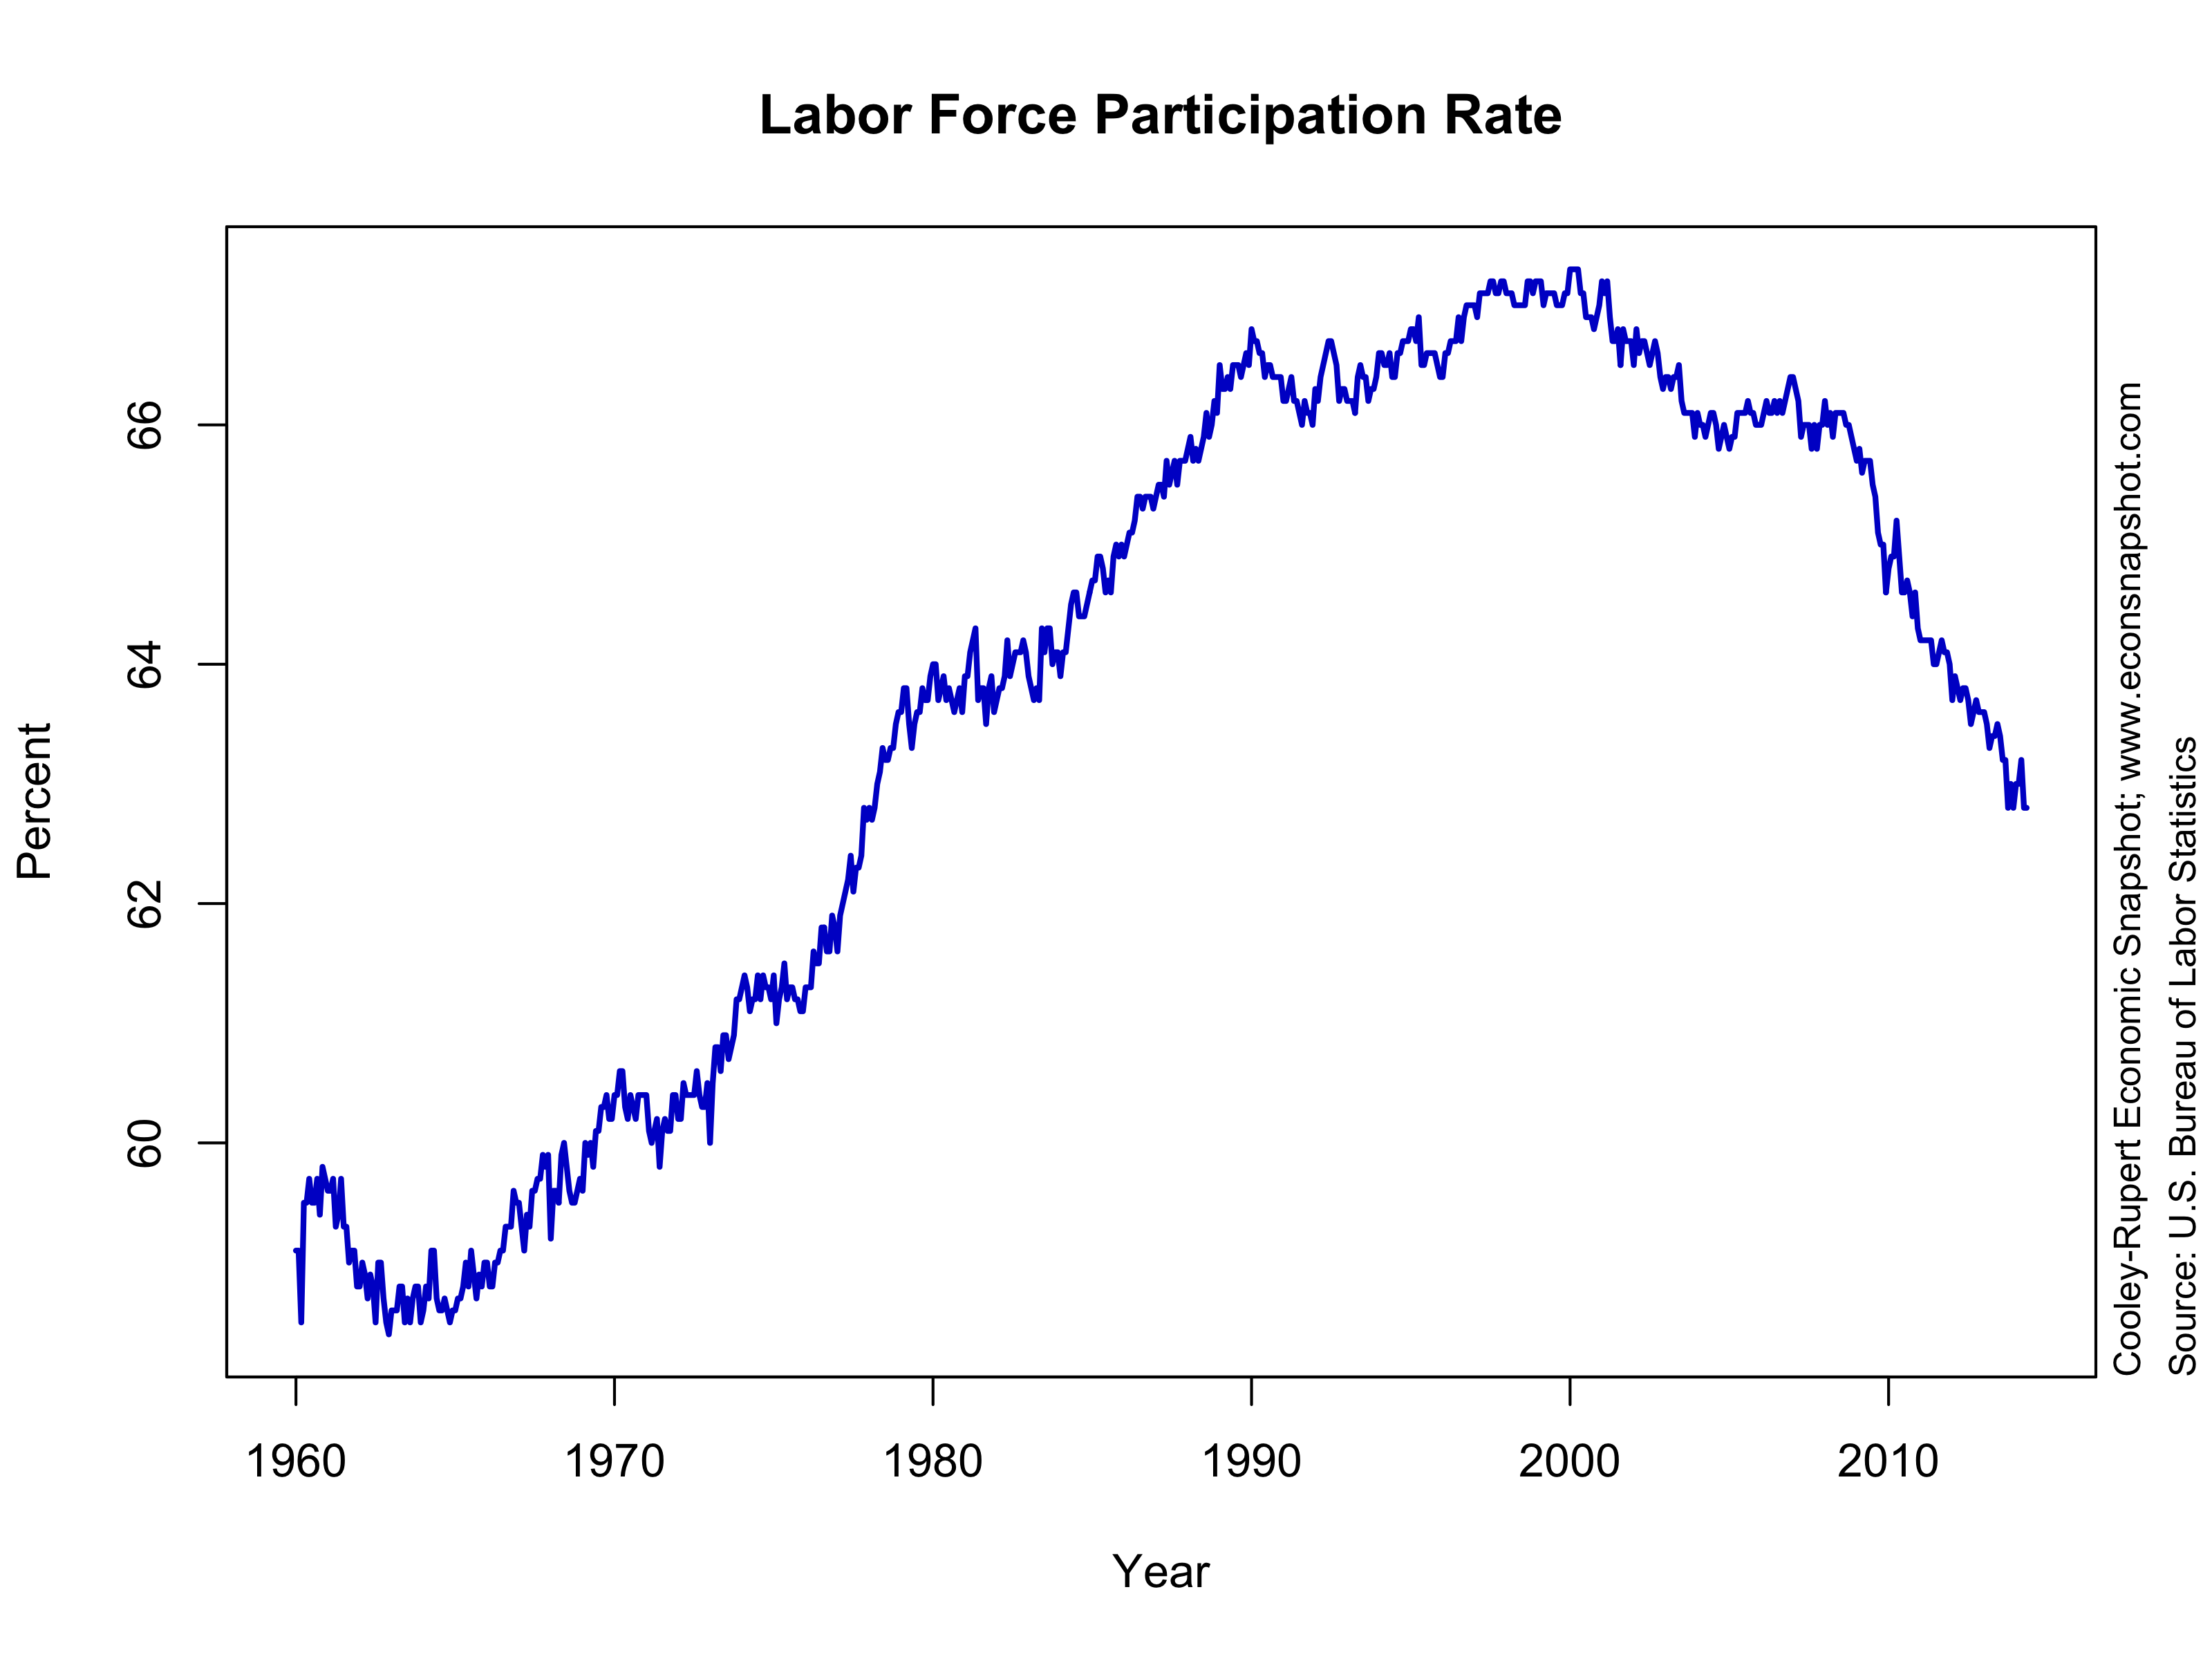
The size of the labor force shrank slightly, down 97,000. Combined with the employment increase, the unemployment rate nudged down to 5.9%. This is the first time below 6% since 2008 but it is partly due to the further drop in labor force participation.
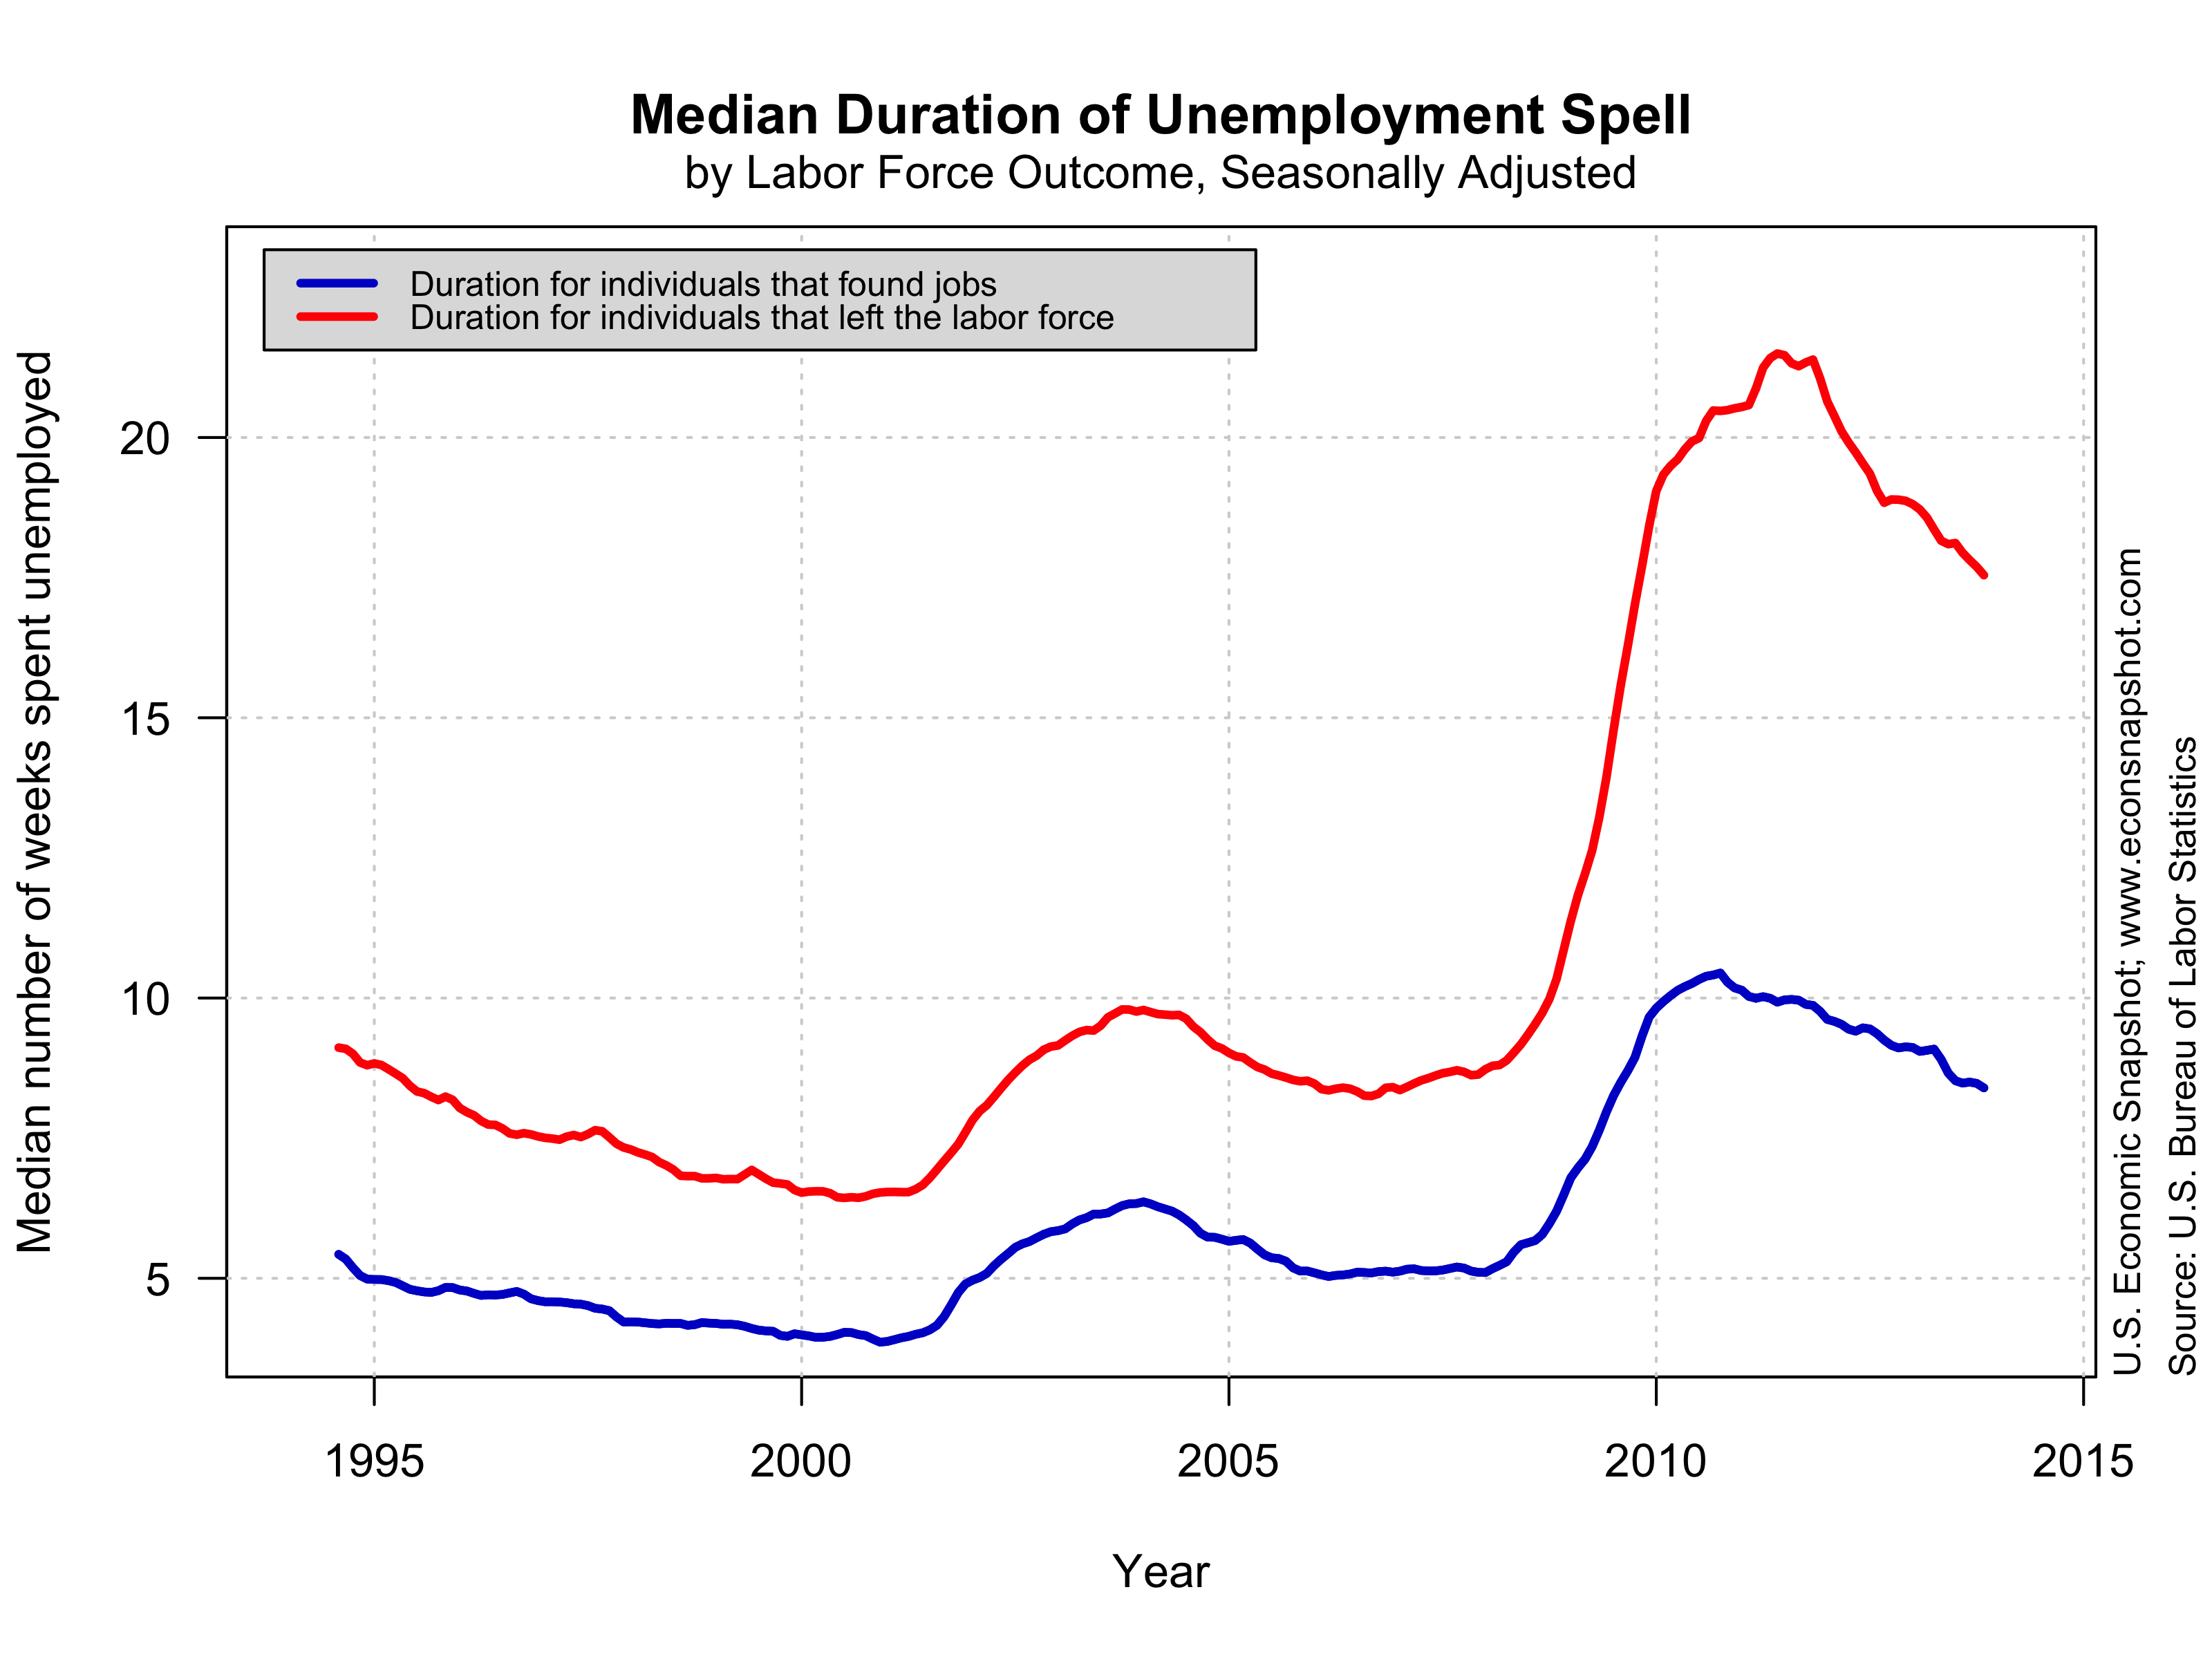
 While a 5.9% unemployment is much closer to normal, the average time spent in unemployment remains elevated. Notice, the median unemployment duration more closely tracks the unemployment rate than the mean. This tells us that there remains a substantial pool of long-term unemployed.
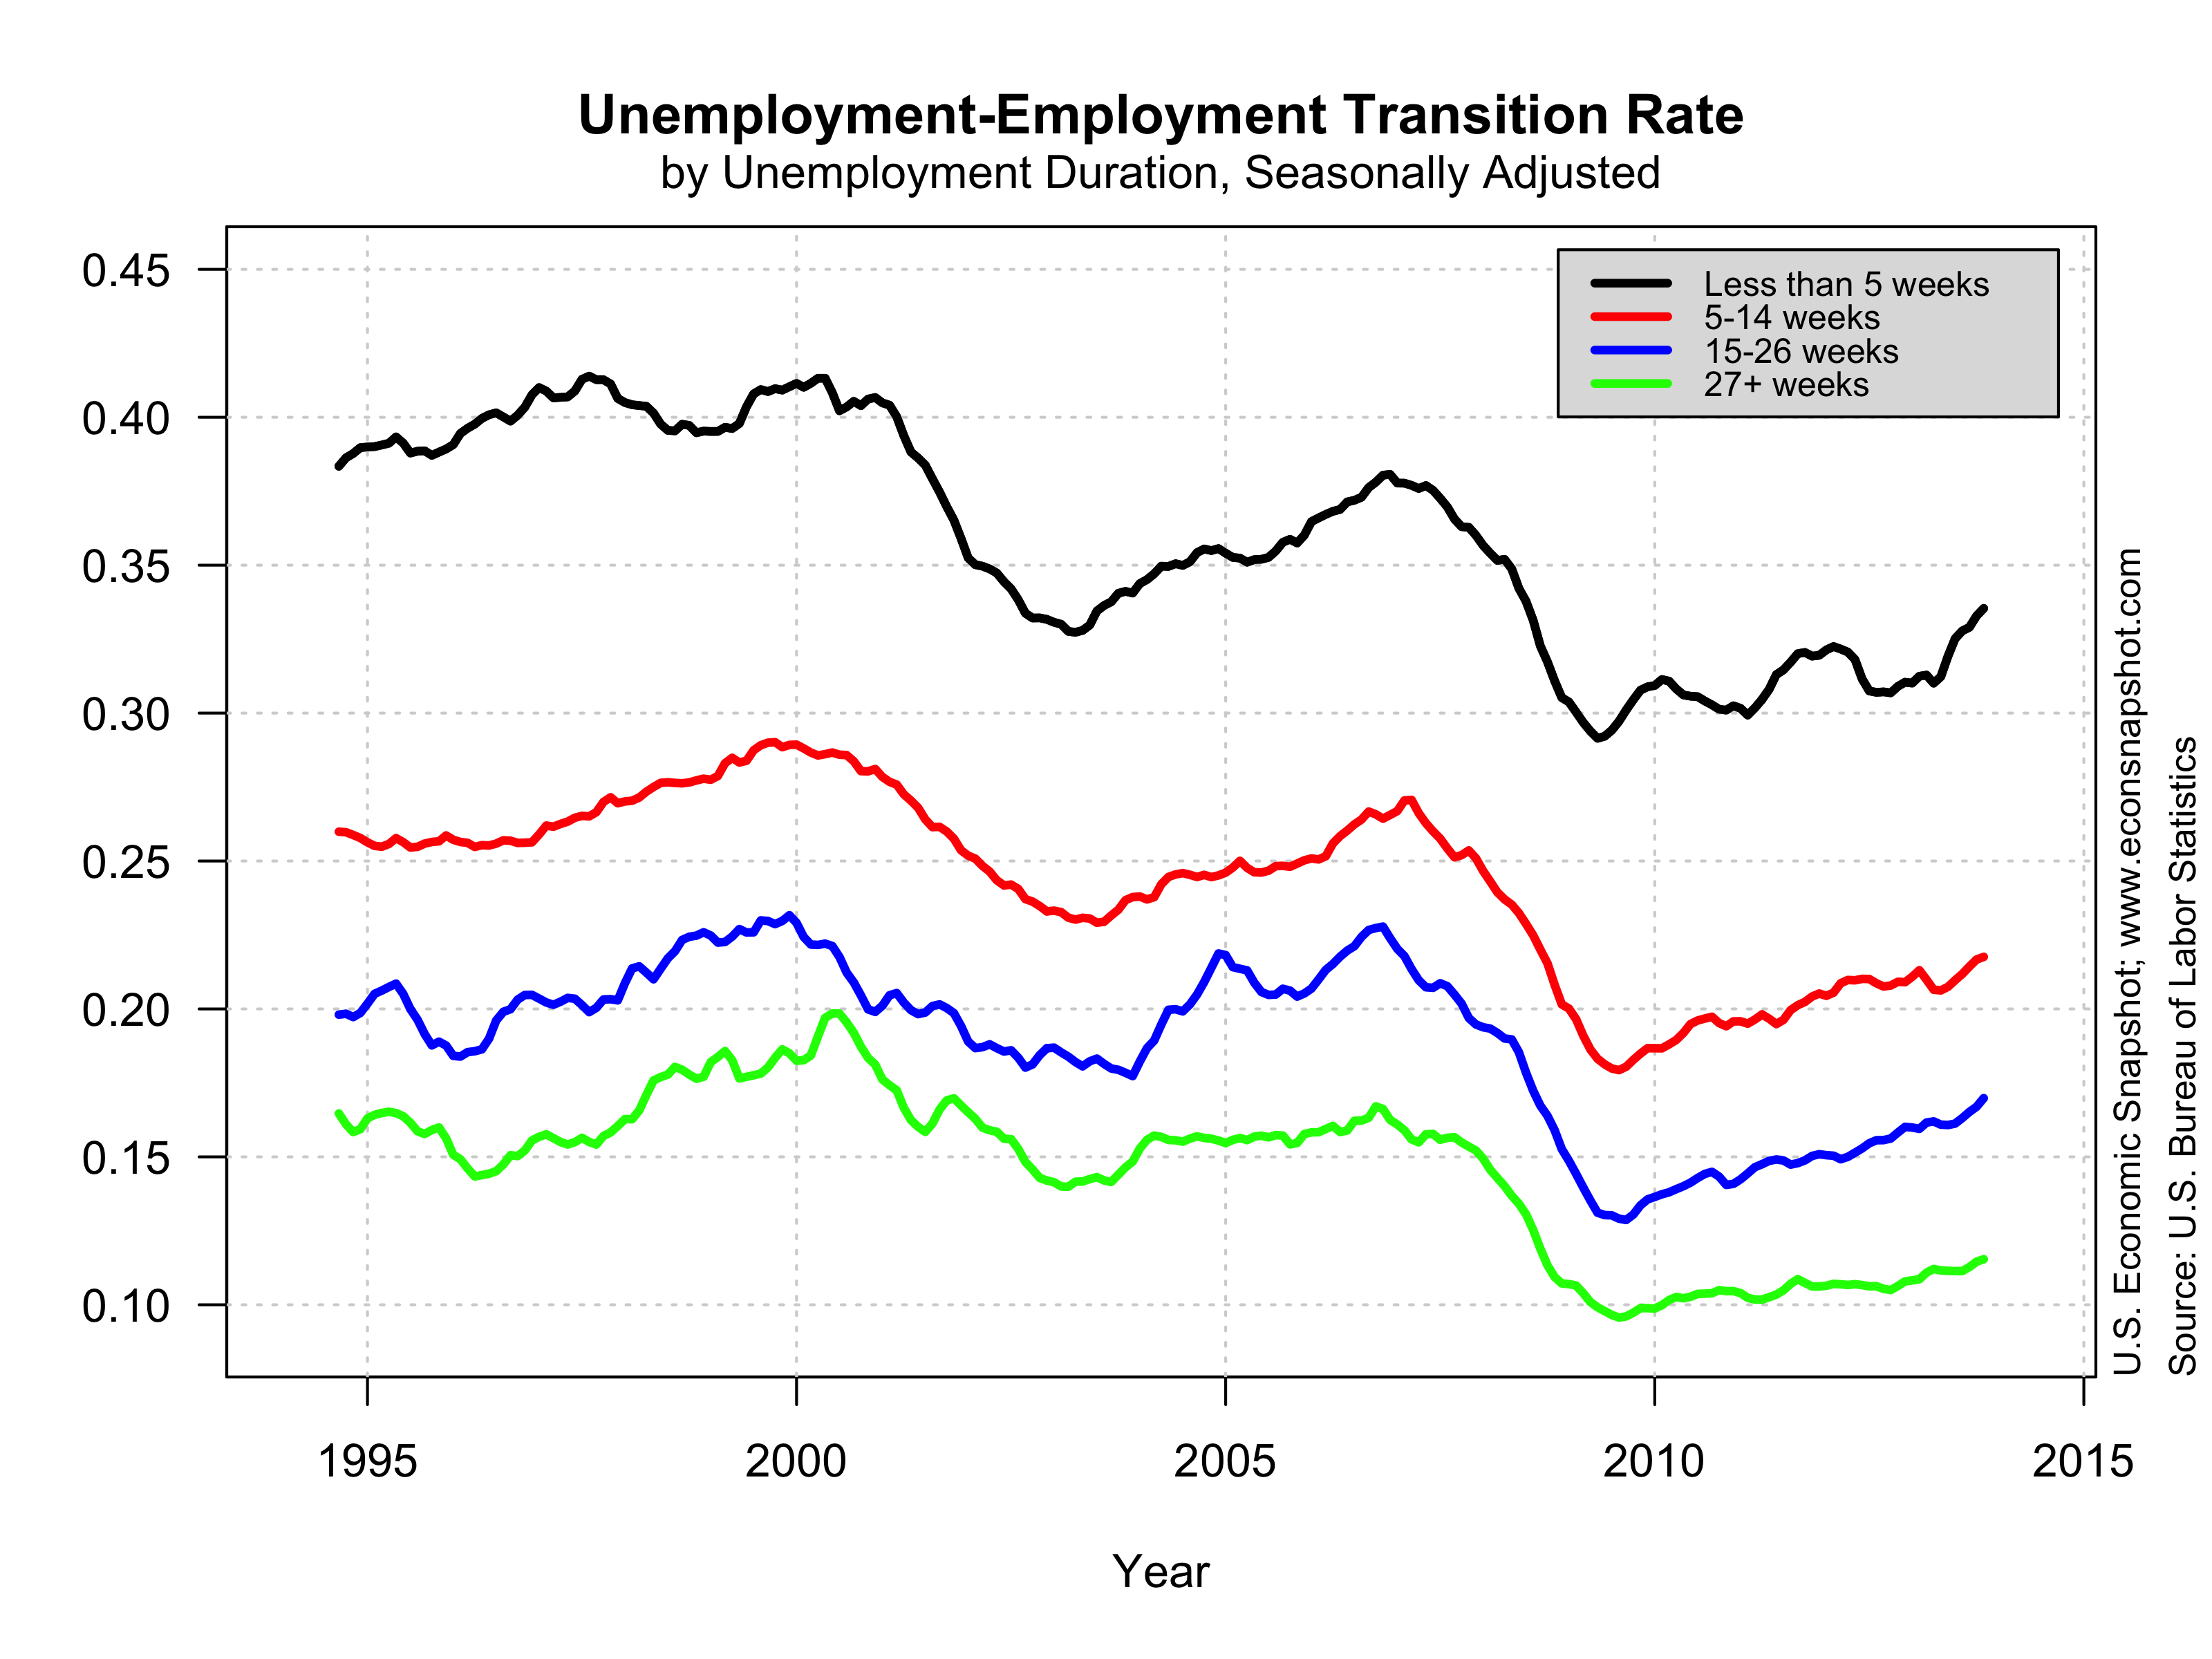
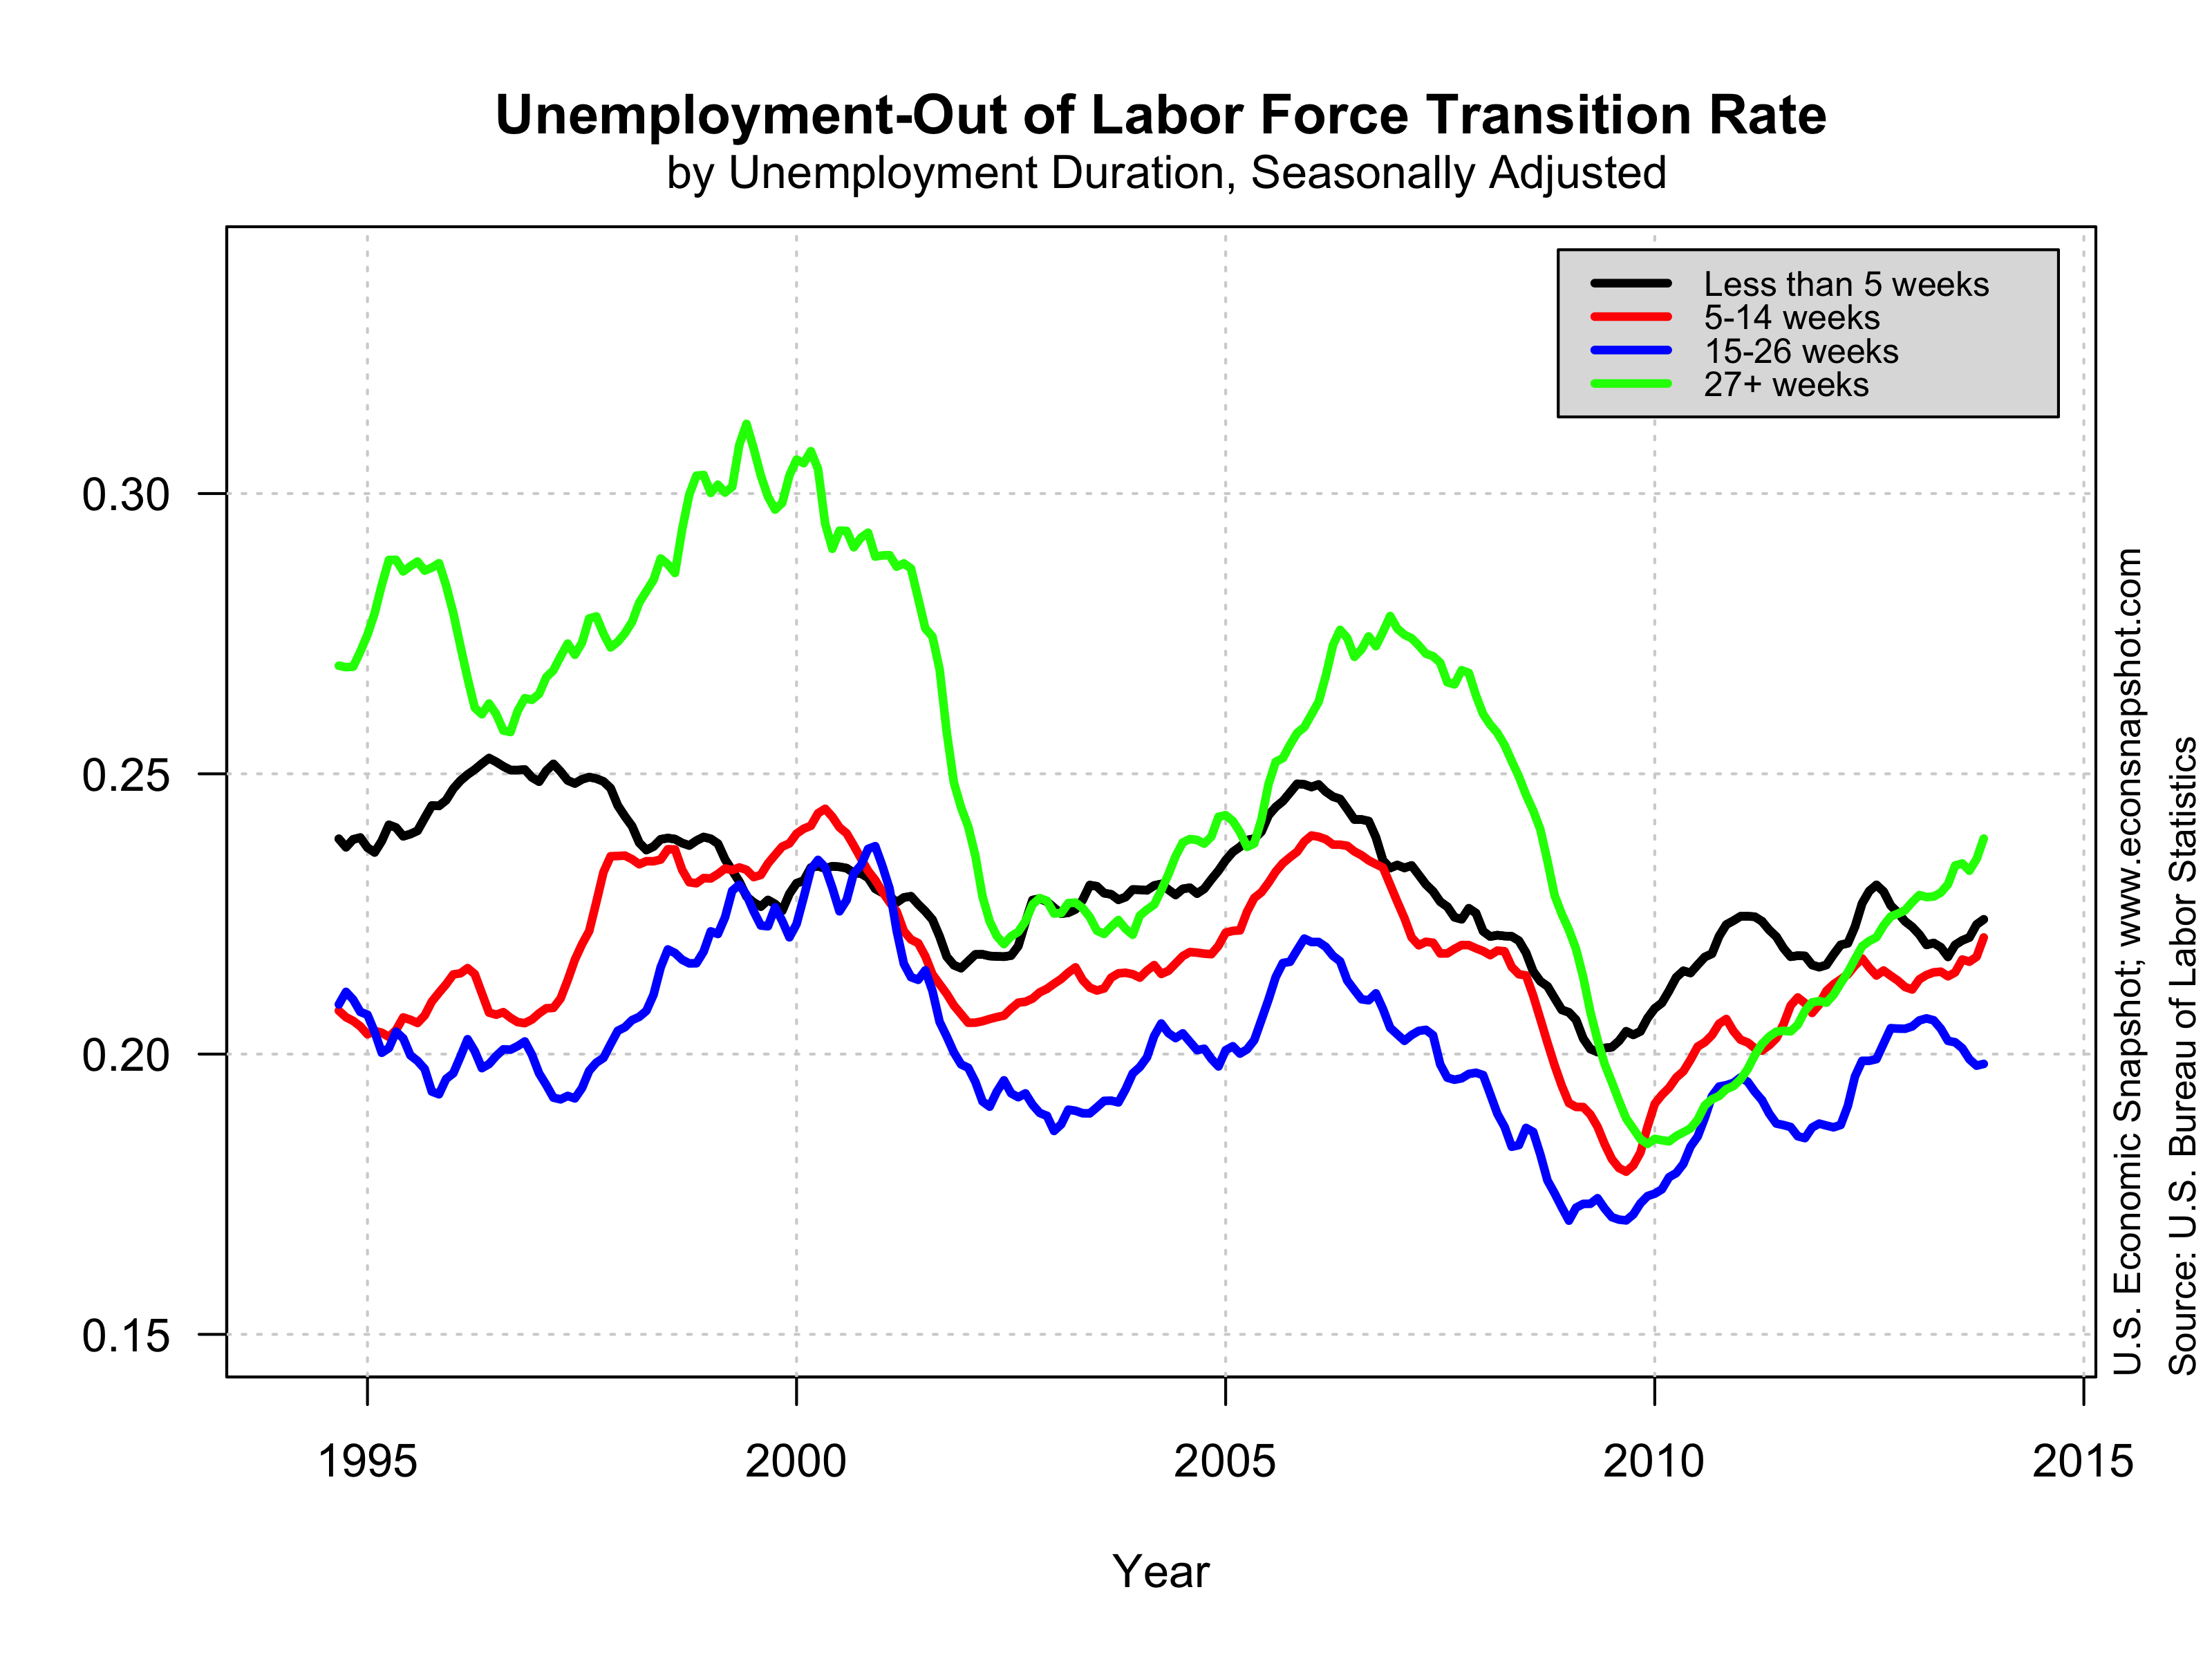
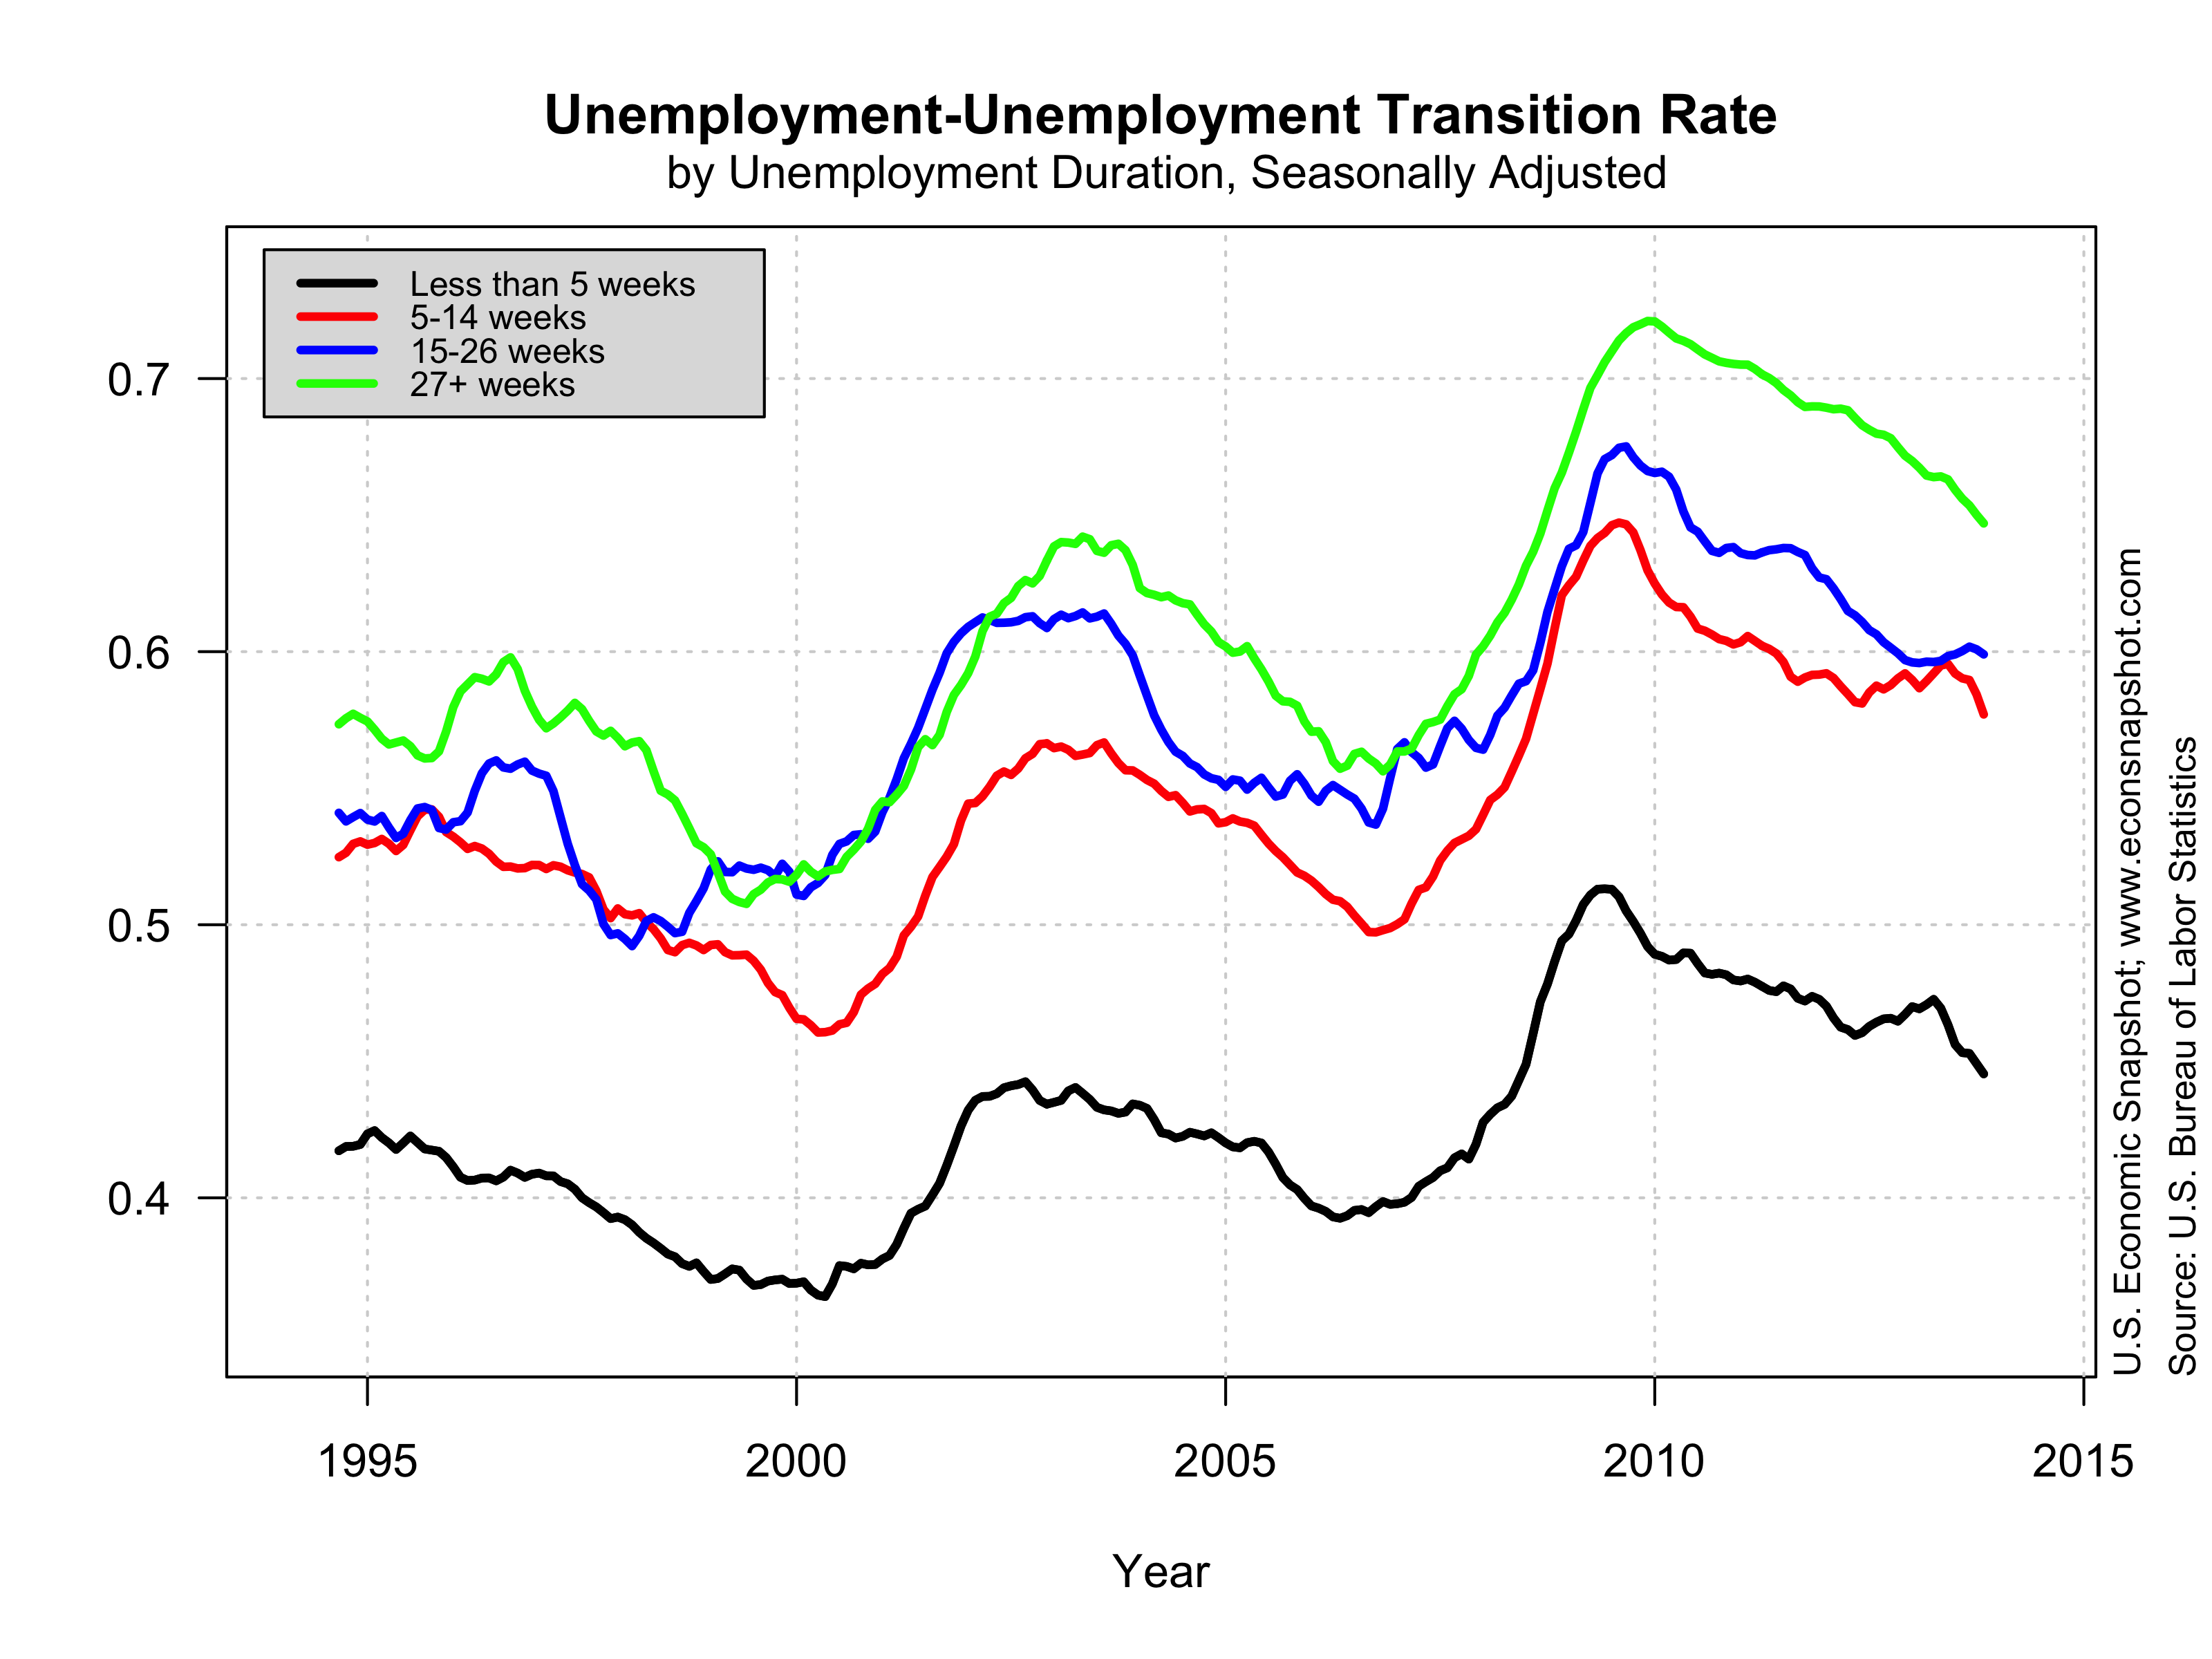
To get a better picture, we can look at the rate at which unemployed workers find jobs, broken down by the time they have spent in unemployment in the figure below. The job finding rate for workers with more than 27 weeks of unemployment (green line) has shown very slow improvement. It remains 20% below its level in December 2007. For comparison, the job finding rate for ‘short-term’ unemployed workers, or those less than 5 weeks, is only about 1.3% below its level in December 2007.
 The evidence above, combined with the fact that we still don’t see any significant upward pressure on wages, is a clear indication that the labor market still isn’t fully recovered. The prospects for workers that have been unemployed for more than 27 weeks or for workers that took part-time jobs in the absence of finding full time employment remain dim.
GDP
The final estimate for Q2 real GDP revealed an upward revision to 4.6% compared to the 2nd estimate of 4.2% and initial estimate of 4.0%. Real GDP for Q1 fell 2.1%.
While the bounce in the revision is certainly welcome, the recovery still looks much different from those in the past, as can be seen below. Current values of real GDP are substantially below the longer-run linear trend…and not showing any convergence.
Personal consumption expenditures continue at a sluggish pace, increasing 2.5%, that is, contributing 1.75 percentage points to the 4.6% increase.
However, there was overall strength in the report. Real Gross Private Domestic Investment was up 19.1% from the previous quarter and is nearing the highest recorded level in 2006:Q1.
Implications
The latest two reports signal continued growth with substantial strengthening. Such continued strength might push some policy makers to rethink the timing of “liftoff” for the Fed Funds Rate. While many have indicated something like mid-2015, another strong showing like we had this week could alter that thinking. But the strengthening of the dollar and the decline in import prices decrease concerns about price pressures and mitigate against a change in stance.


