By Thomas Cooley, Ben Griffy and Peter Rupert
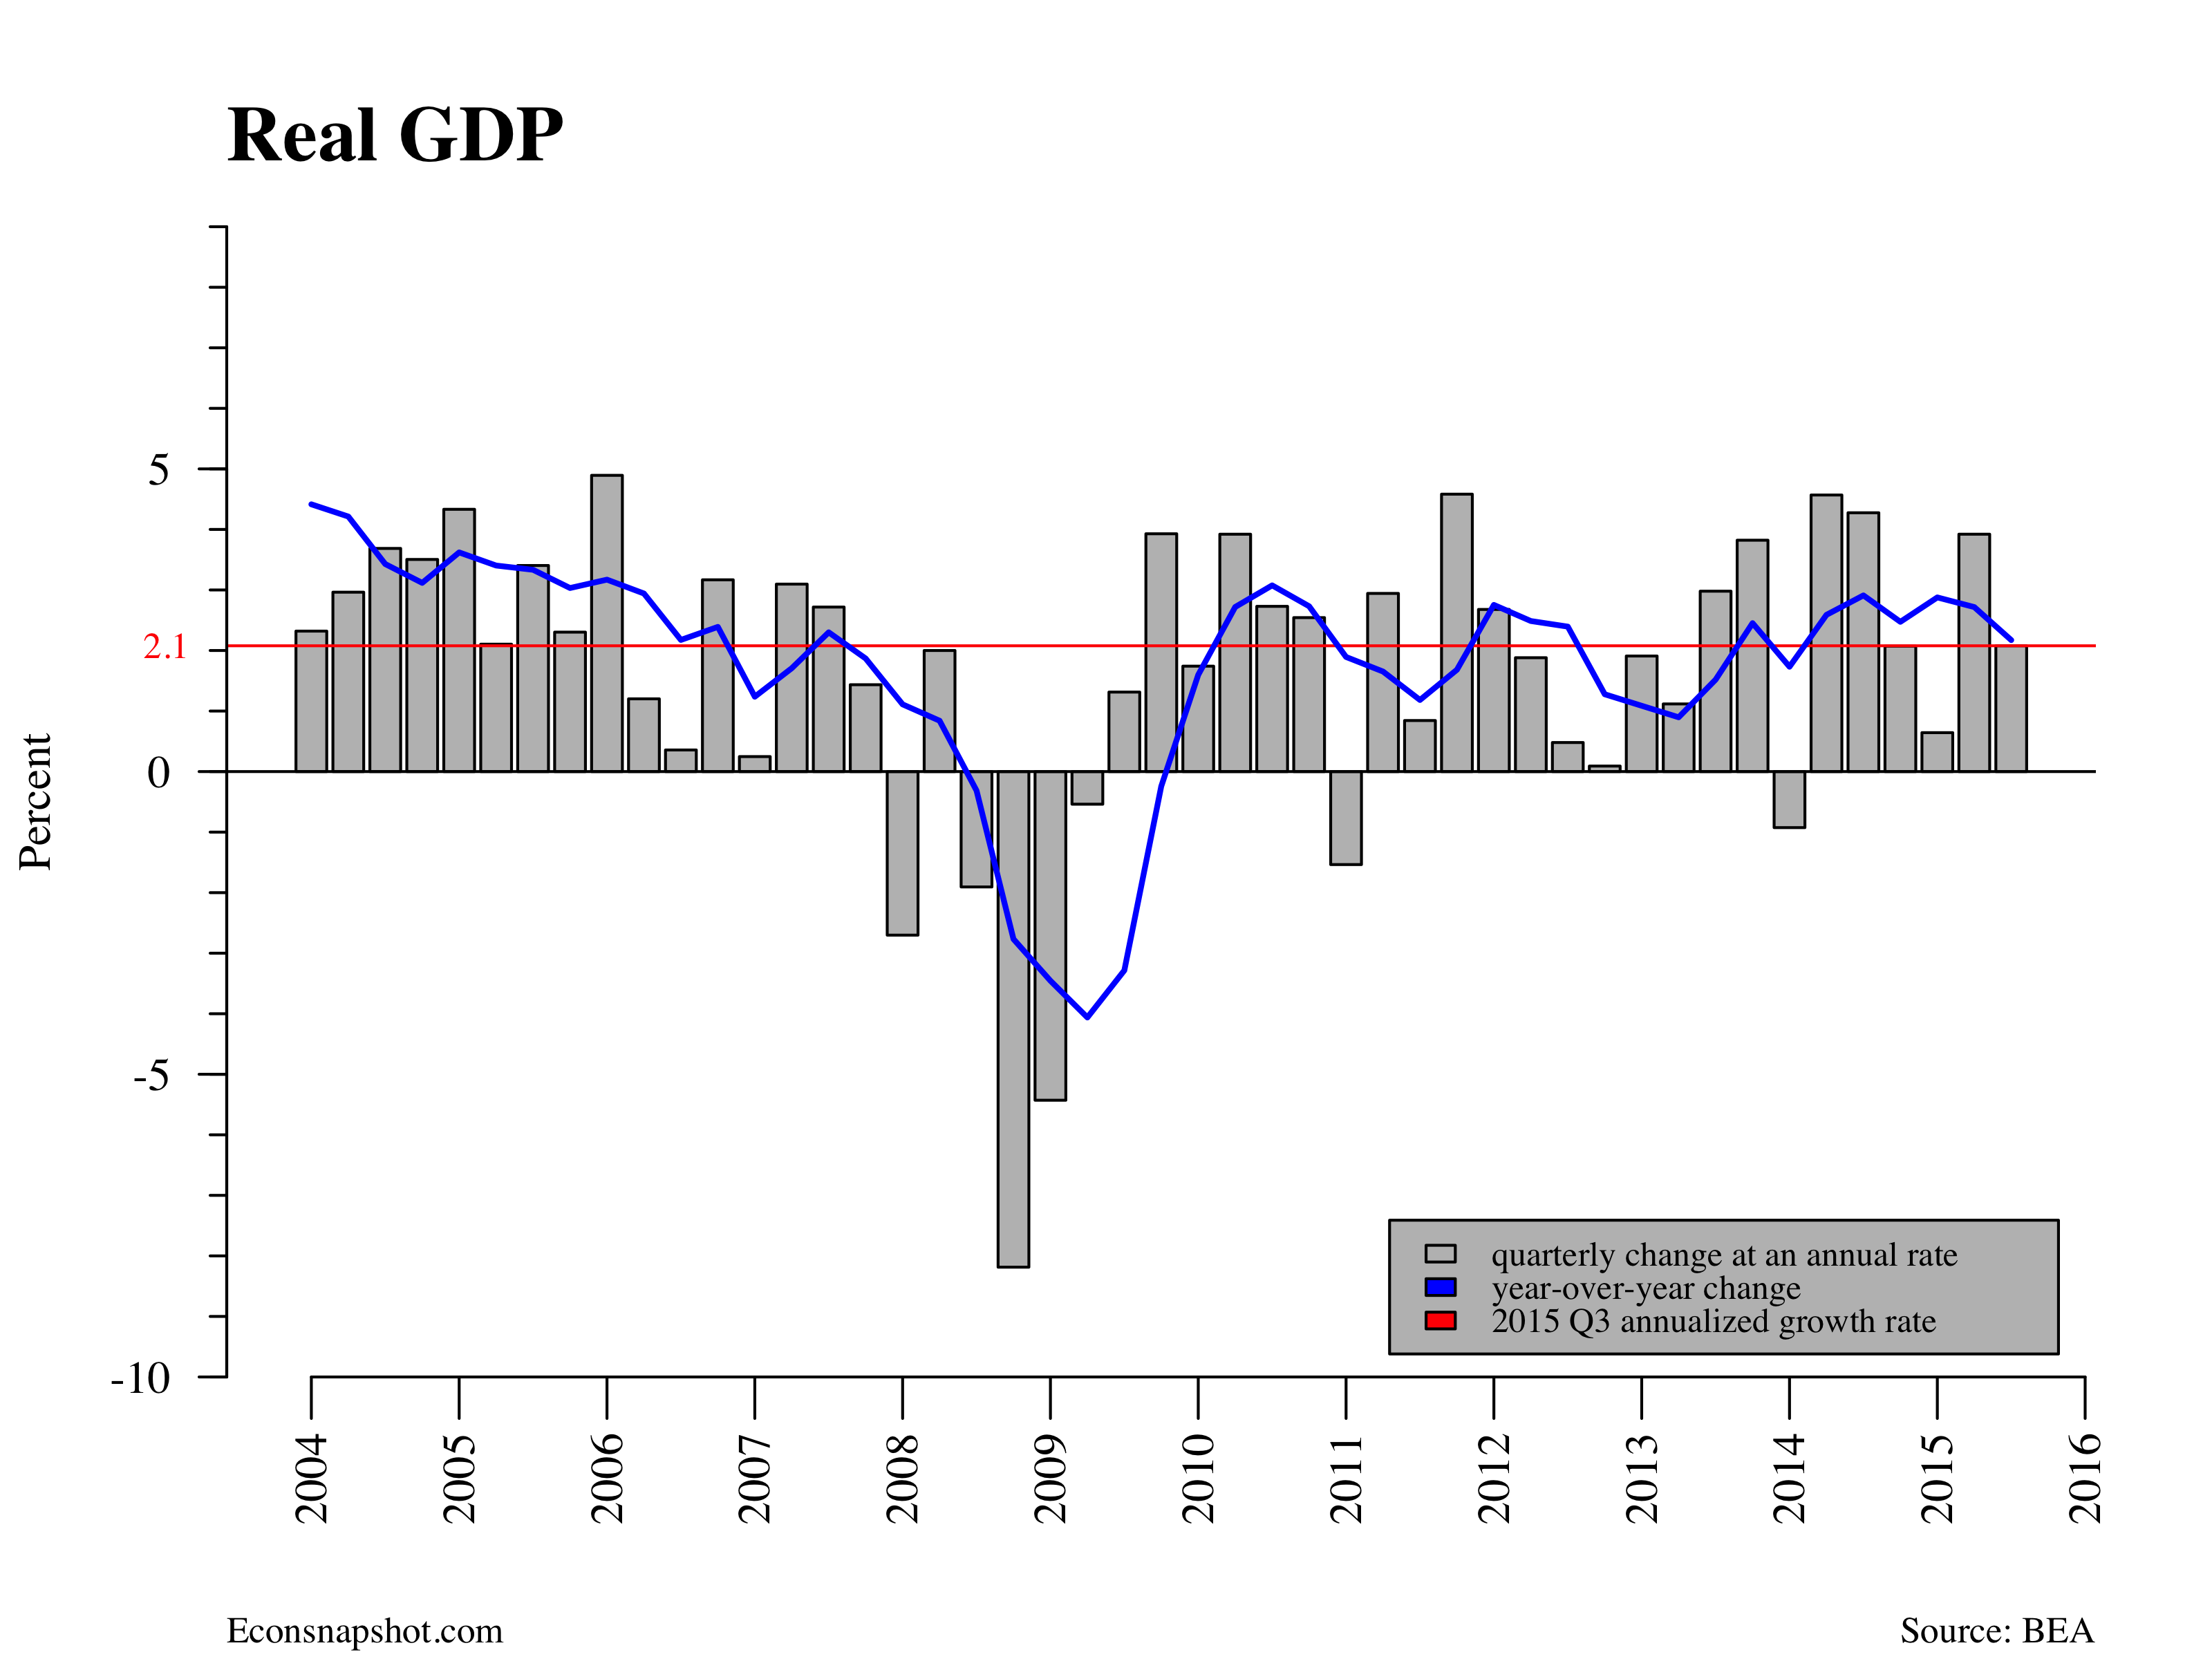
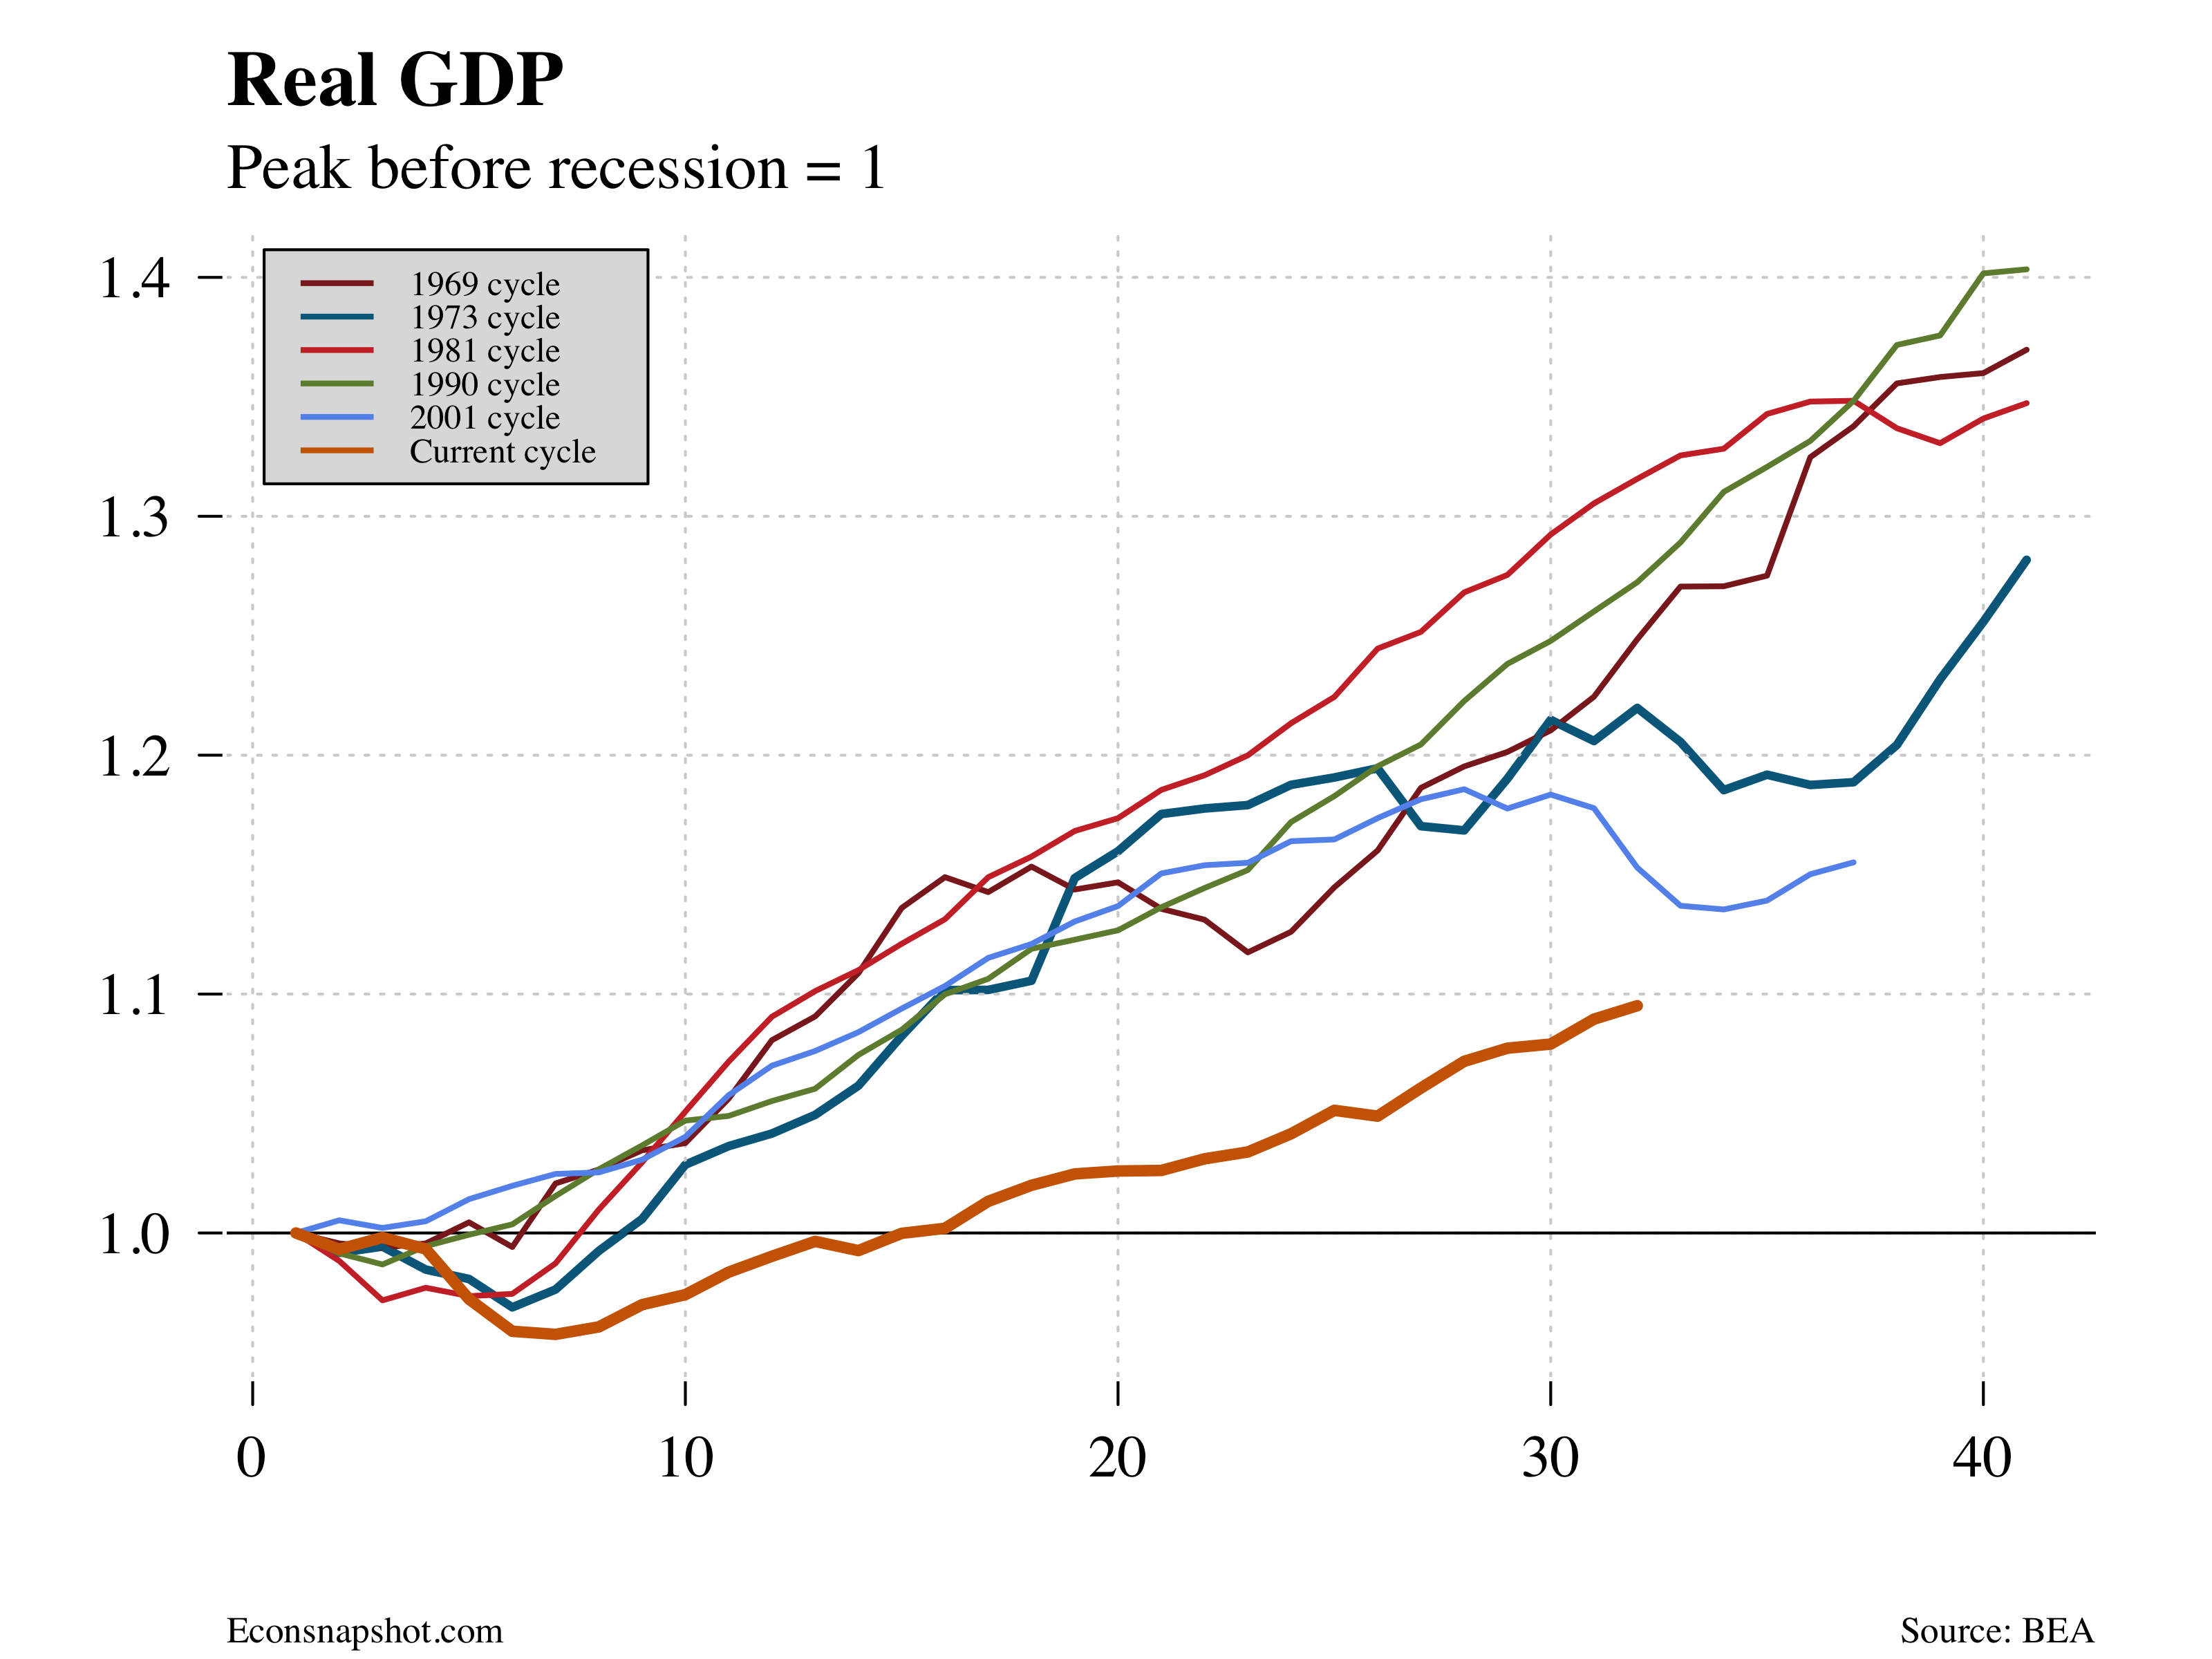
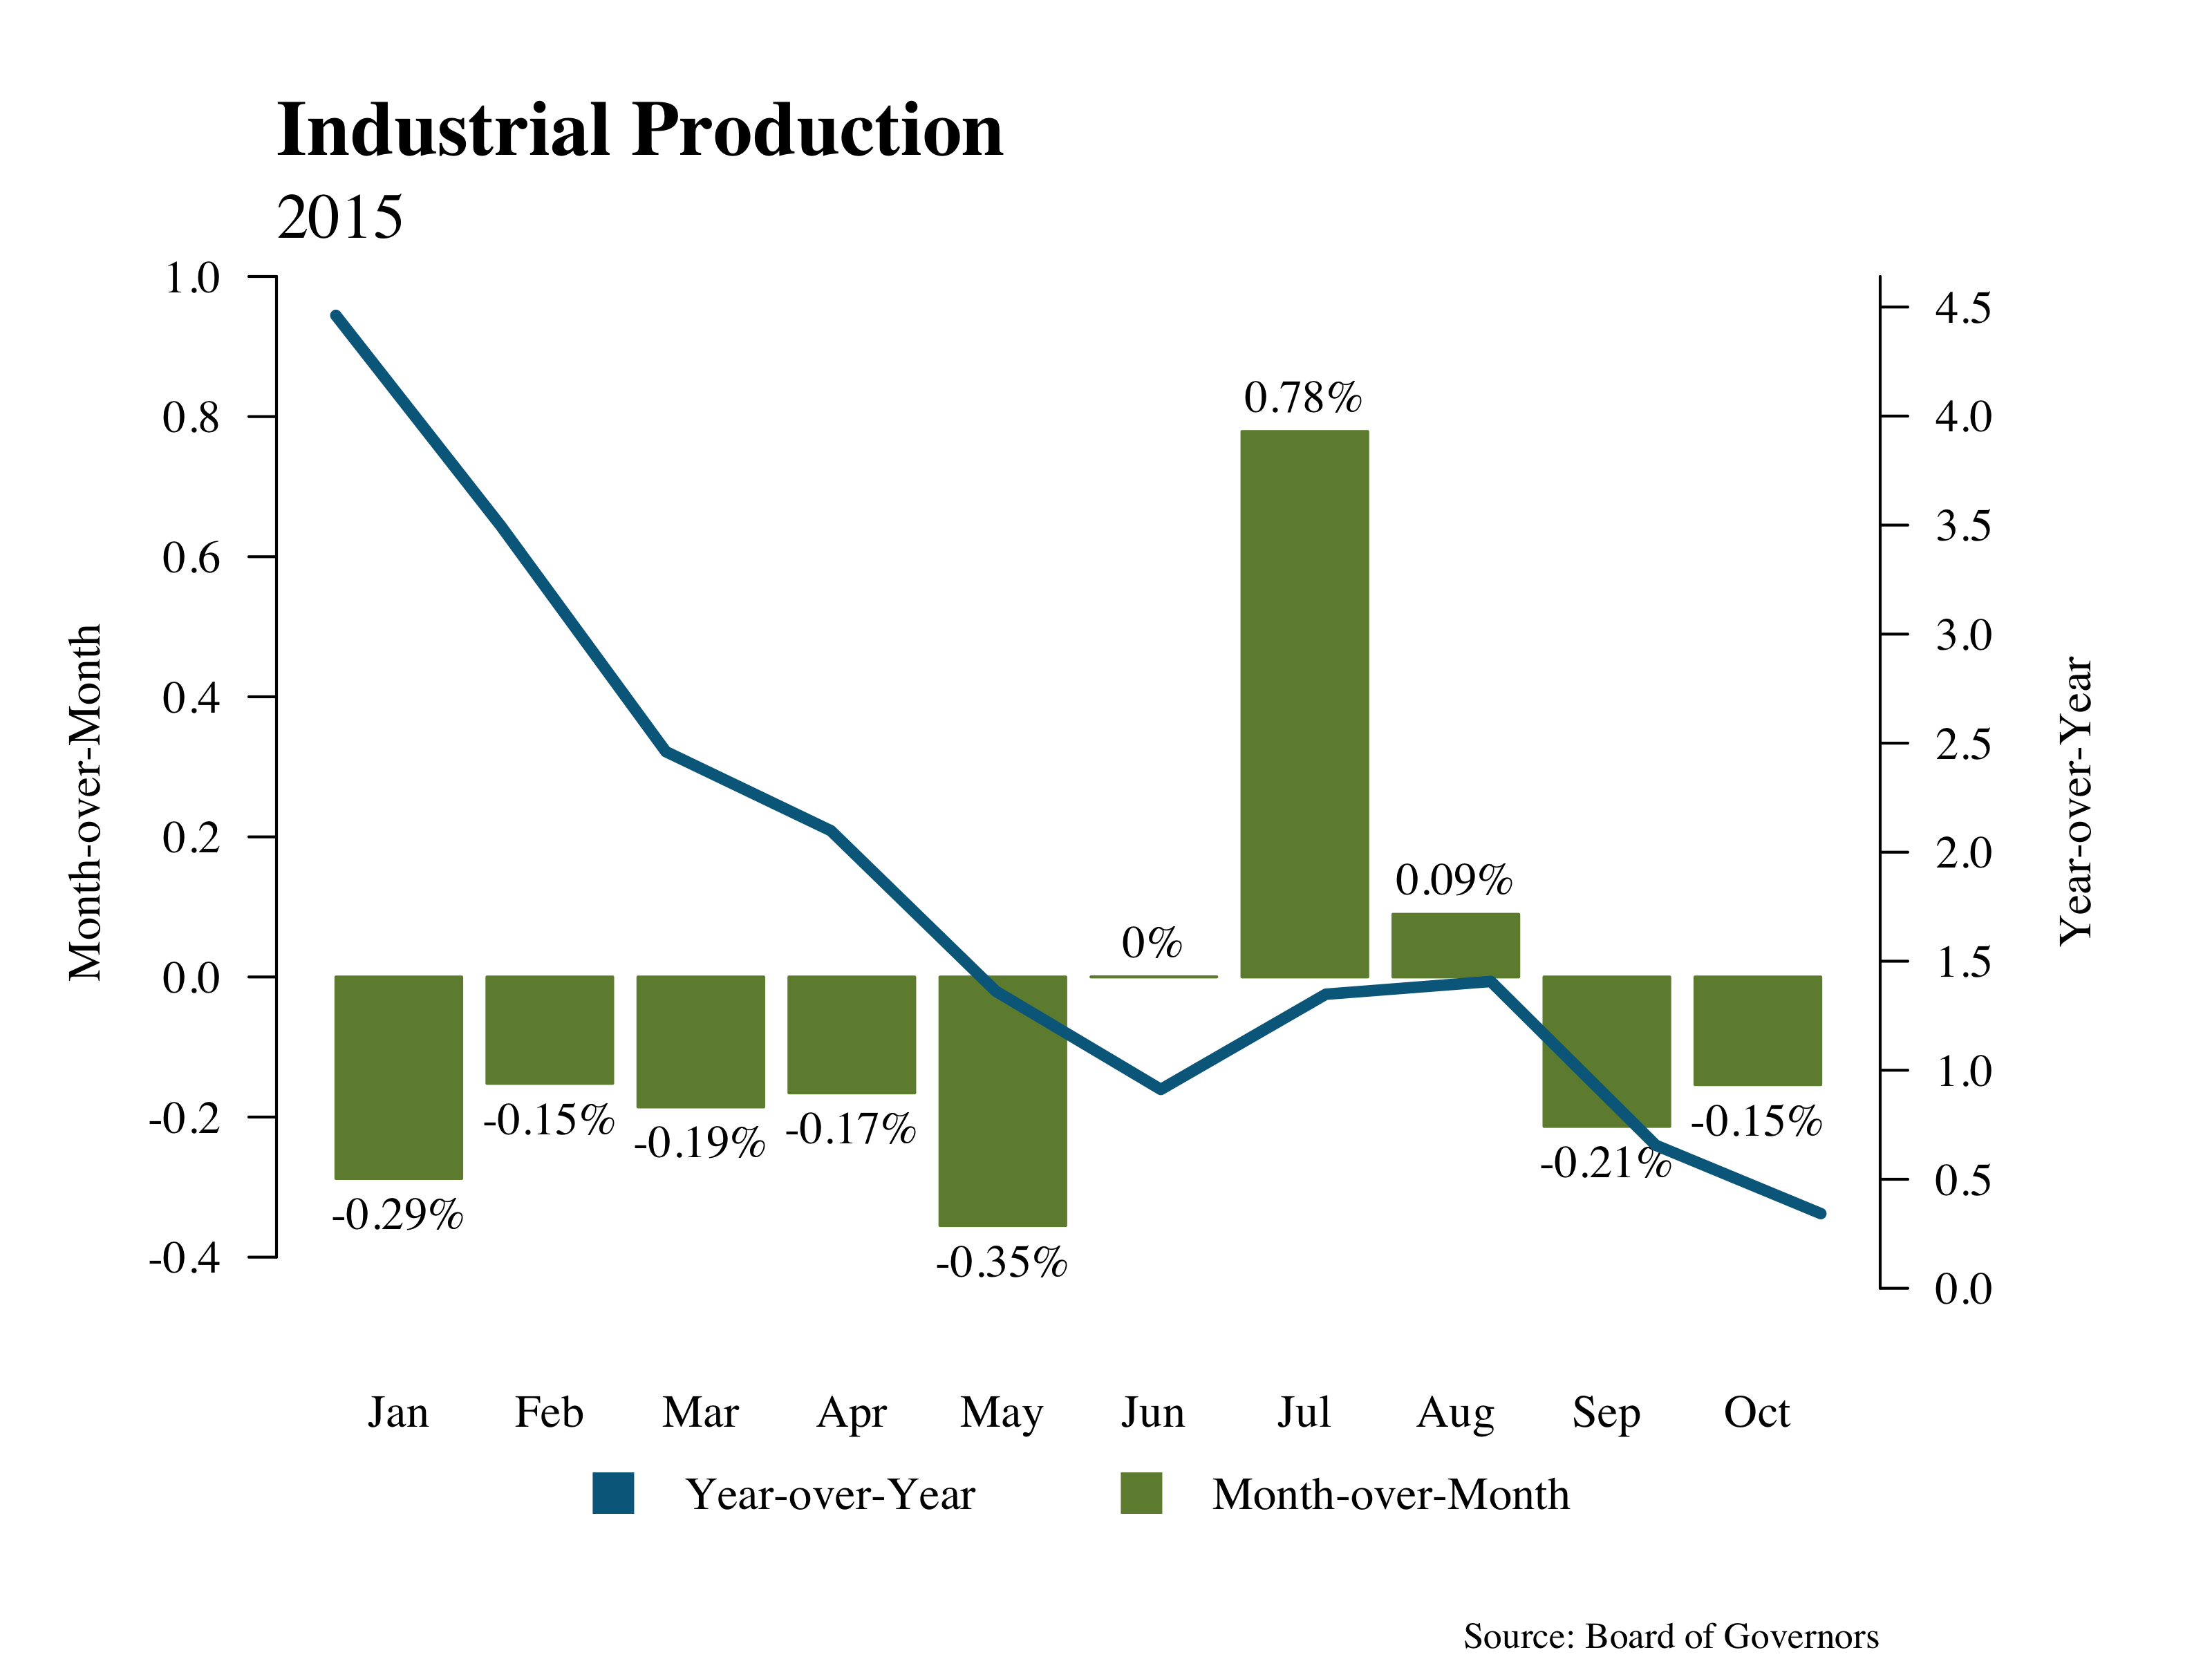
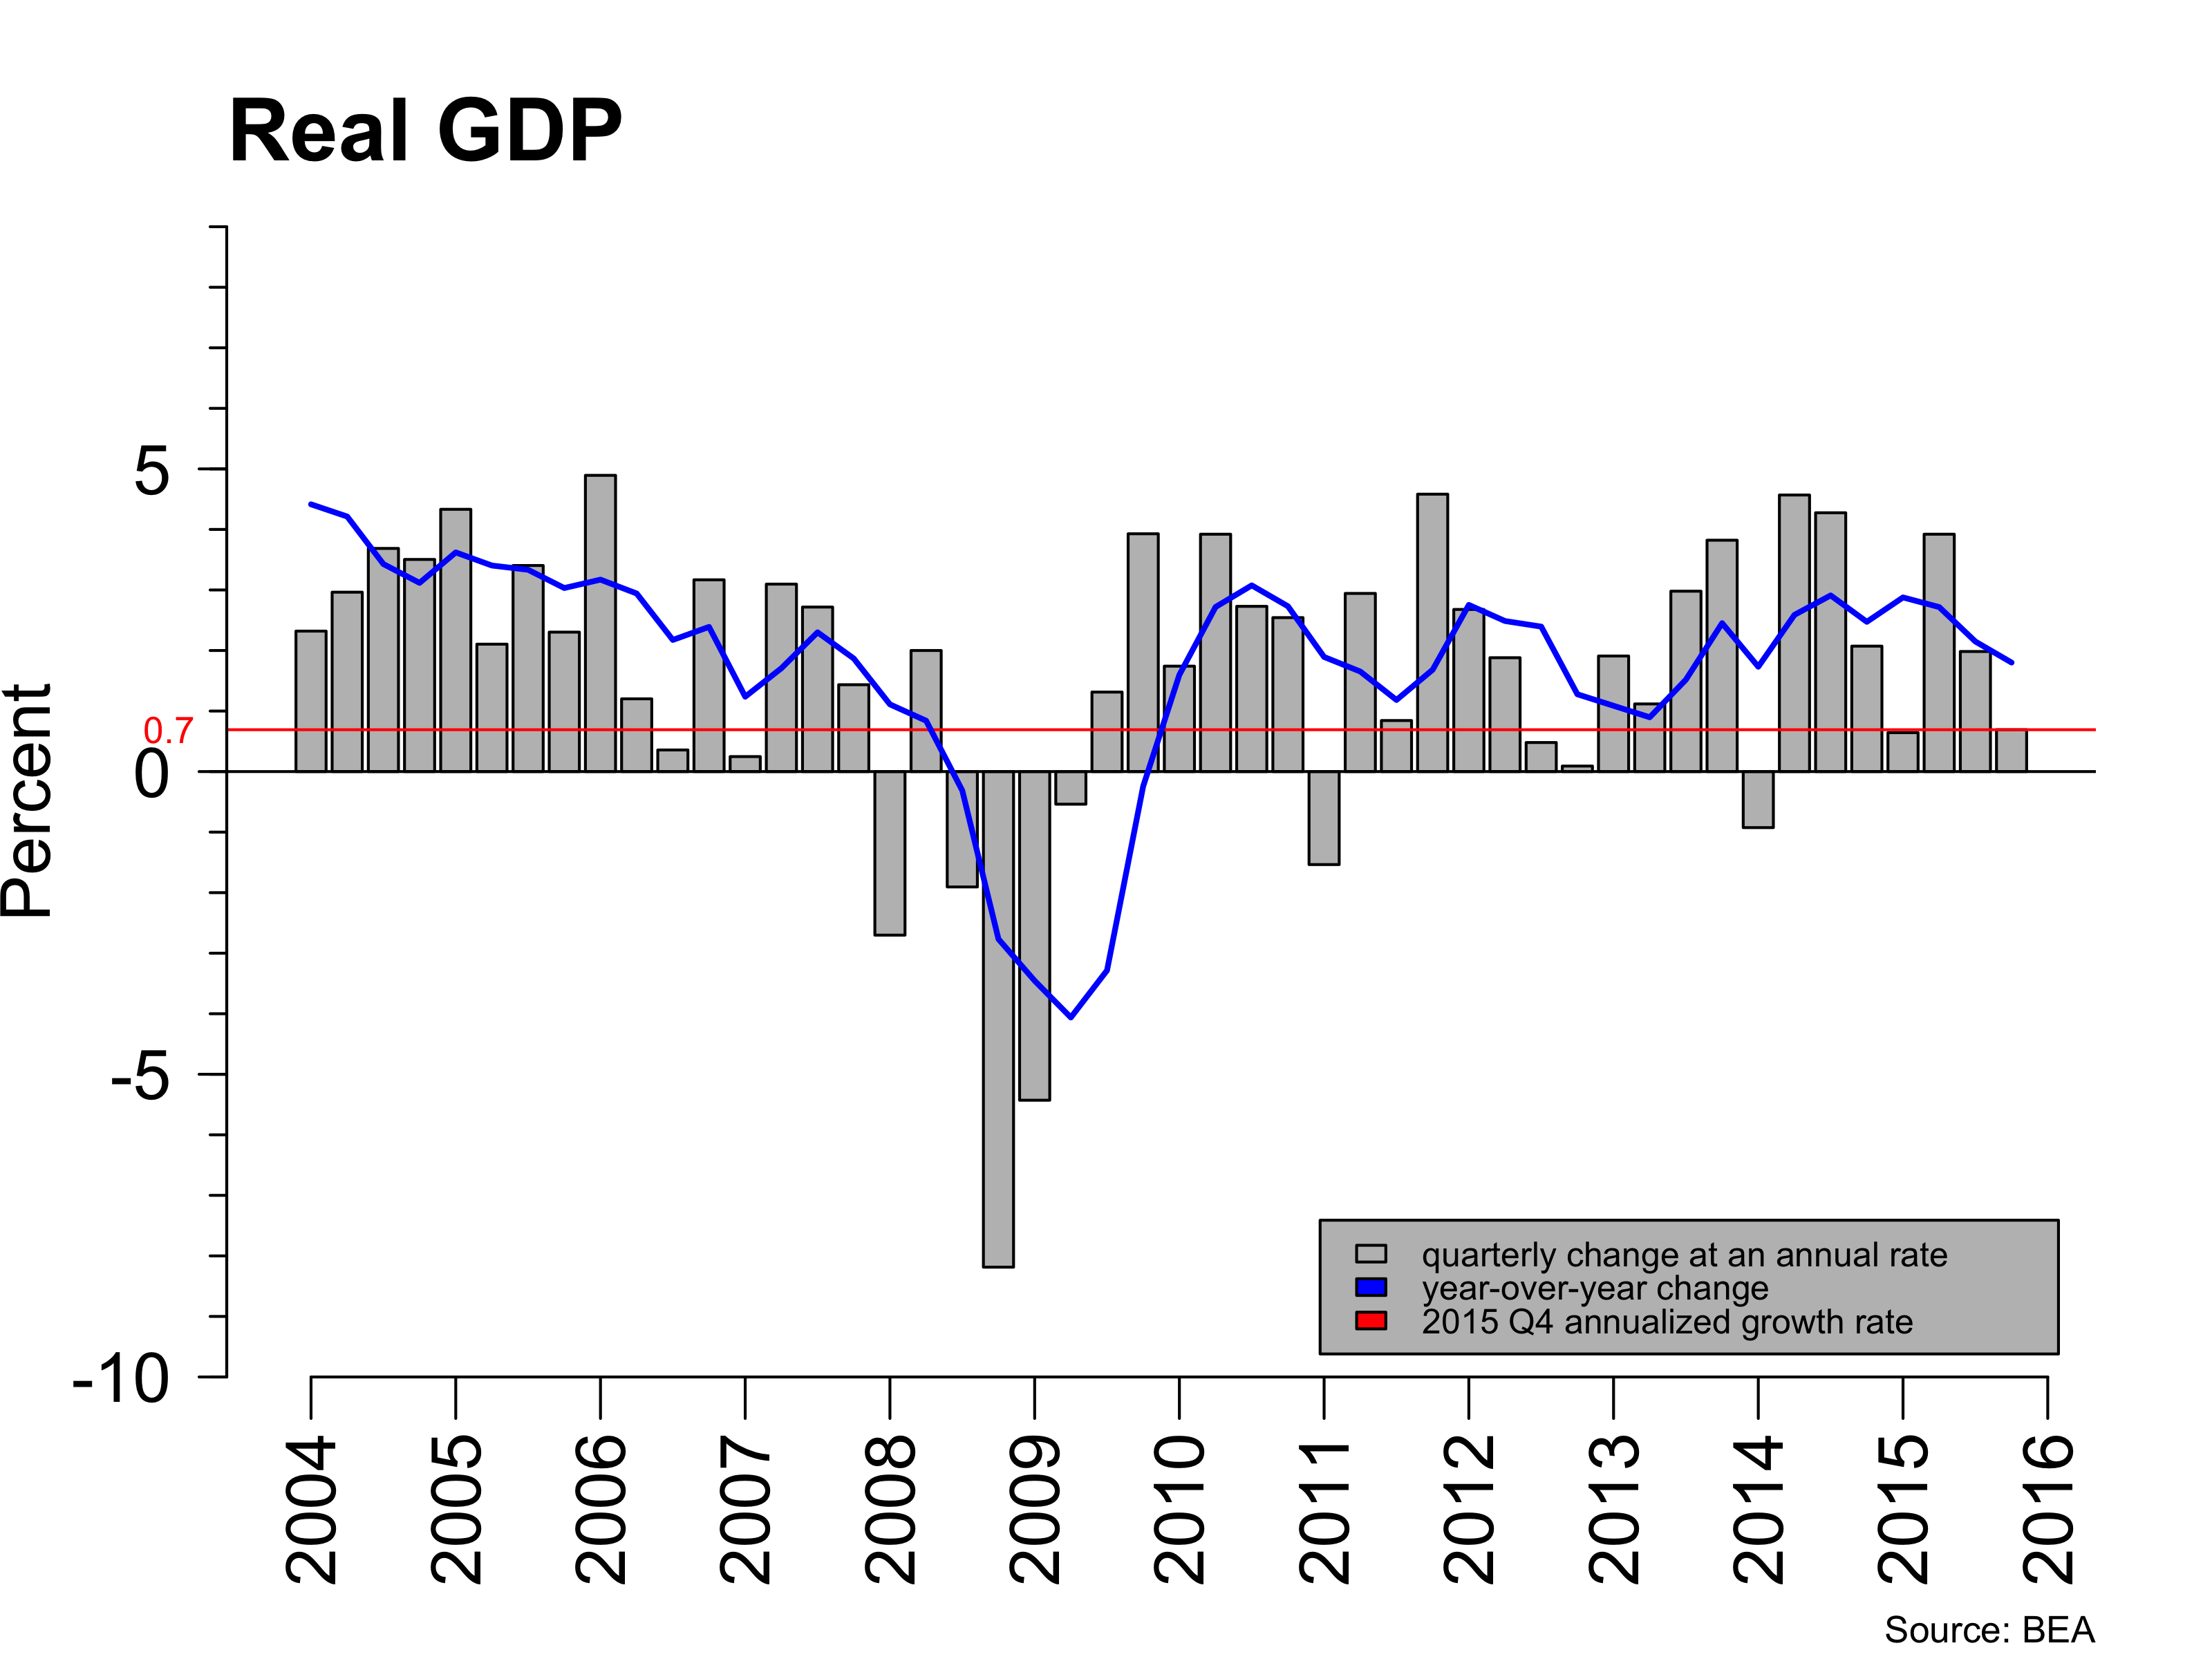
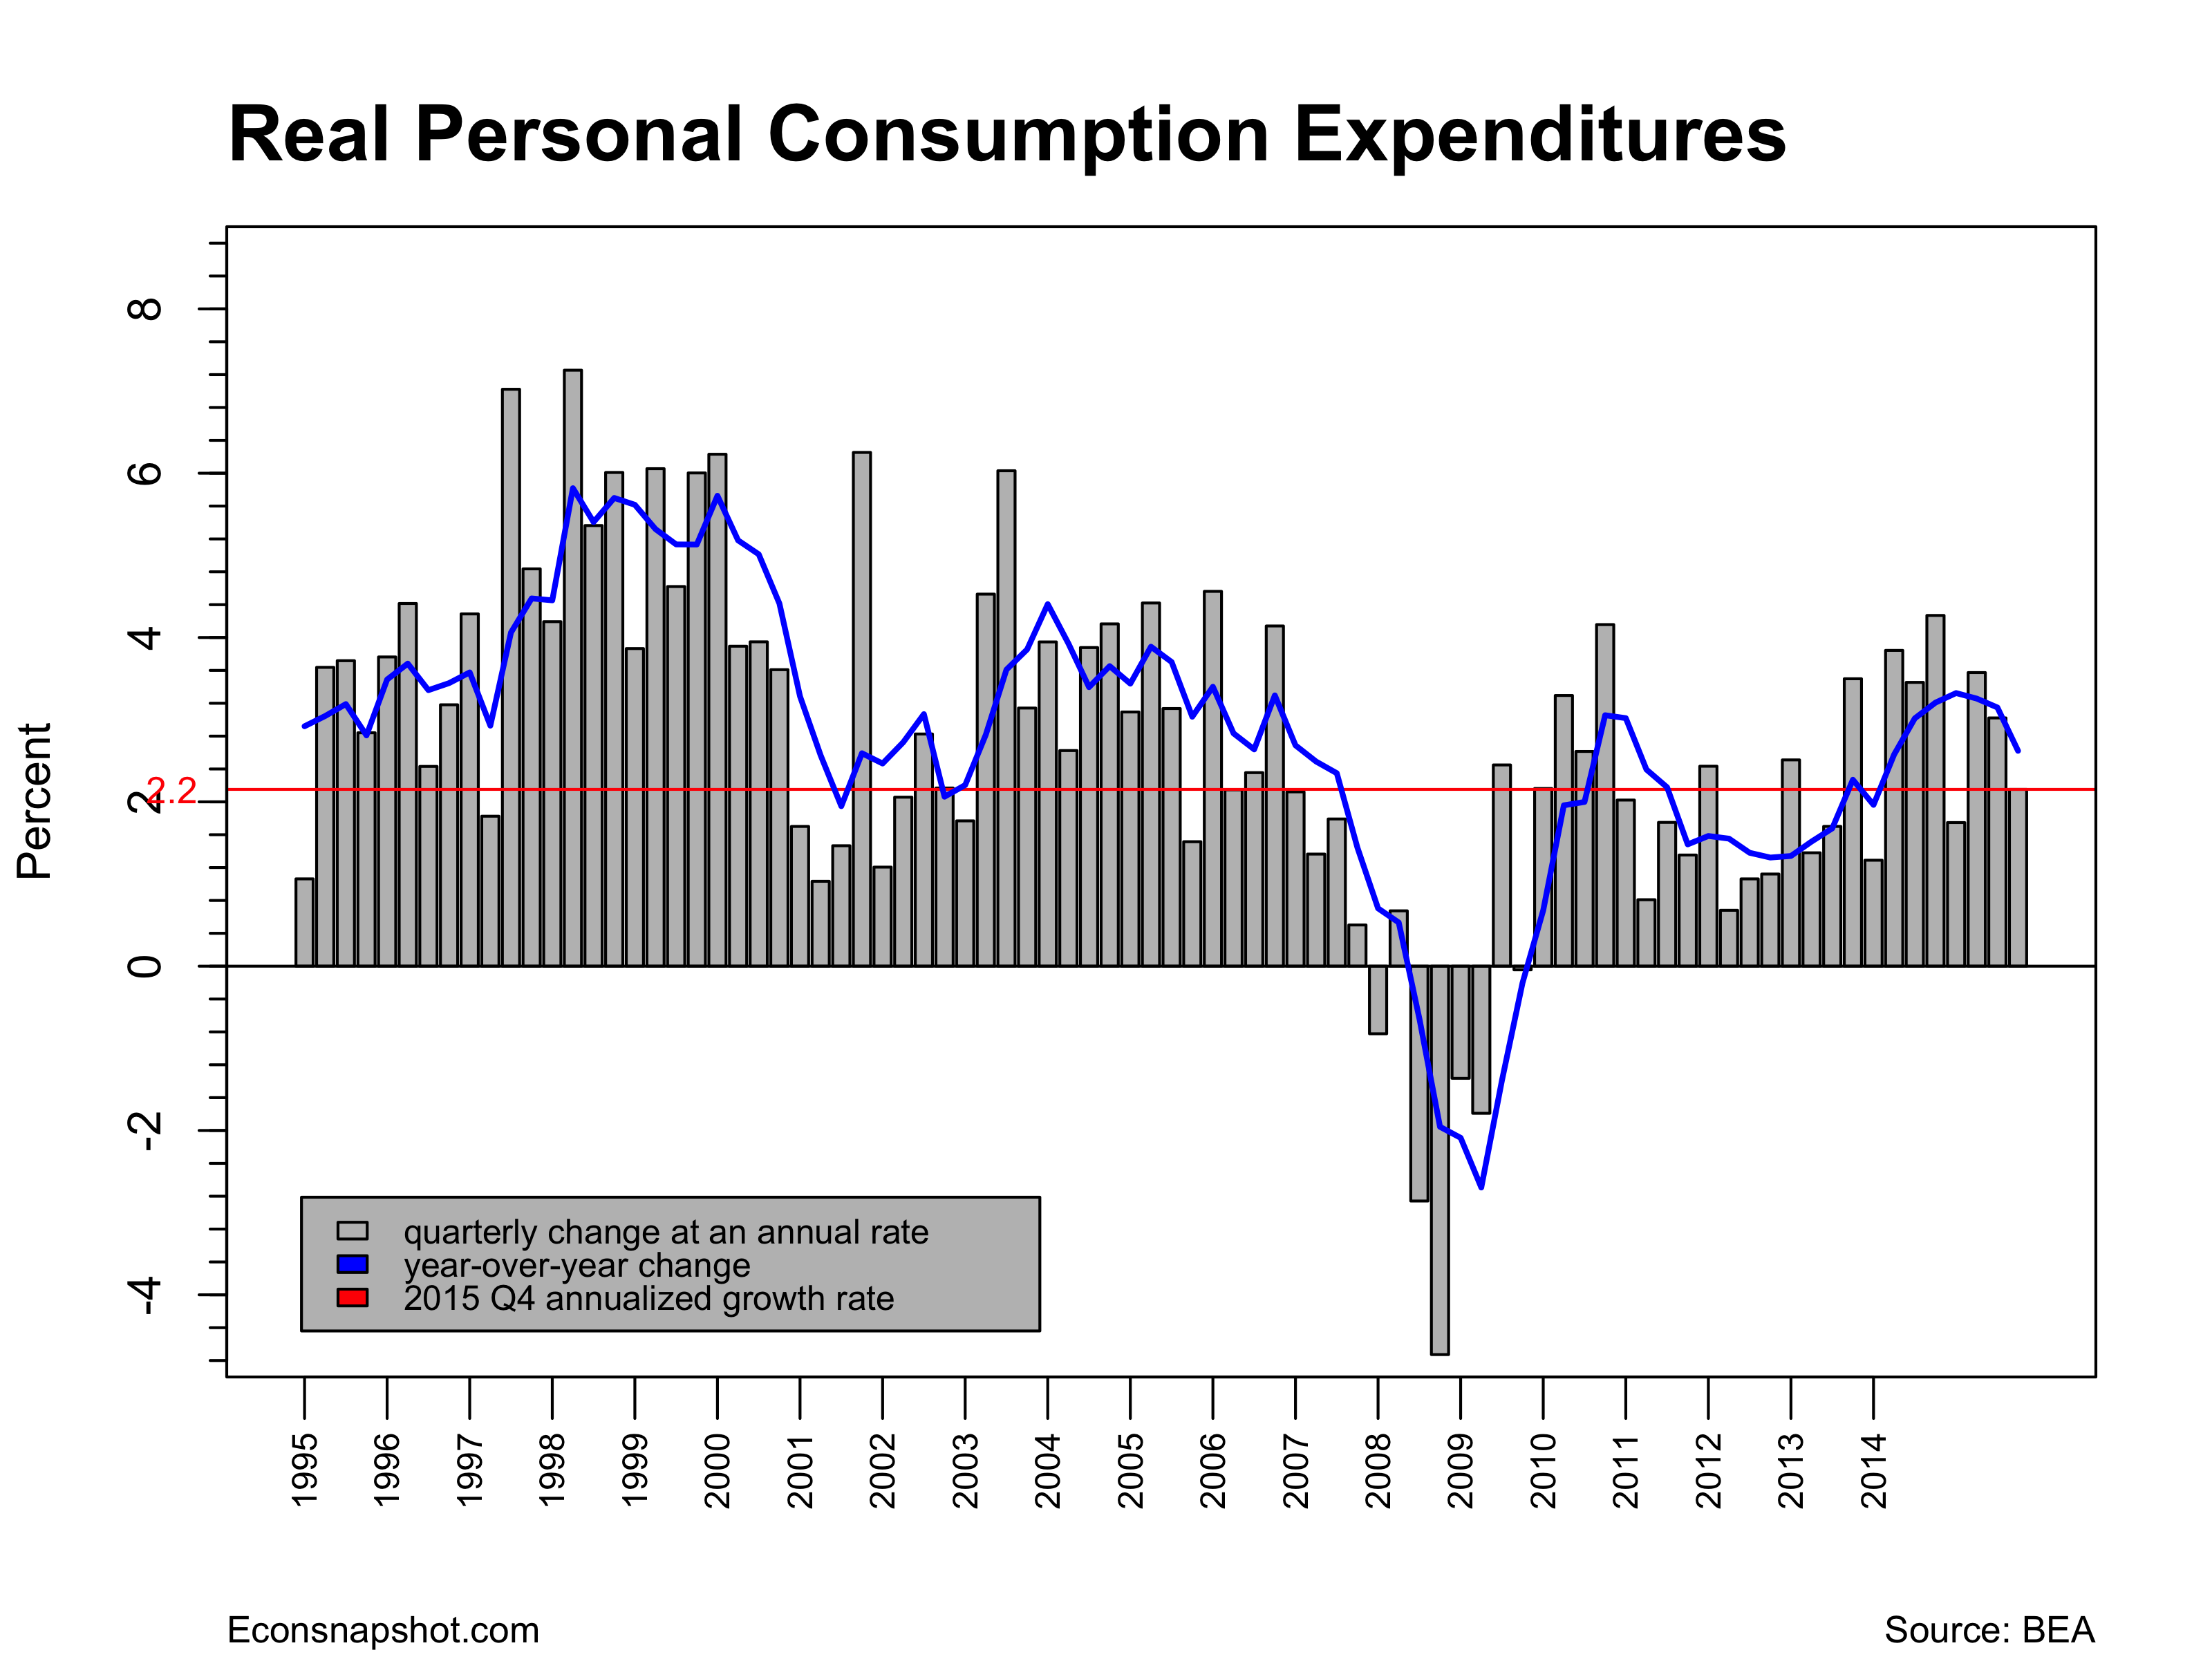
Today’s release of the “advance” estimate for GDP for 2015 QIV shows 2015 ending with a dud as growth slowed throughout the year. Real GDP increased only 0.7% at a seasonally adjusted annual rate. Both real GDP and real personal consumption expenditures (PCE) have taken a decidedly downward turn. The weak numbers were widely anticipated, presaged by falling industrial production, declining exports and weak consumer demand. The question on everyone’s mind is whether this portends a more prolonged contraction in the economy.
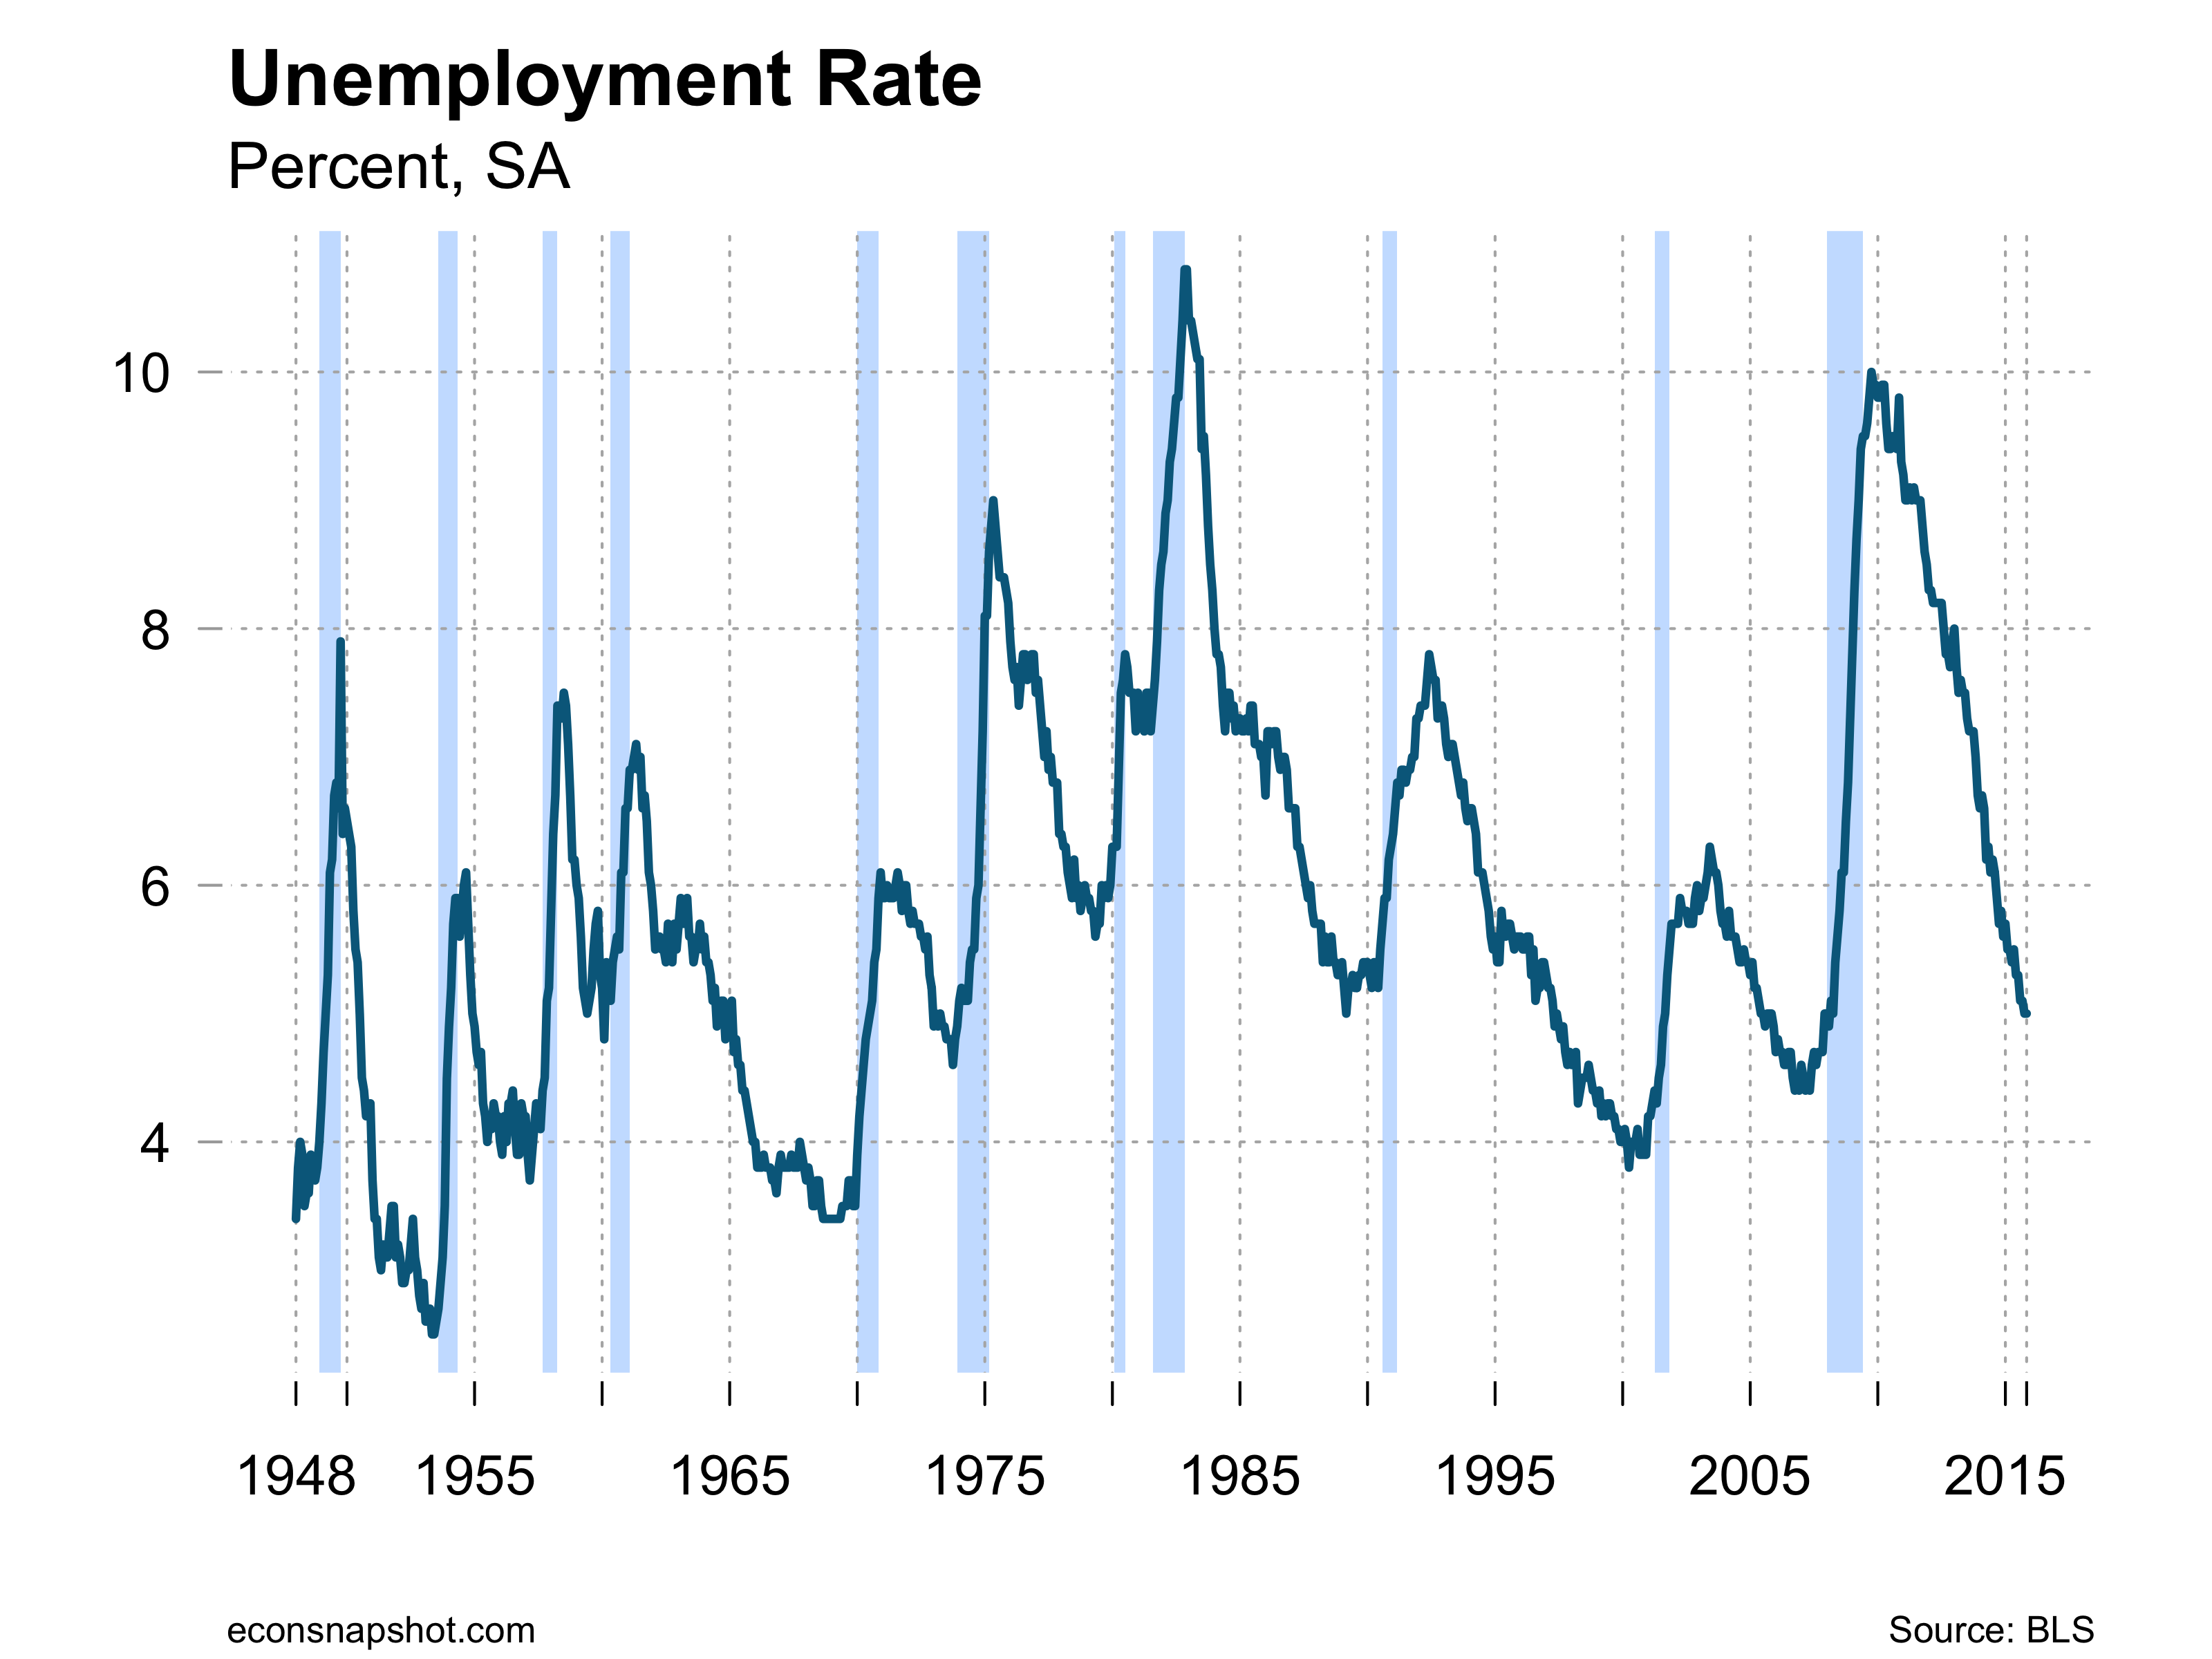
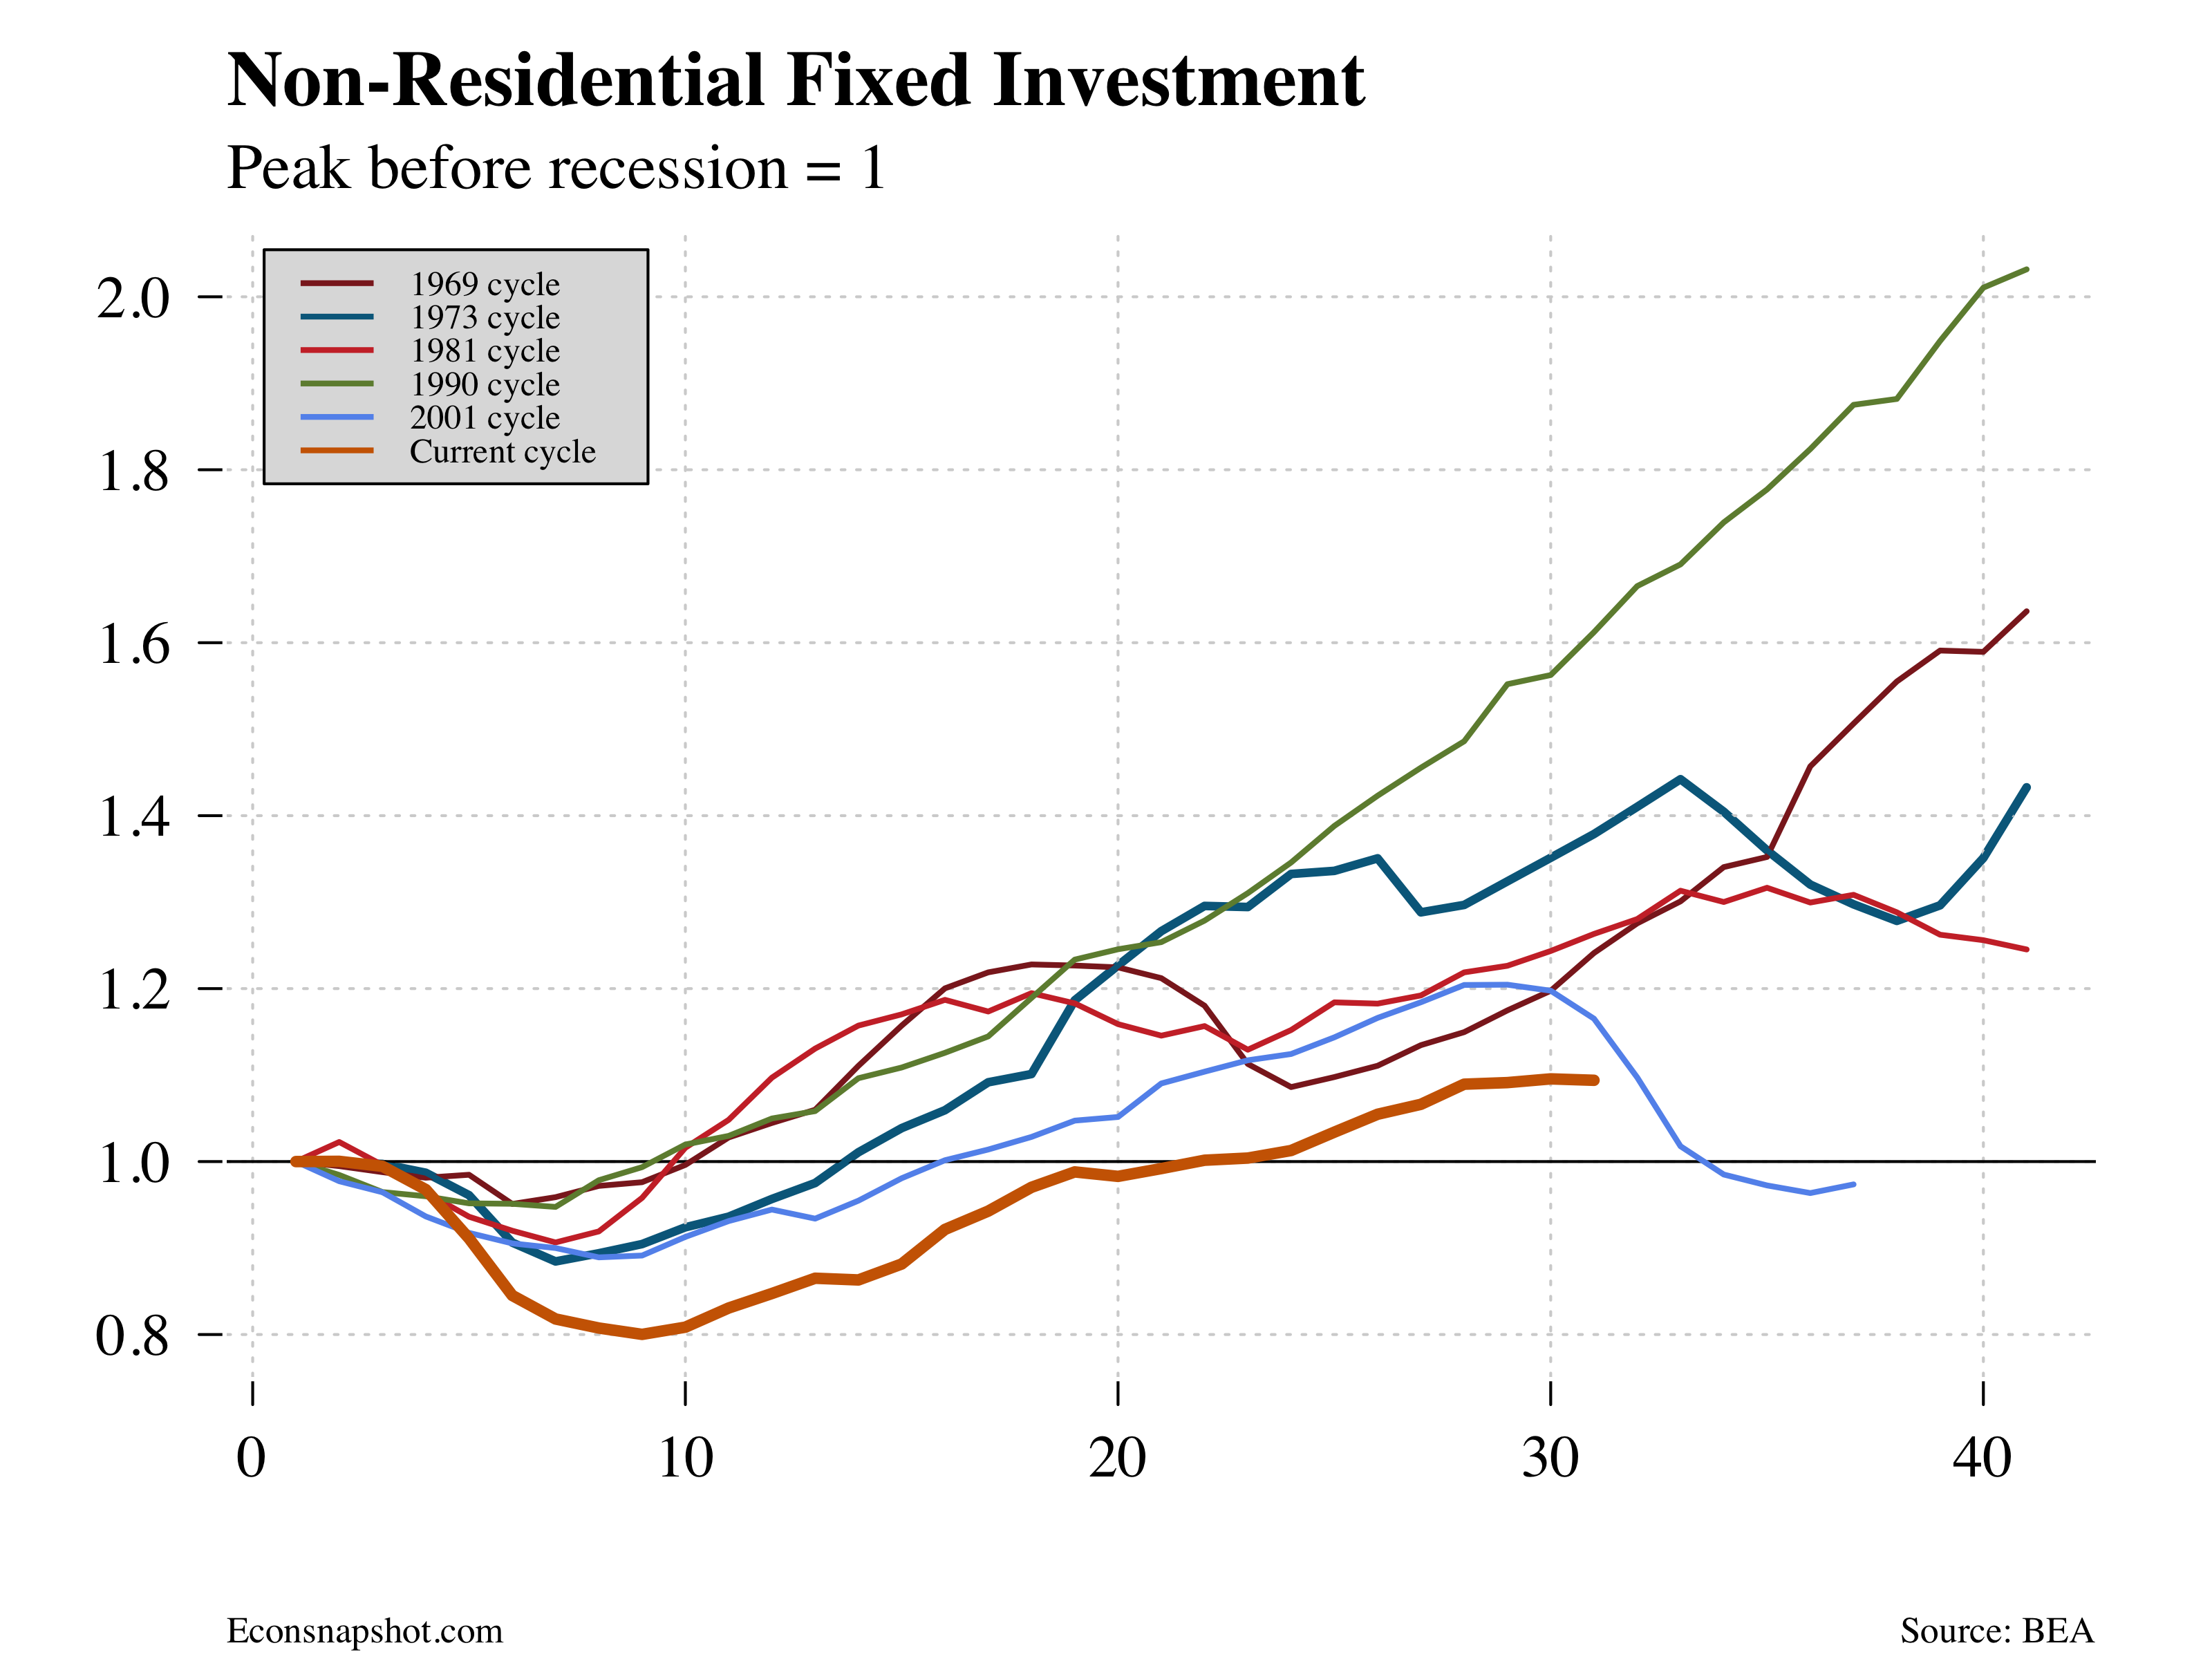
Looking at previous business cycles, it is clear that this recovery, while weak, is beginning to look mature. Job growth has continued strong and the unemployment rate is low but this recovery has been in progress for several years now. What are the forces weighing on economic growth that would tip the economy into a contraction?

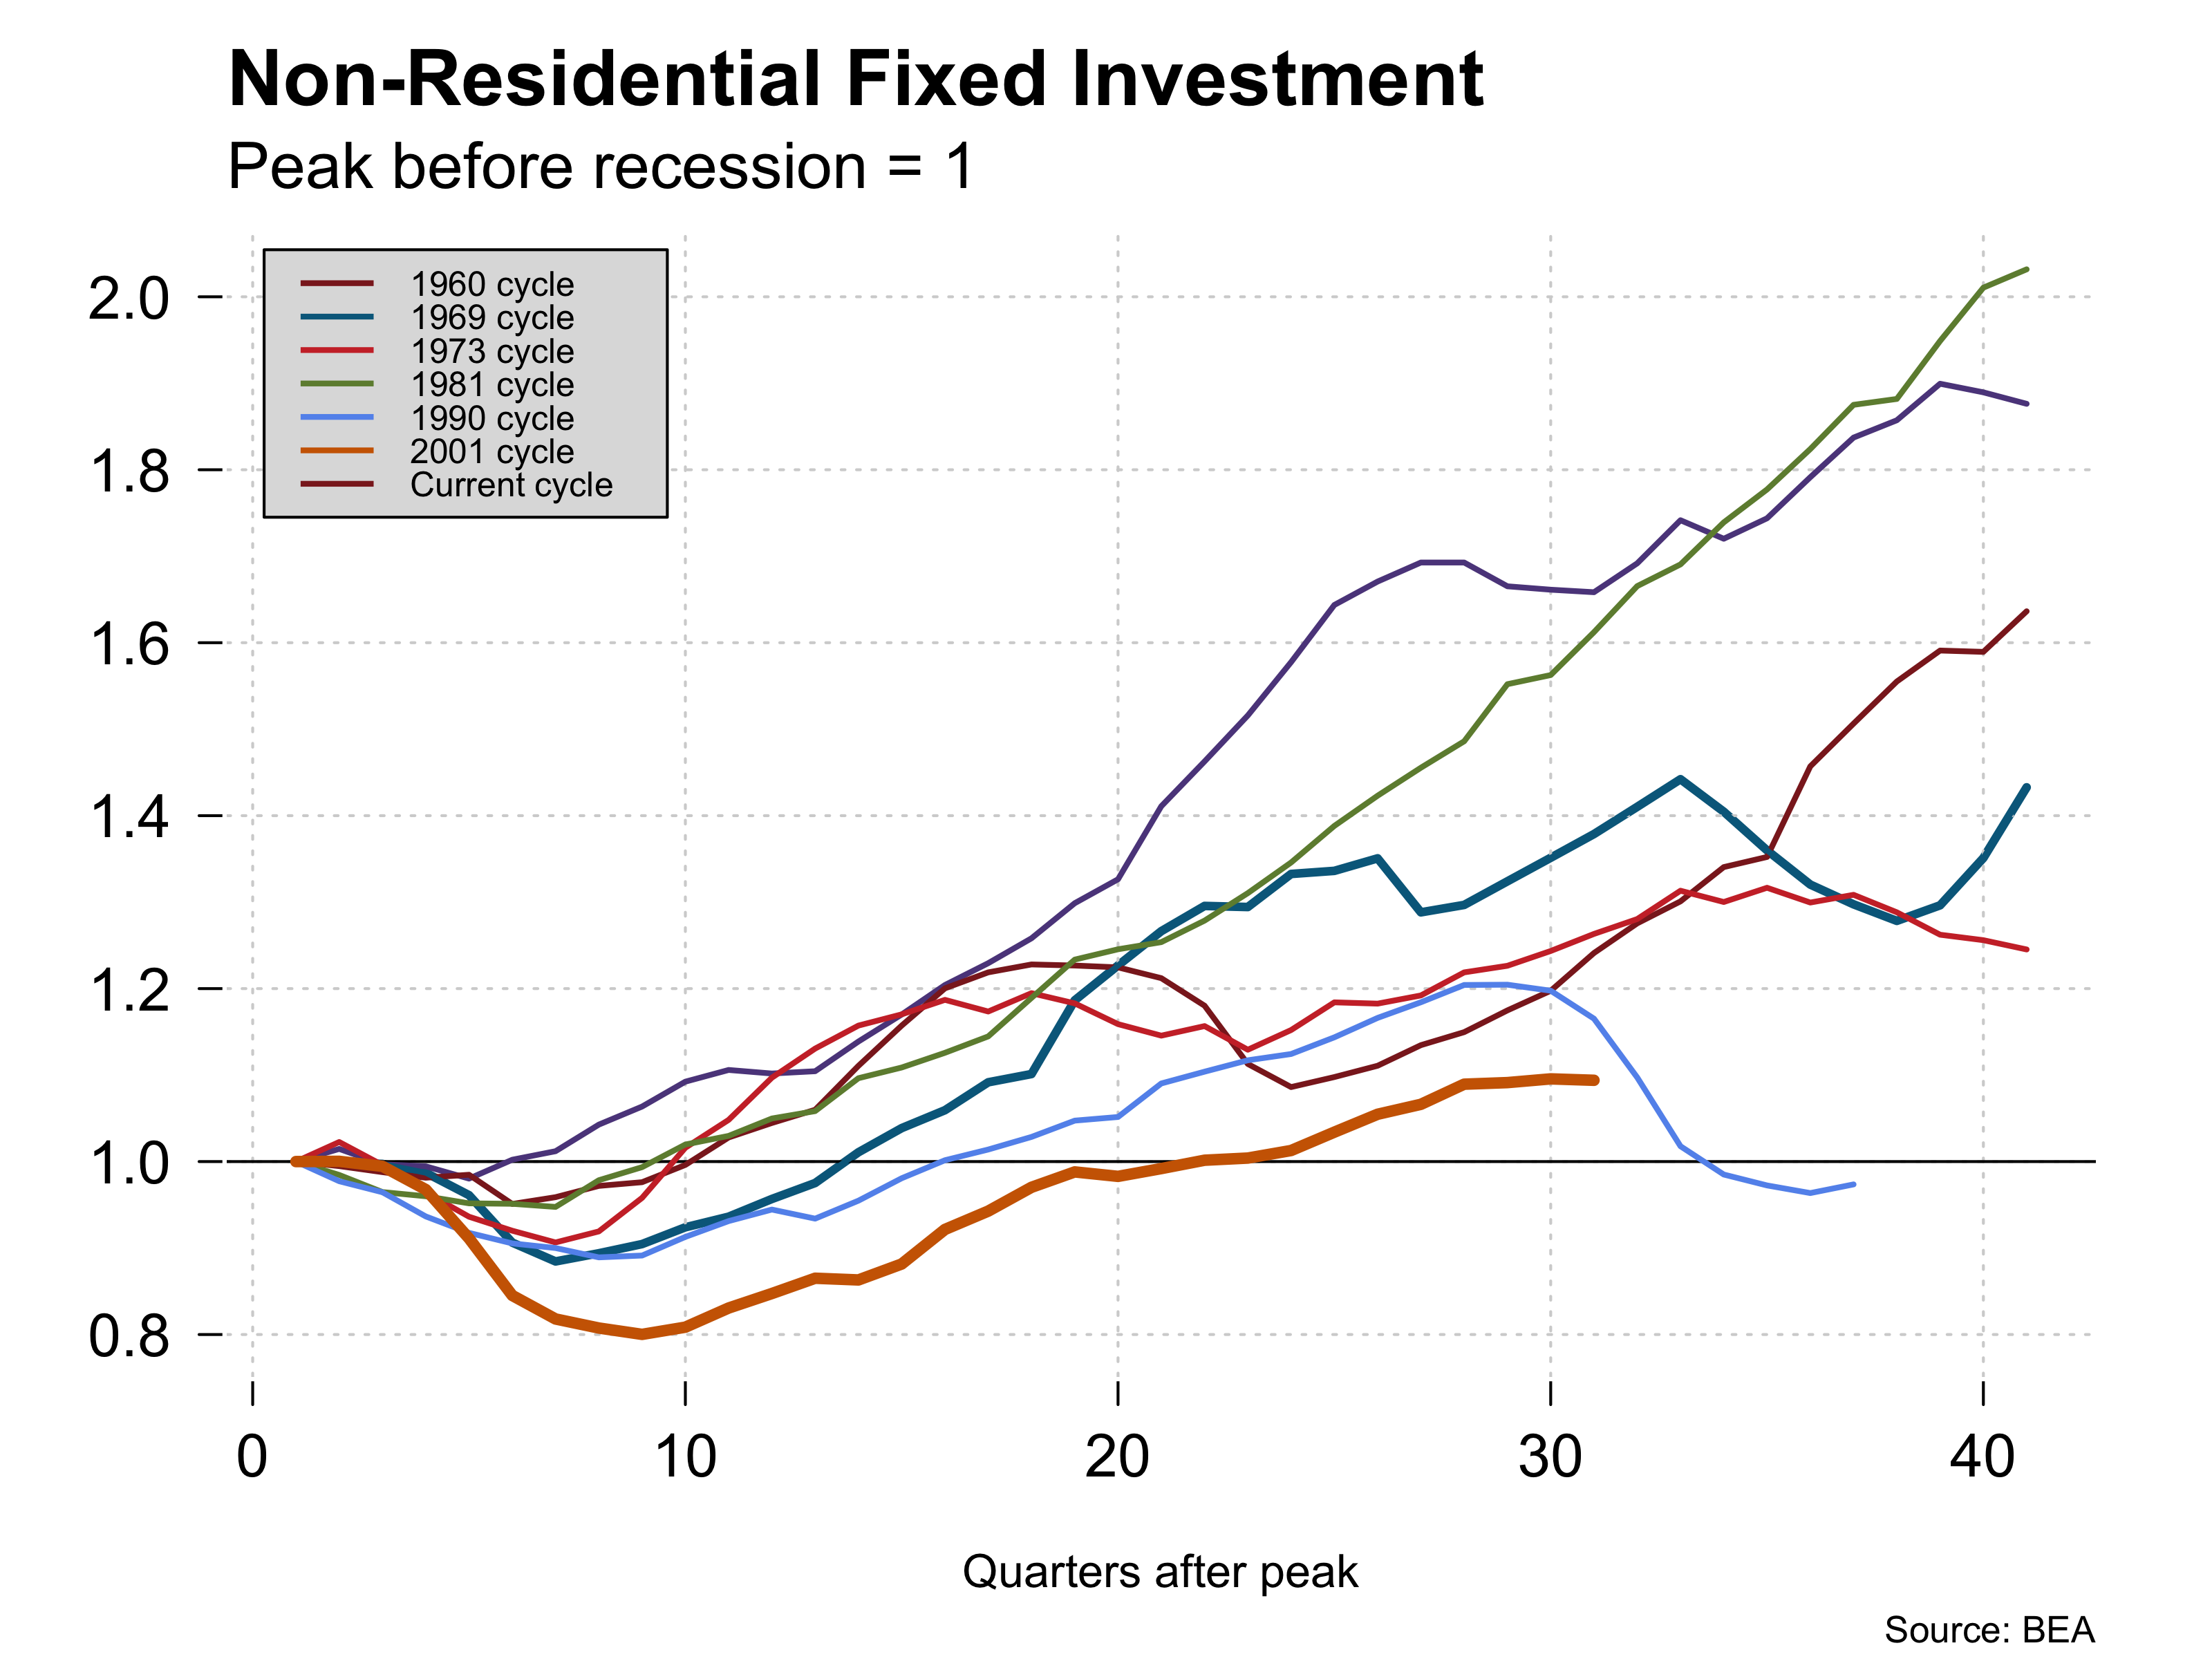
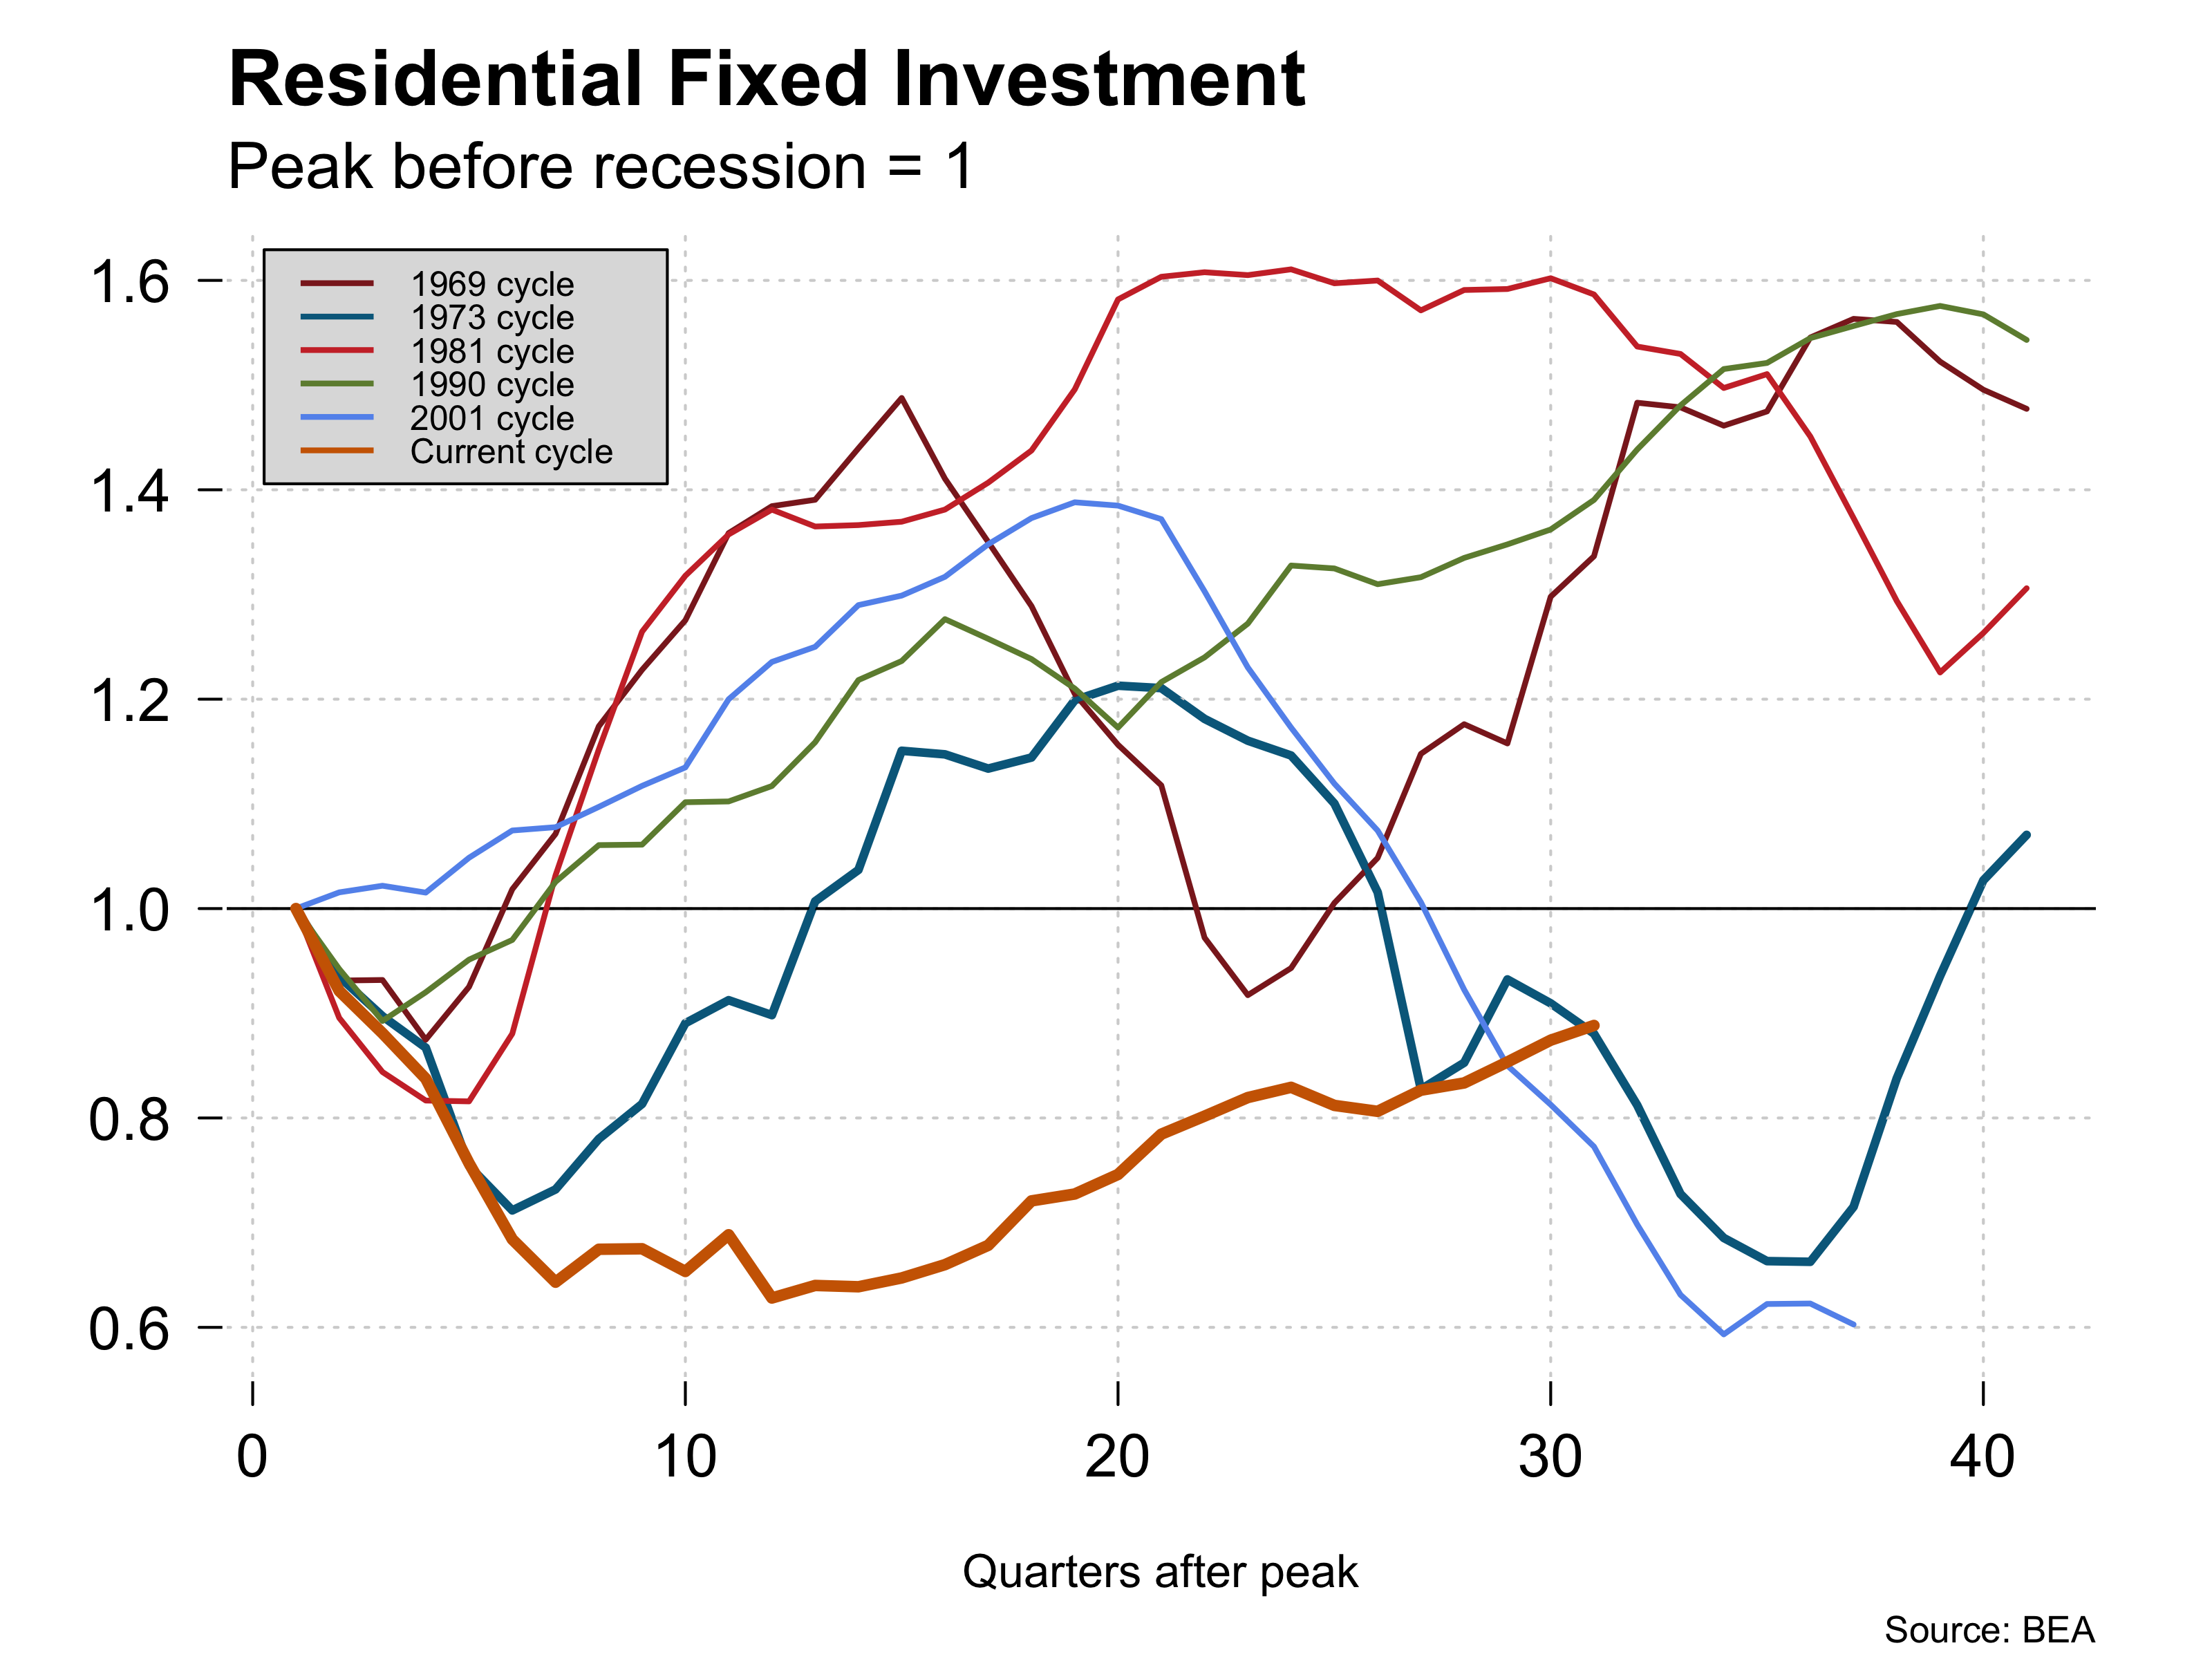
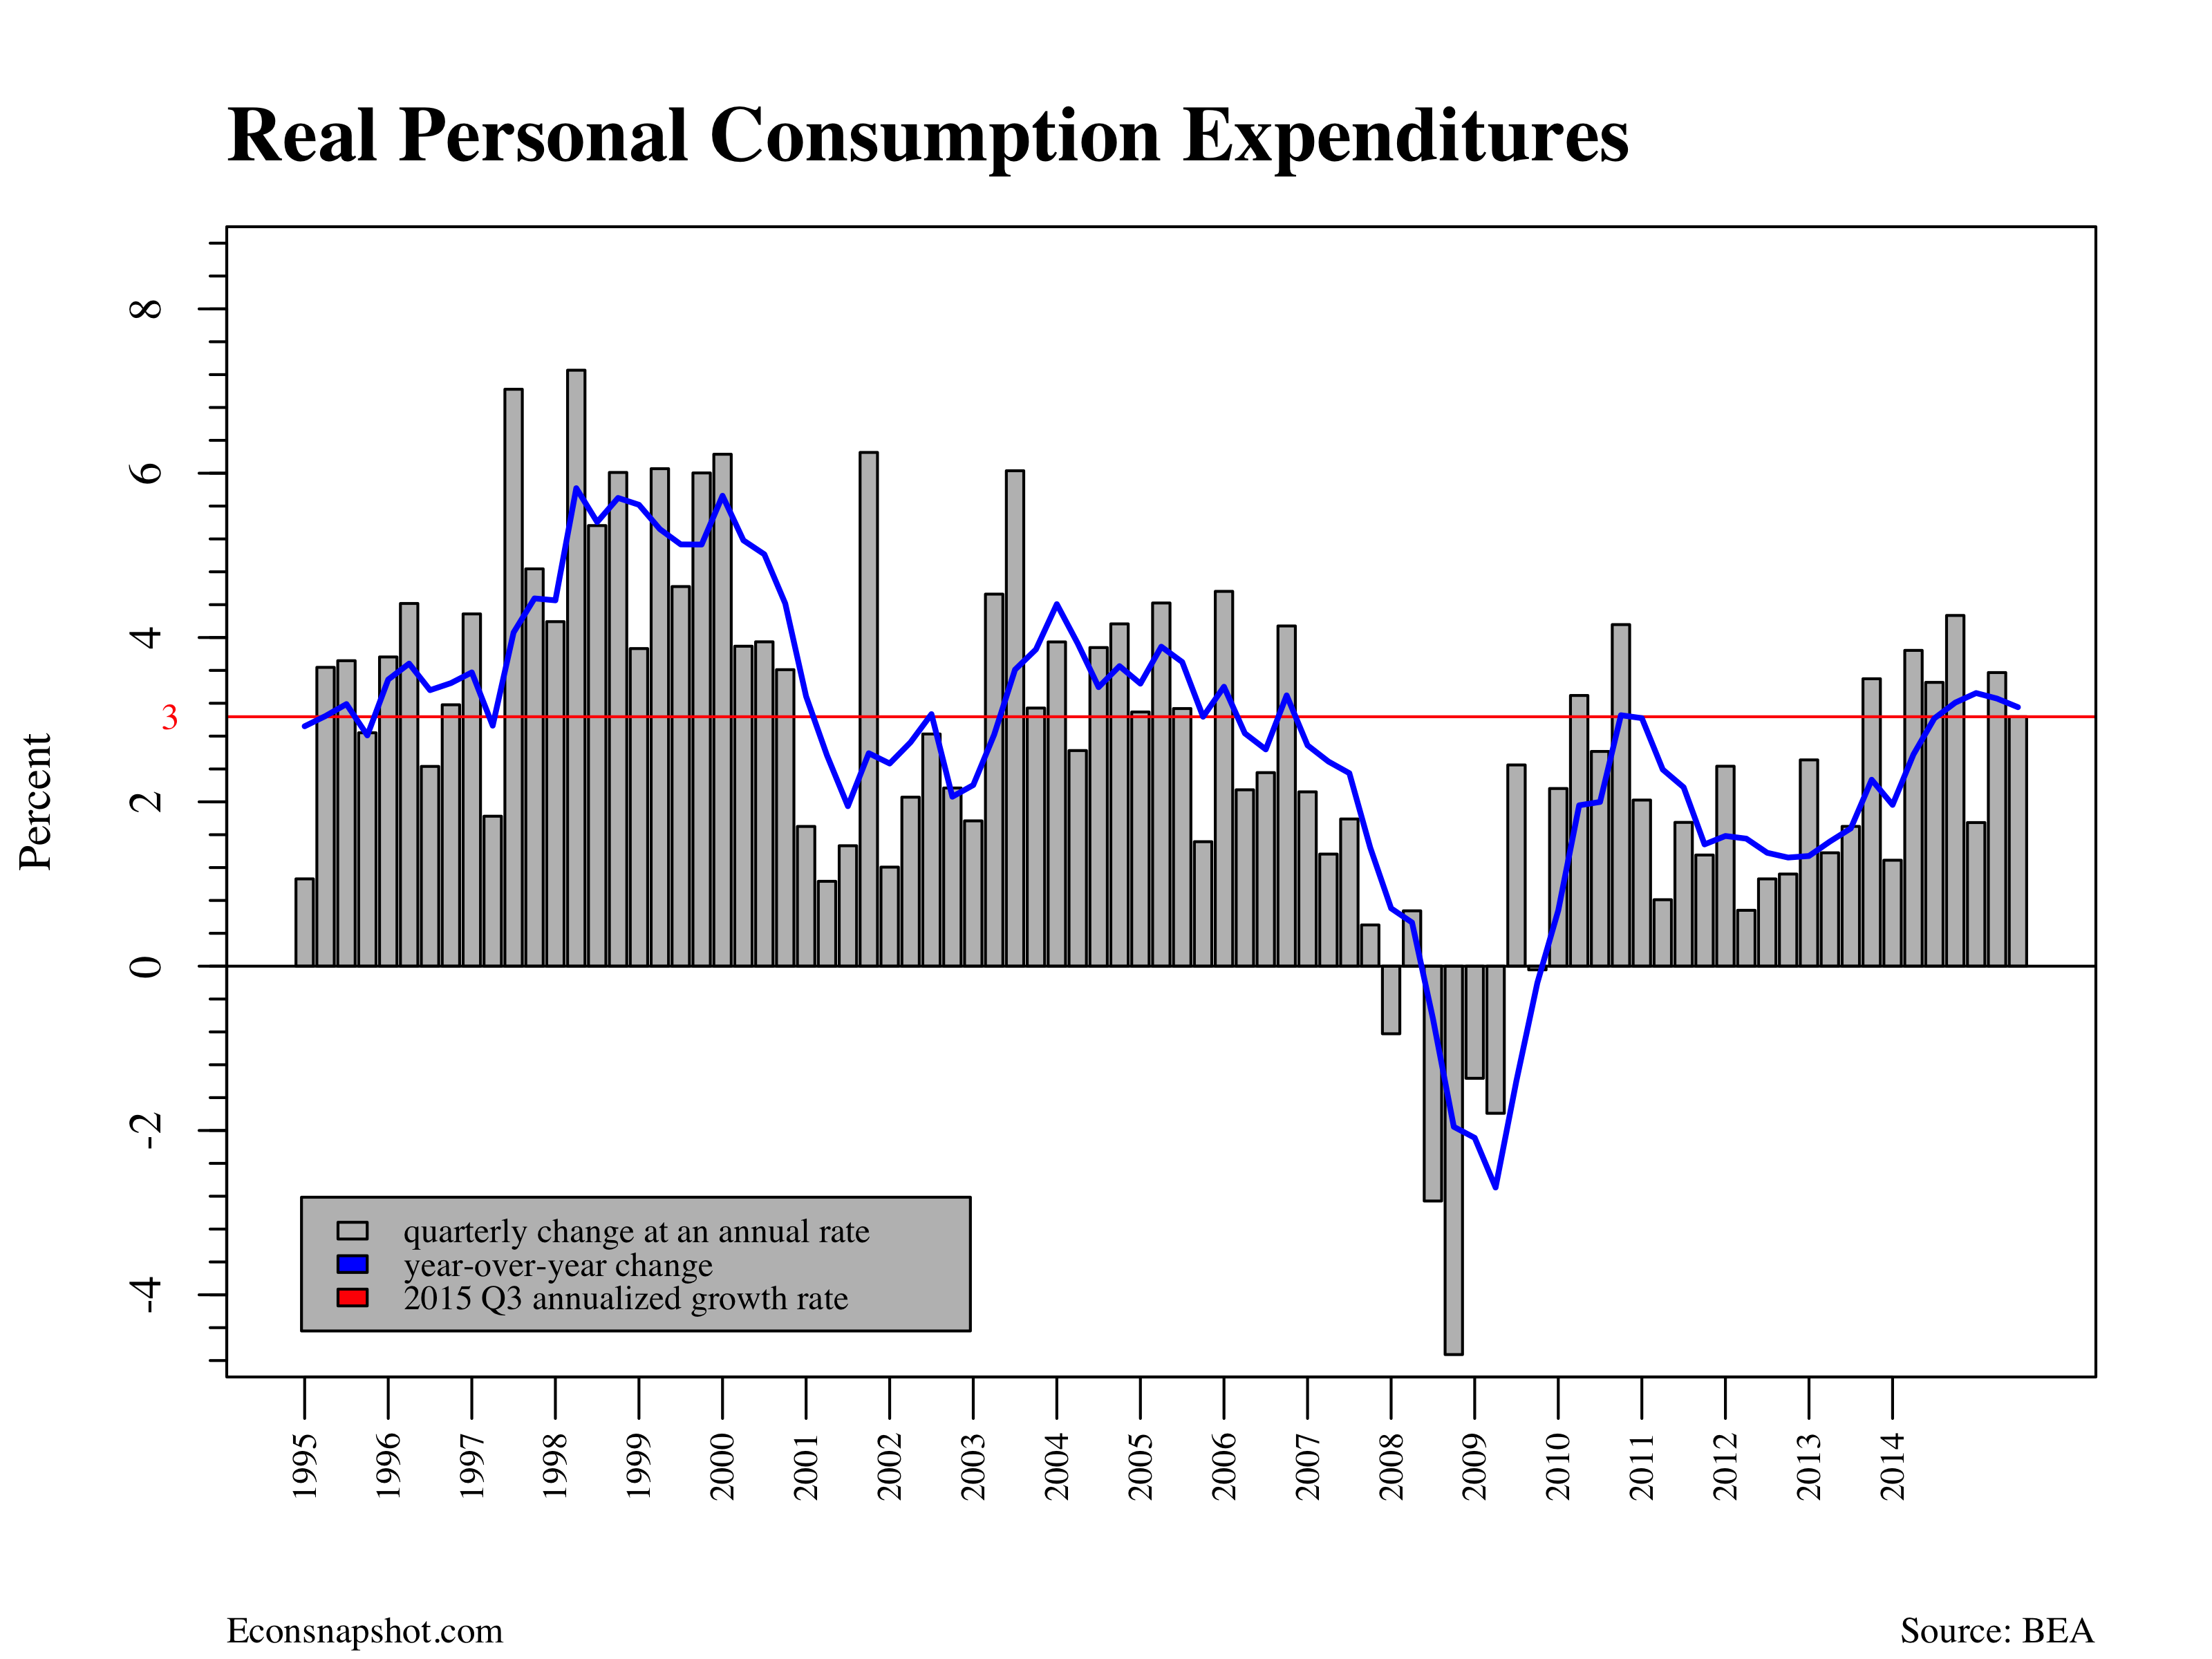
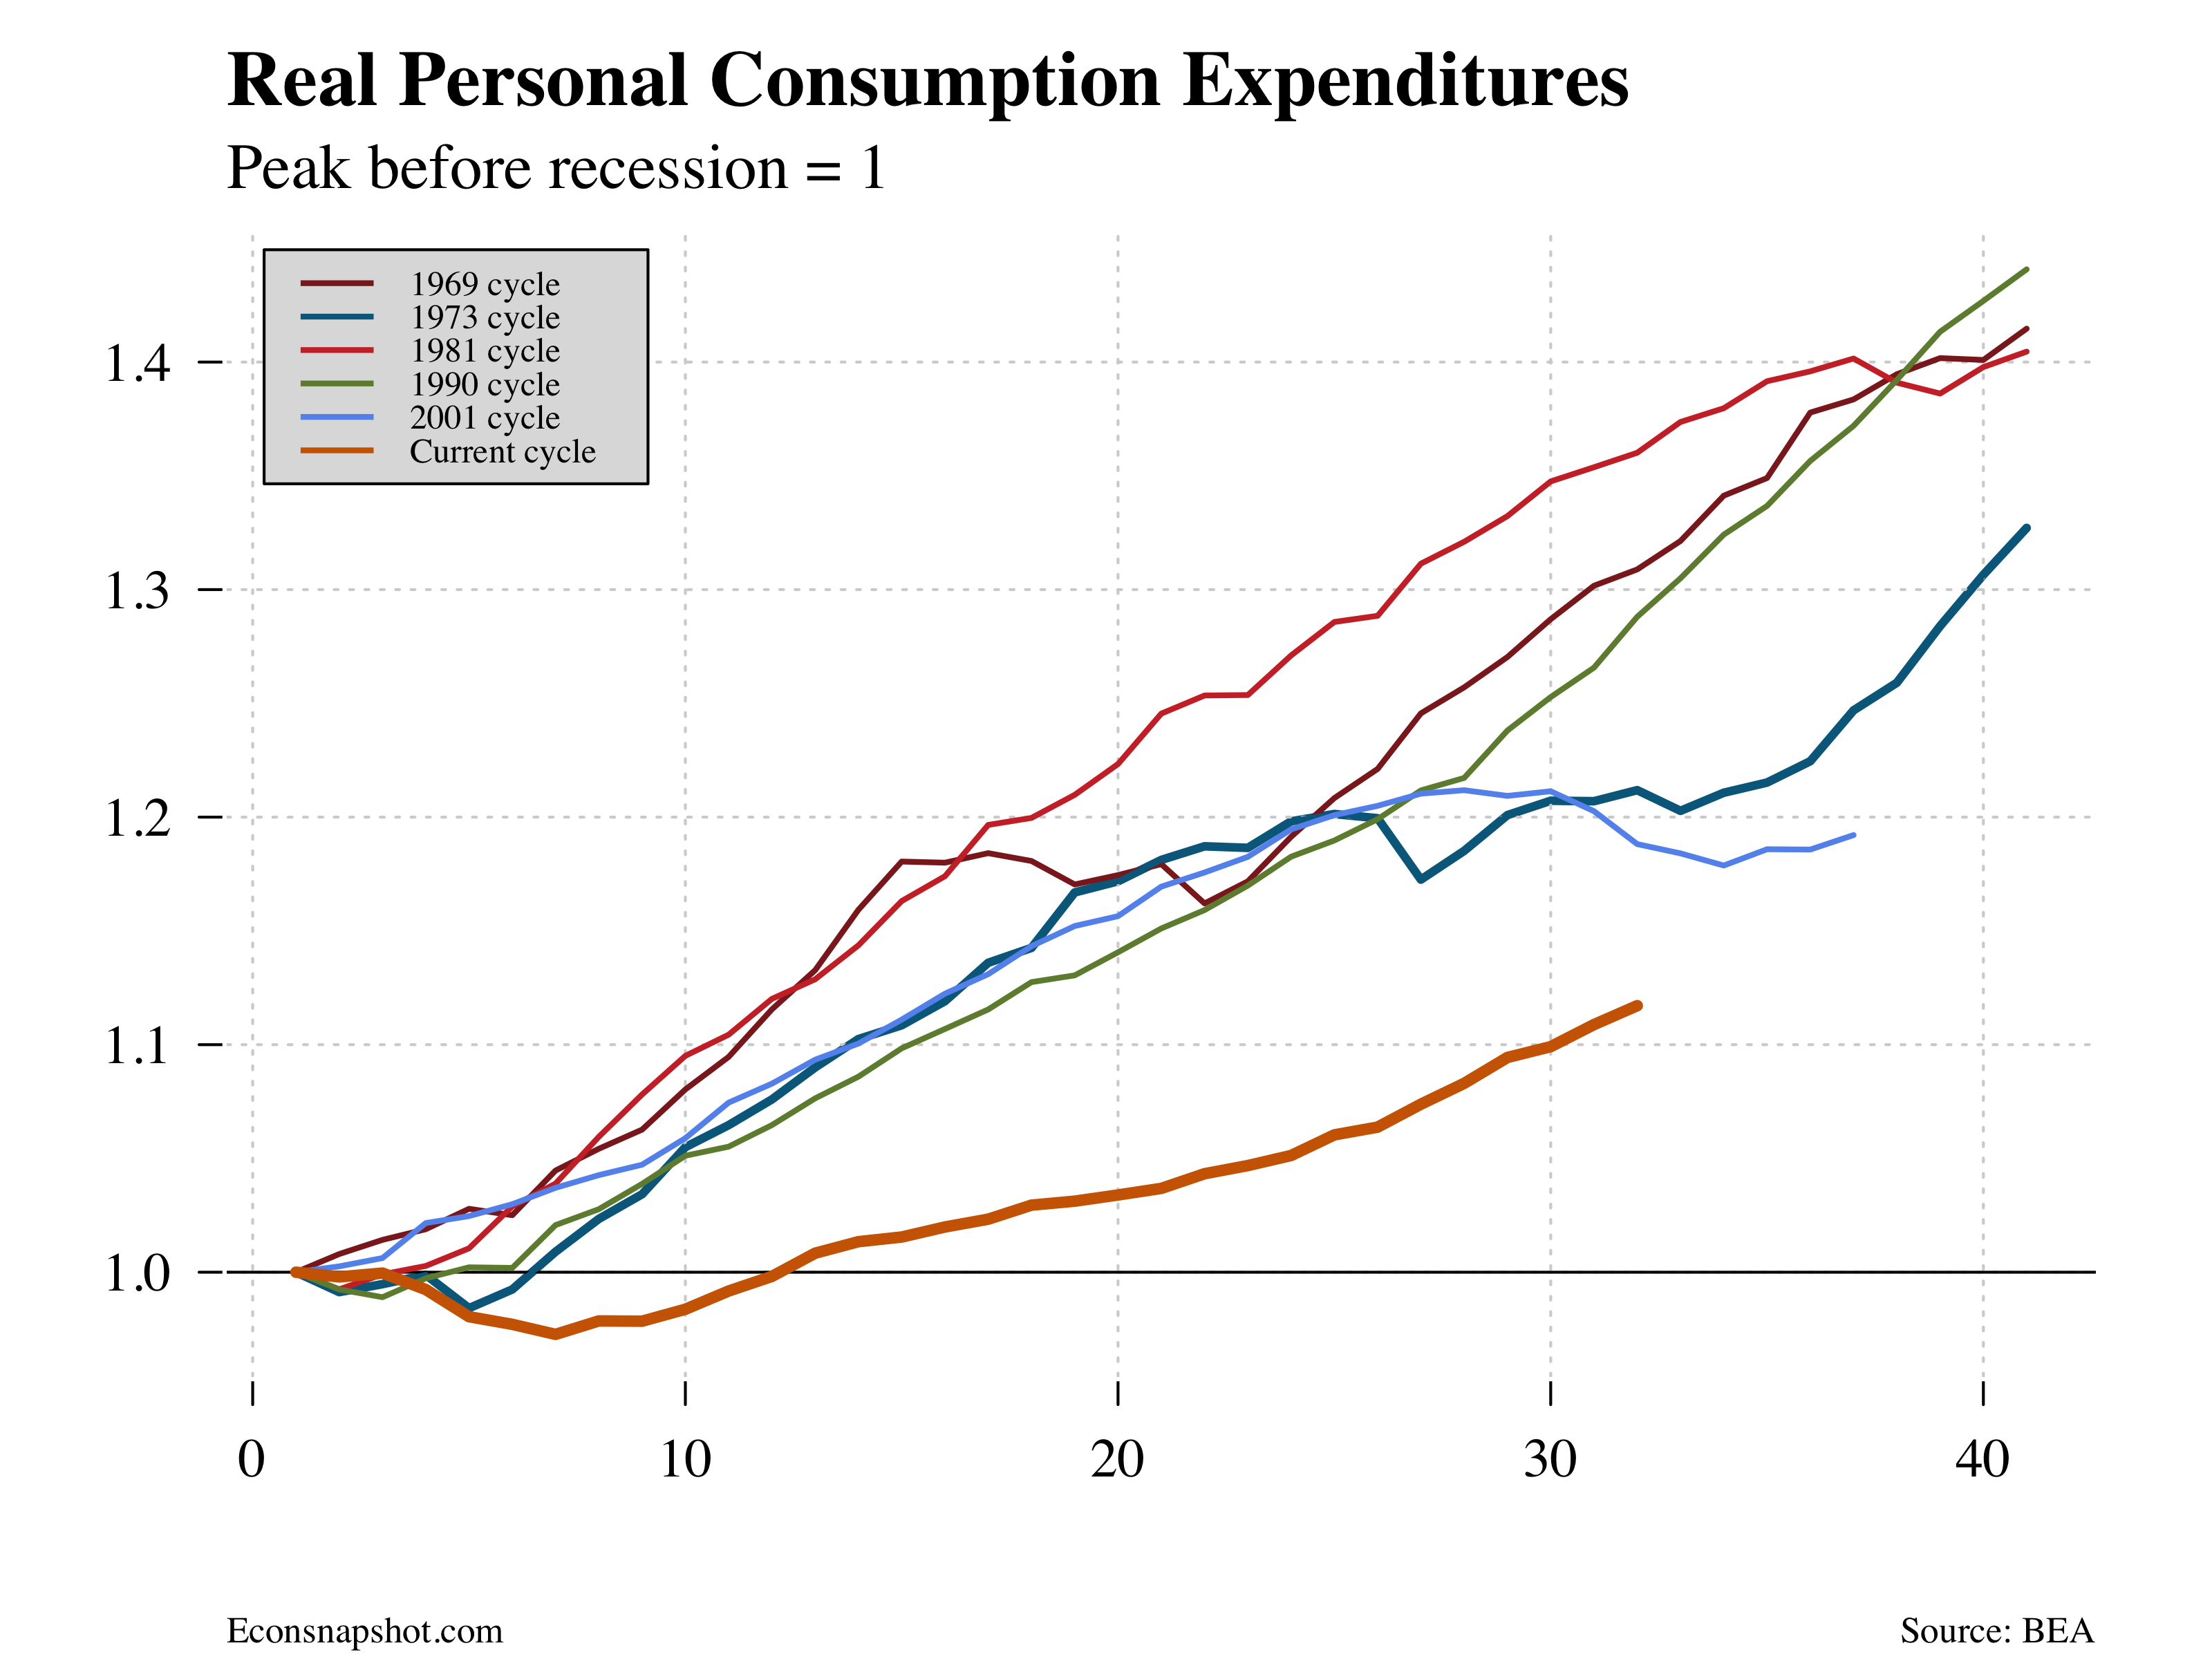
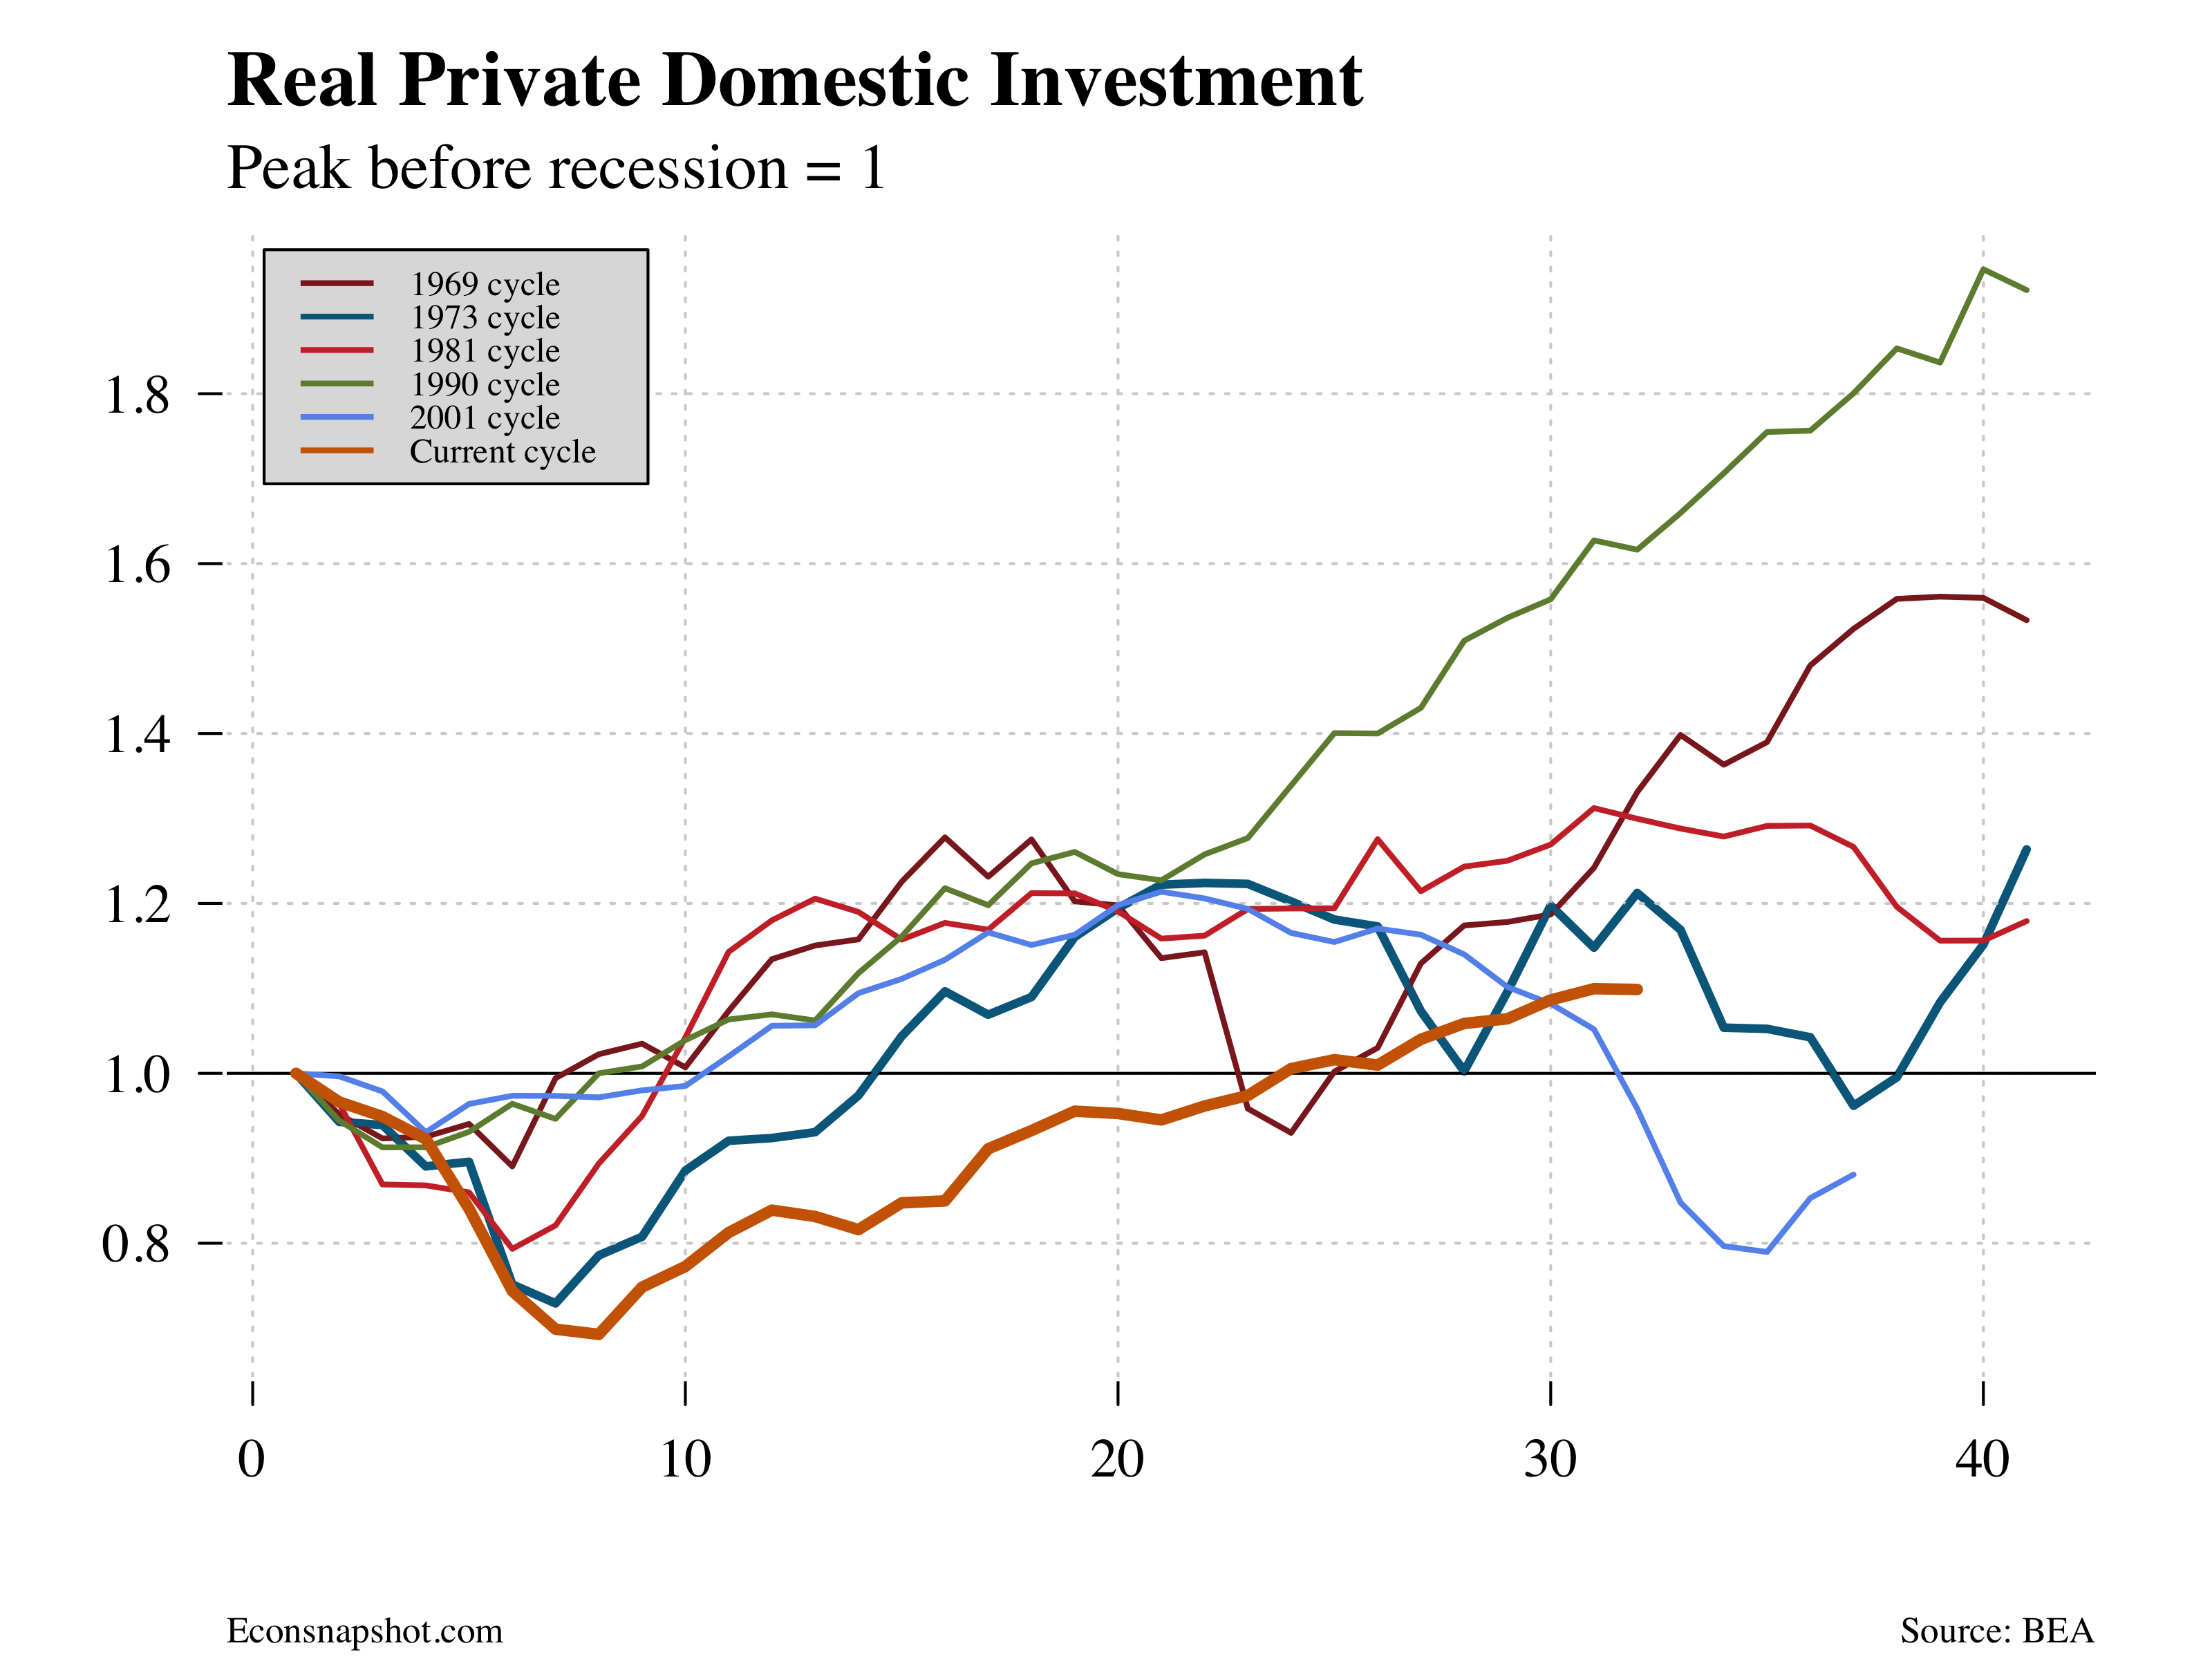
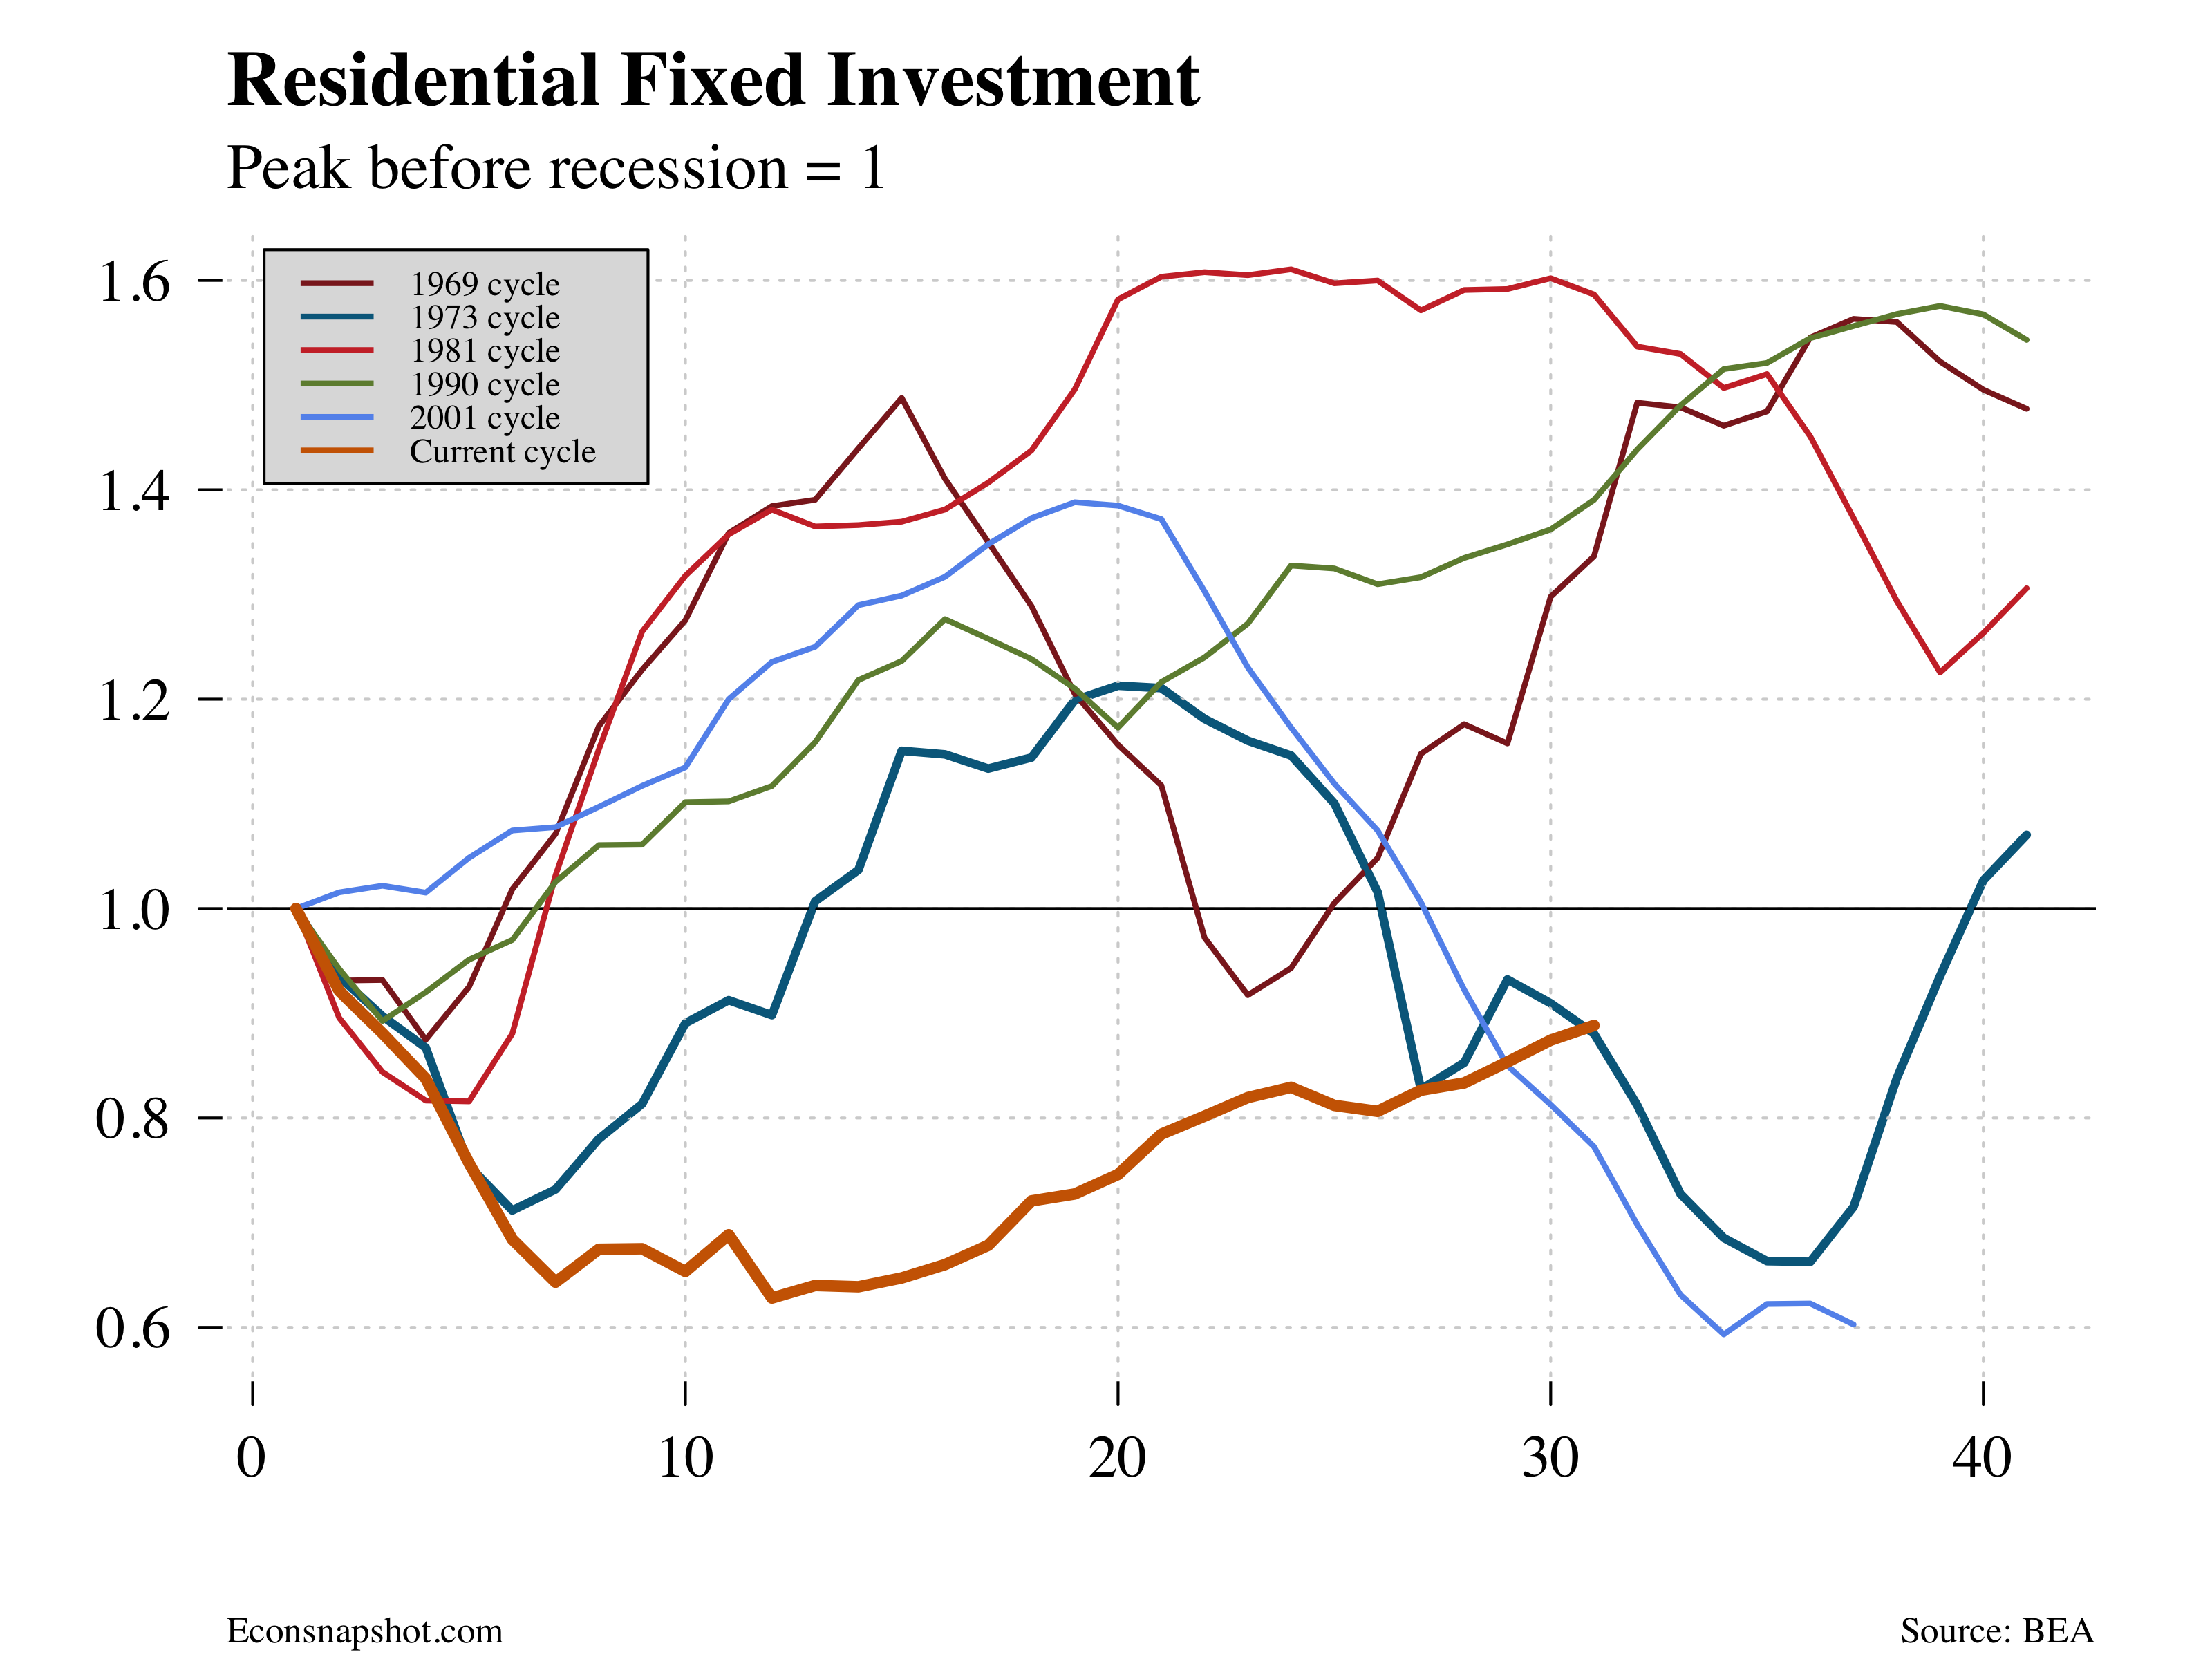
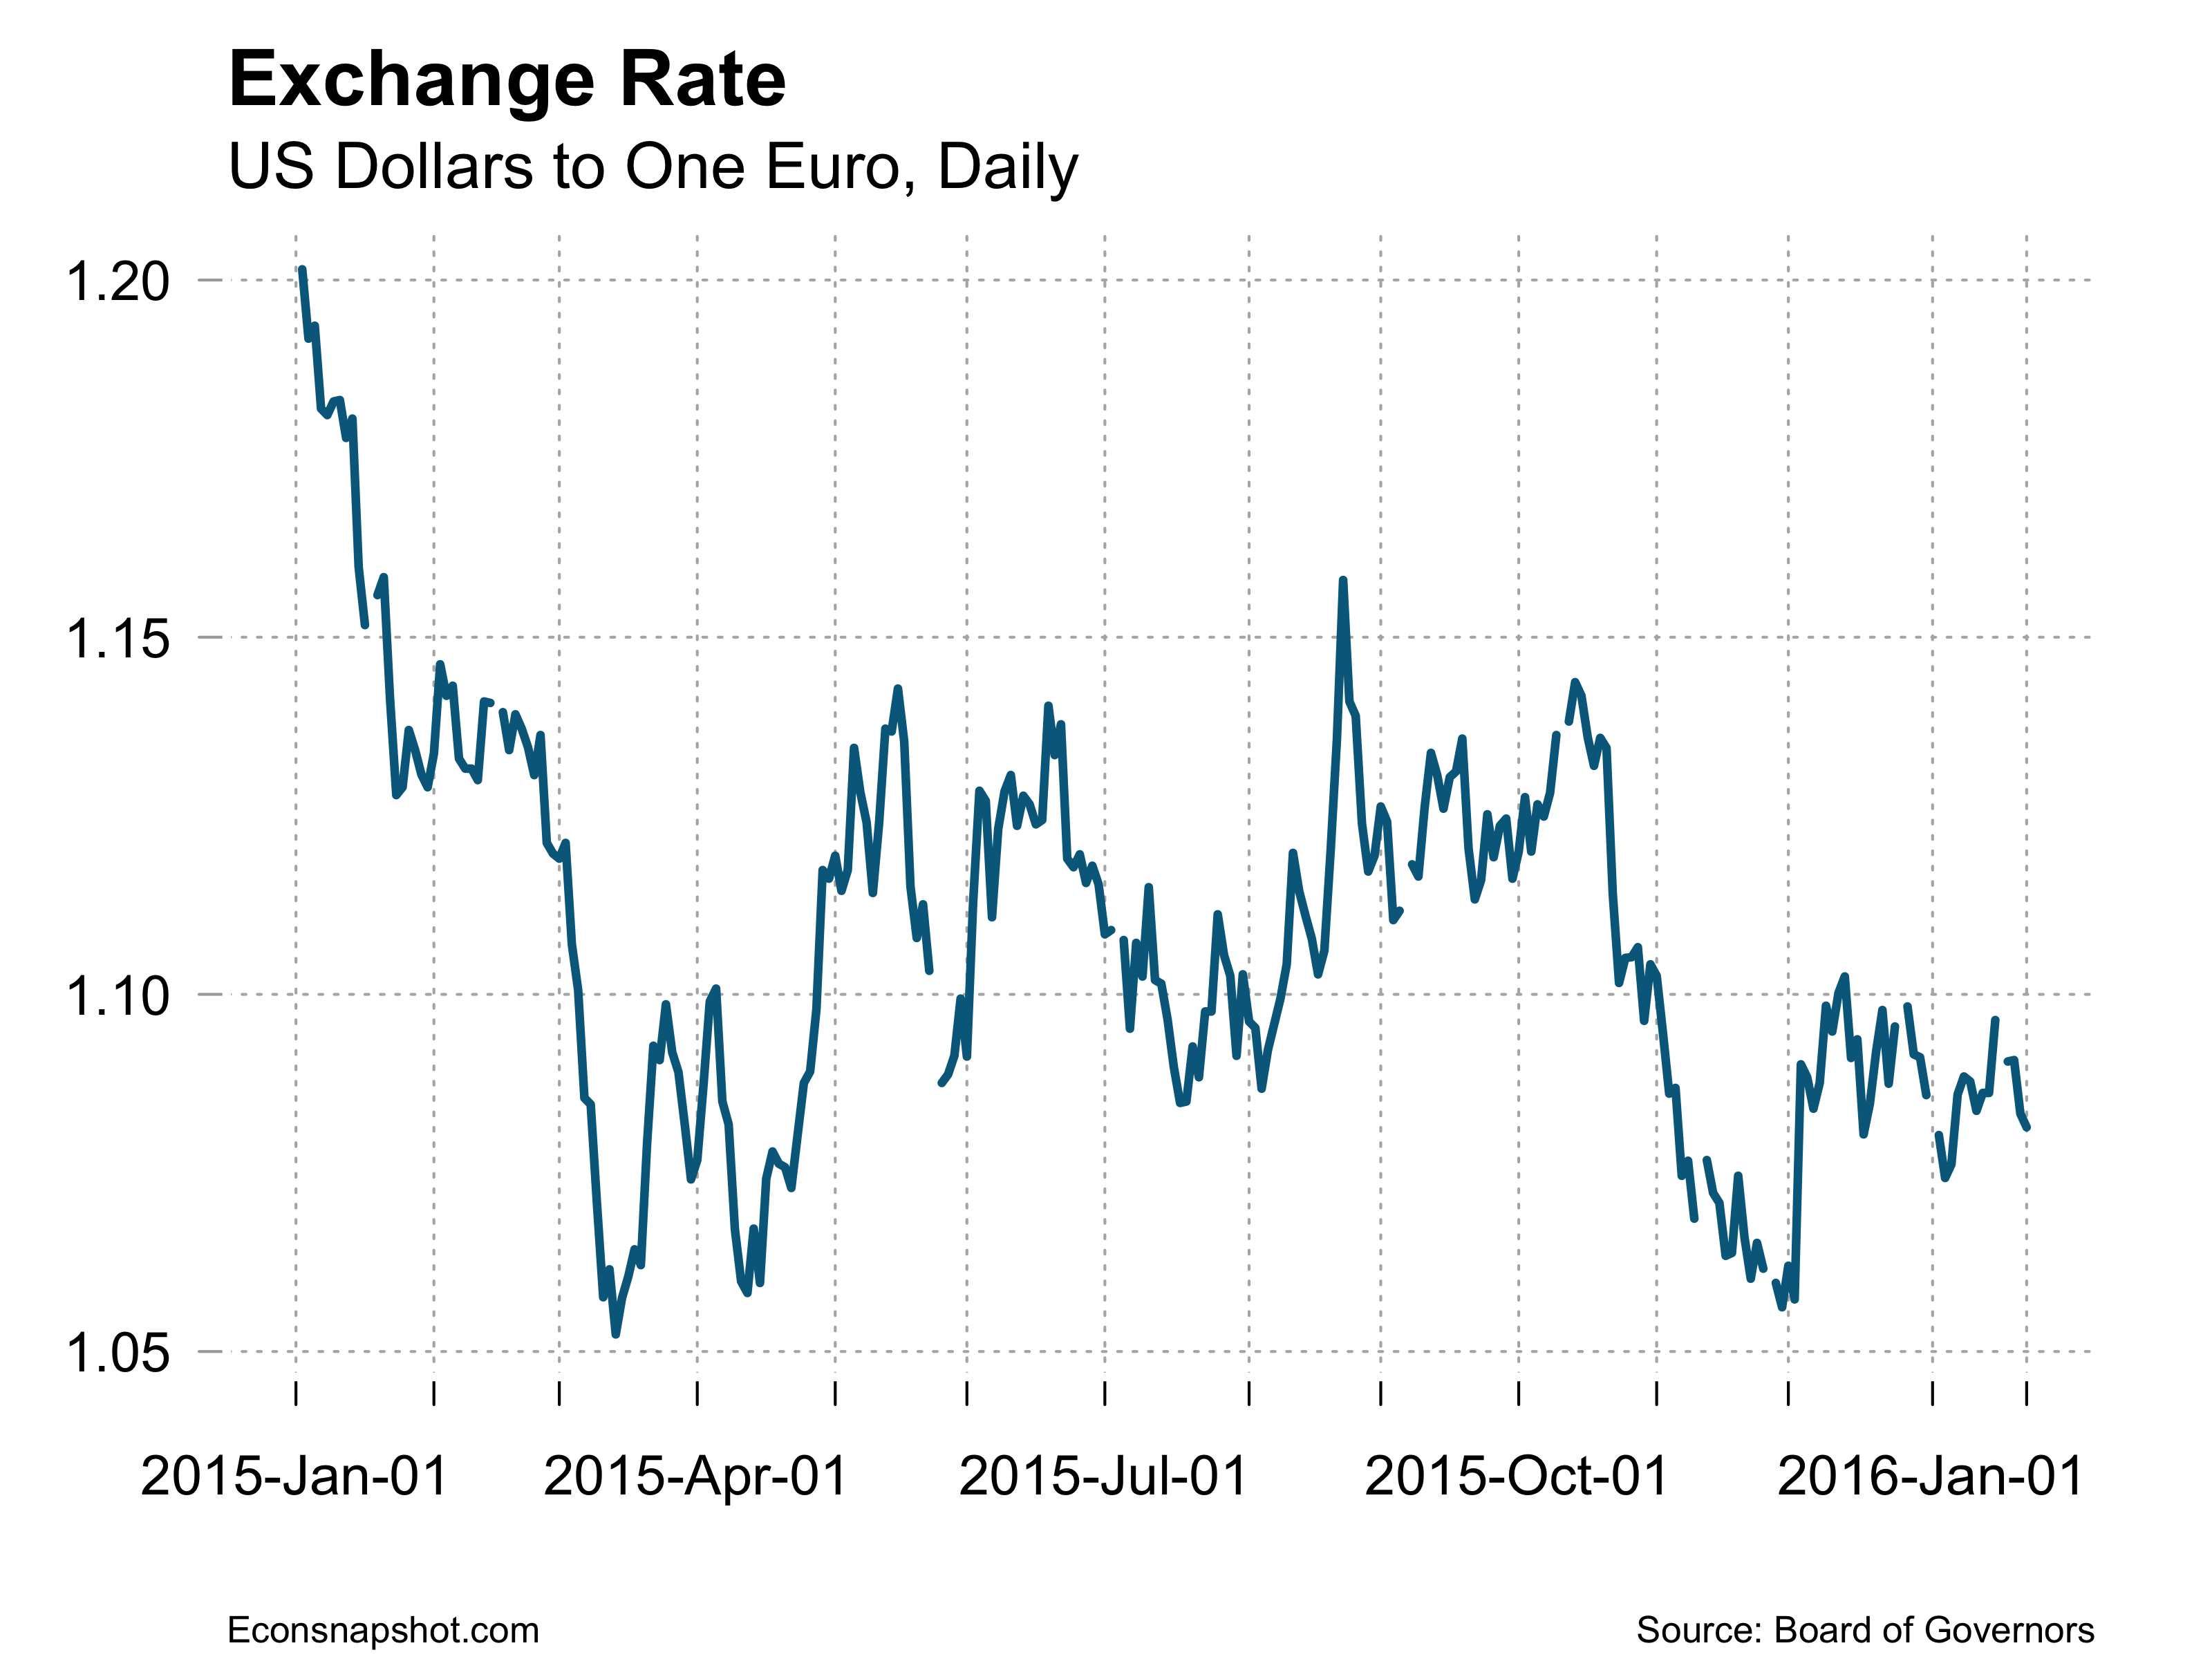
Exports have shown gradual flattening out and then more recently a decline precipitated by weak demand elsewhere in the world and a strong dollar. Expectations are that this will continue and continue to pull down U.S. growth. Consumption was also weaker in the fourth quarter after looking stronger earlier. PCE slowed to 2.2% after growing 3.6% and 3.0% in QII and QIII, respectively. Moreover, as the graph below shows, once PCE goes south it takes a while to reverse course. Investment in non-residential structures (-5.3%) and equipment (-2.5%) fell sharply, leading to an overall investment decline of -2.5%. Residential structures, however, grew at 8.1%.

Headwinds
The U.S. economy has always been an important driver for growth elsewhere in the world. As the first picture below shows the fate of the U.S. economy is closely aligned with the fate of nearest and most important trading partners, Mexico and the U.S. but in the age of globalization other trading partners – China, Europe Japan are very important as well. As you can see from the following charts, Europe and Japan are stagnant and the emerging markets, while not completely foundering, are likely not to lift others, particularly as China’s growth slows. These are serious concerns for the future strength of the U.S. recovery.


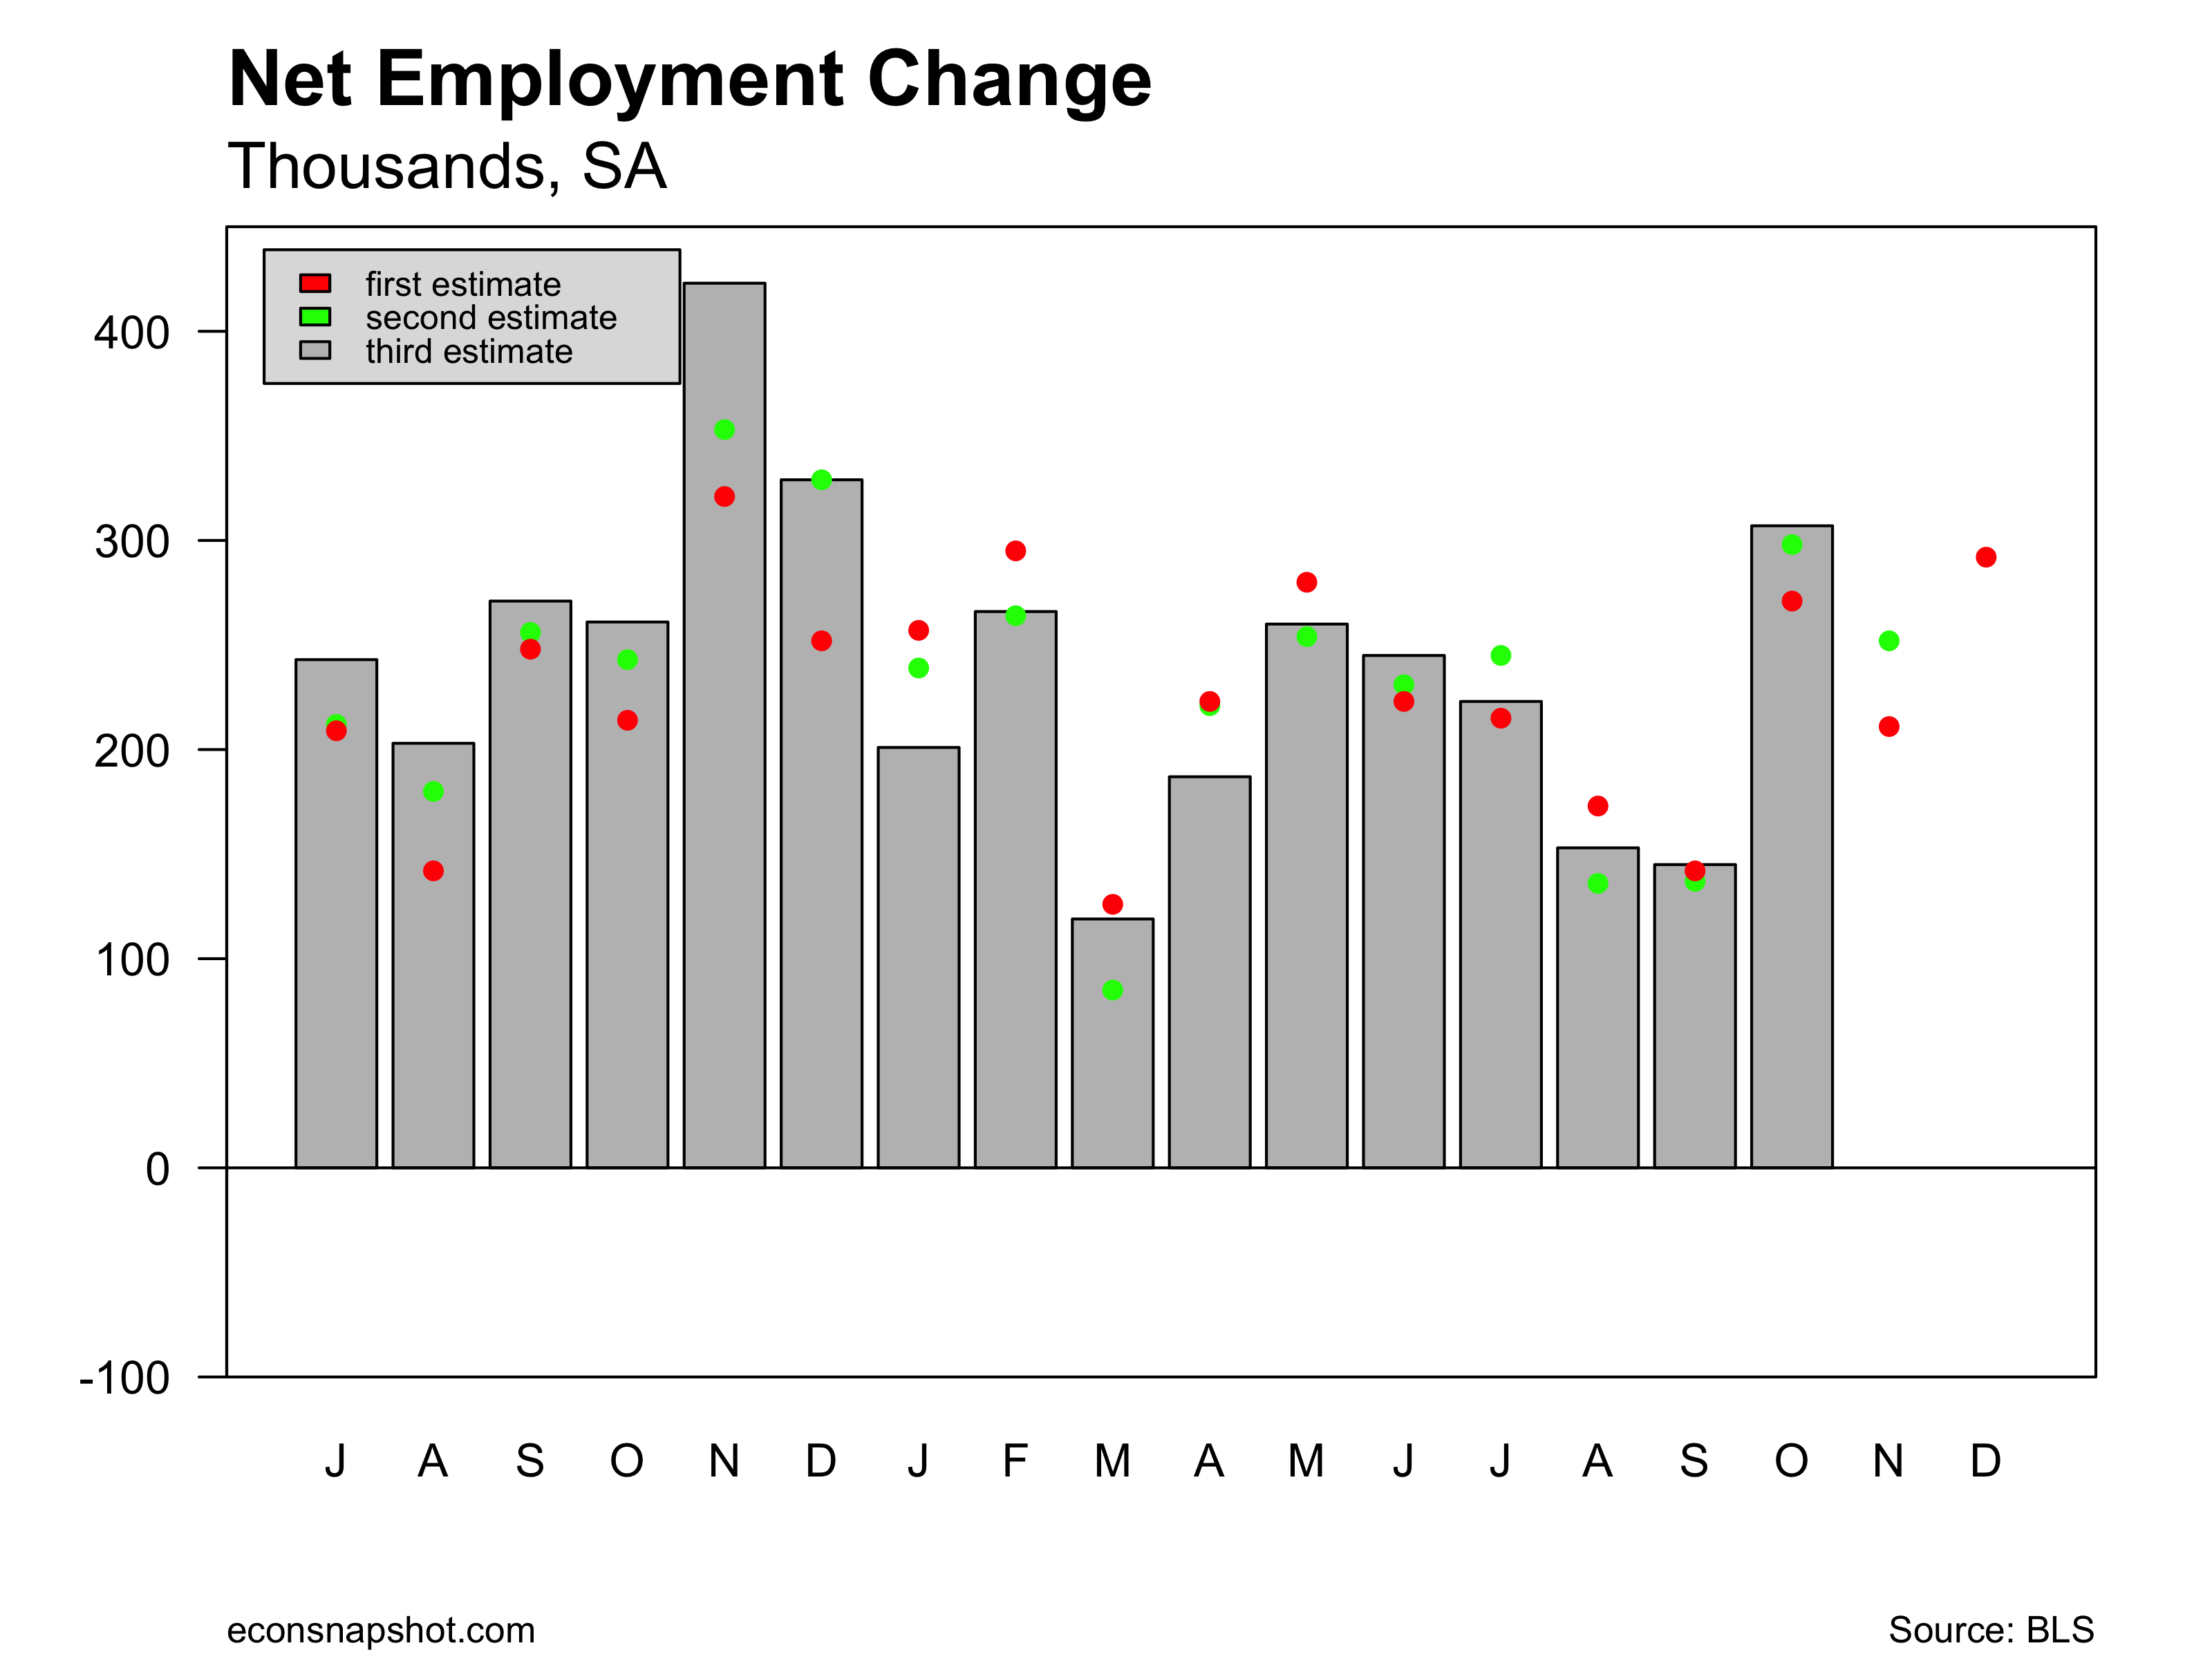

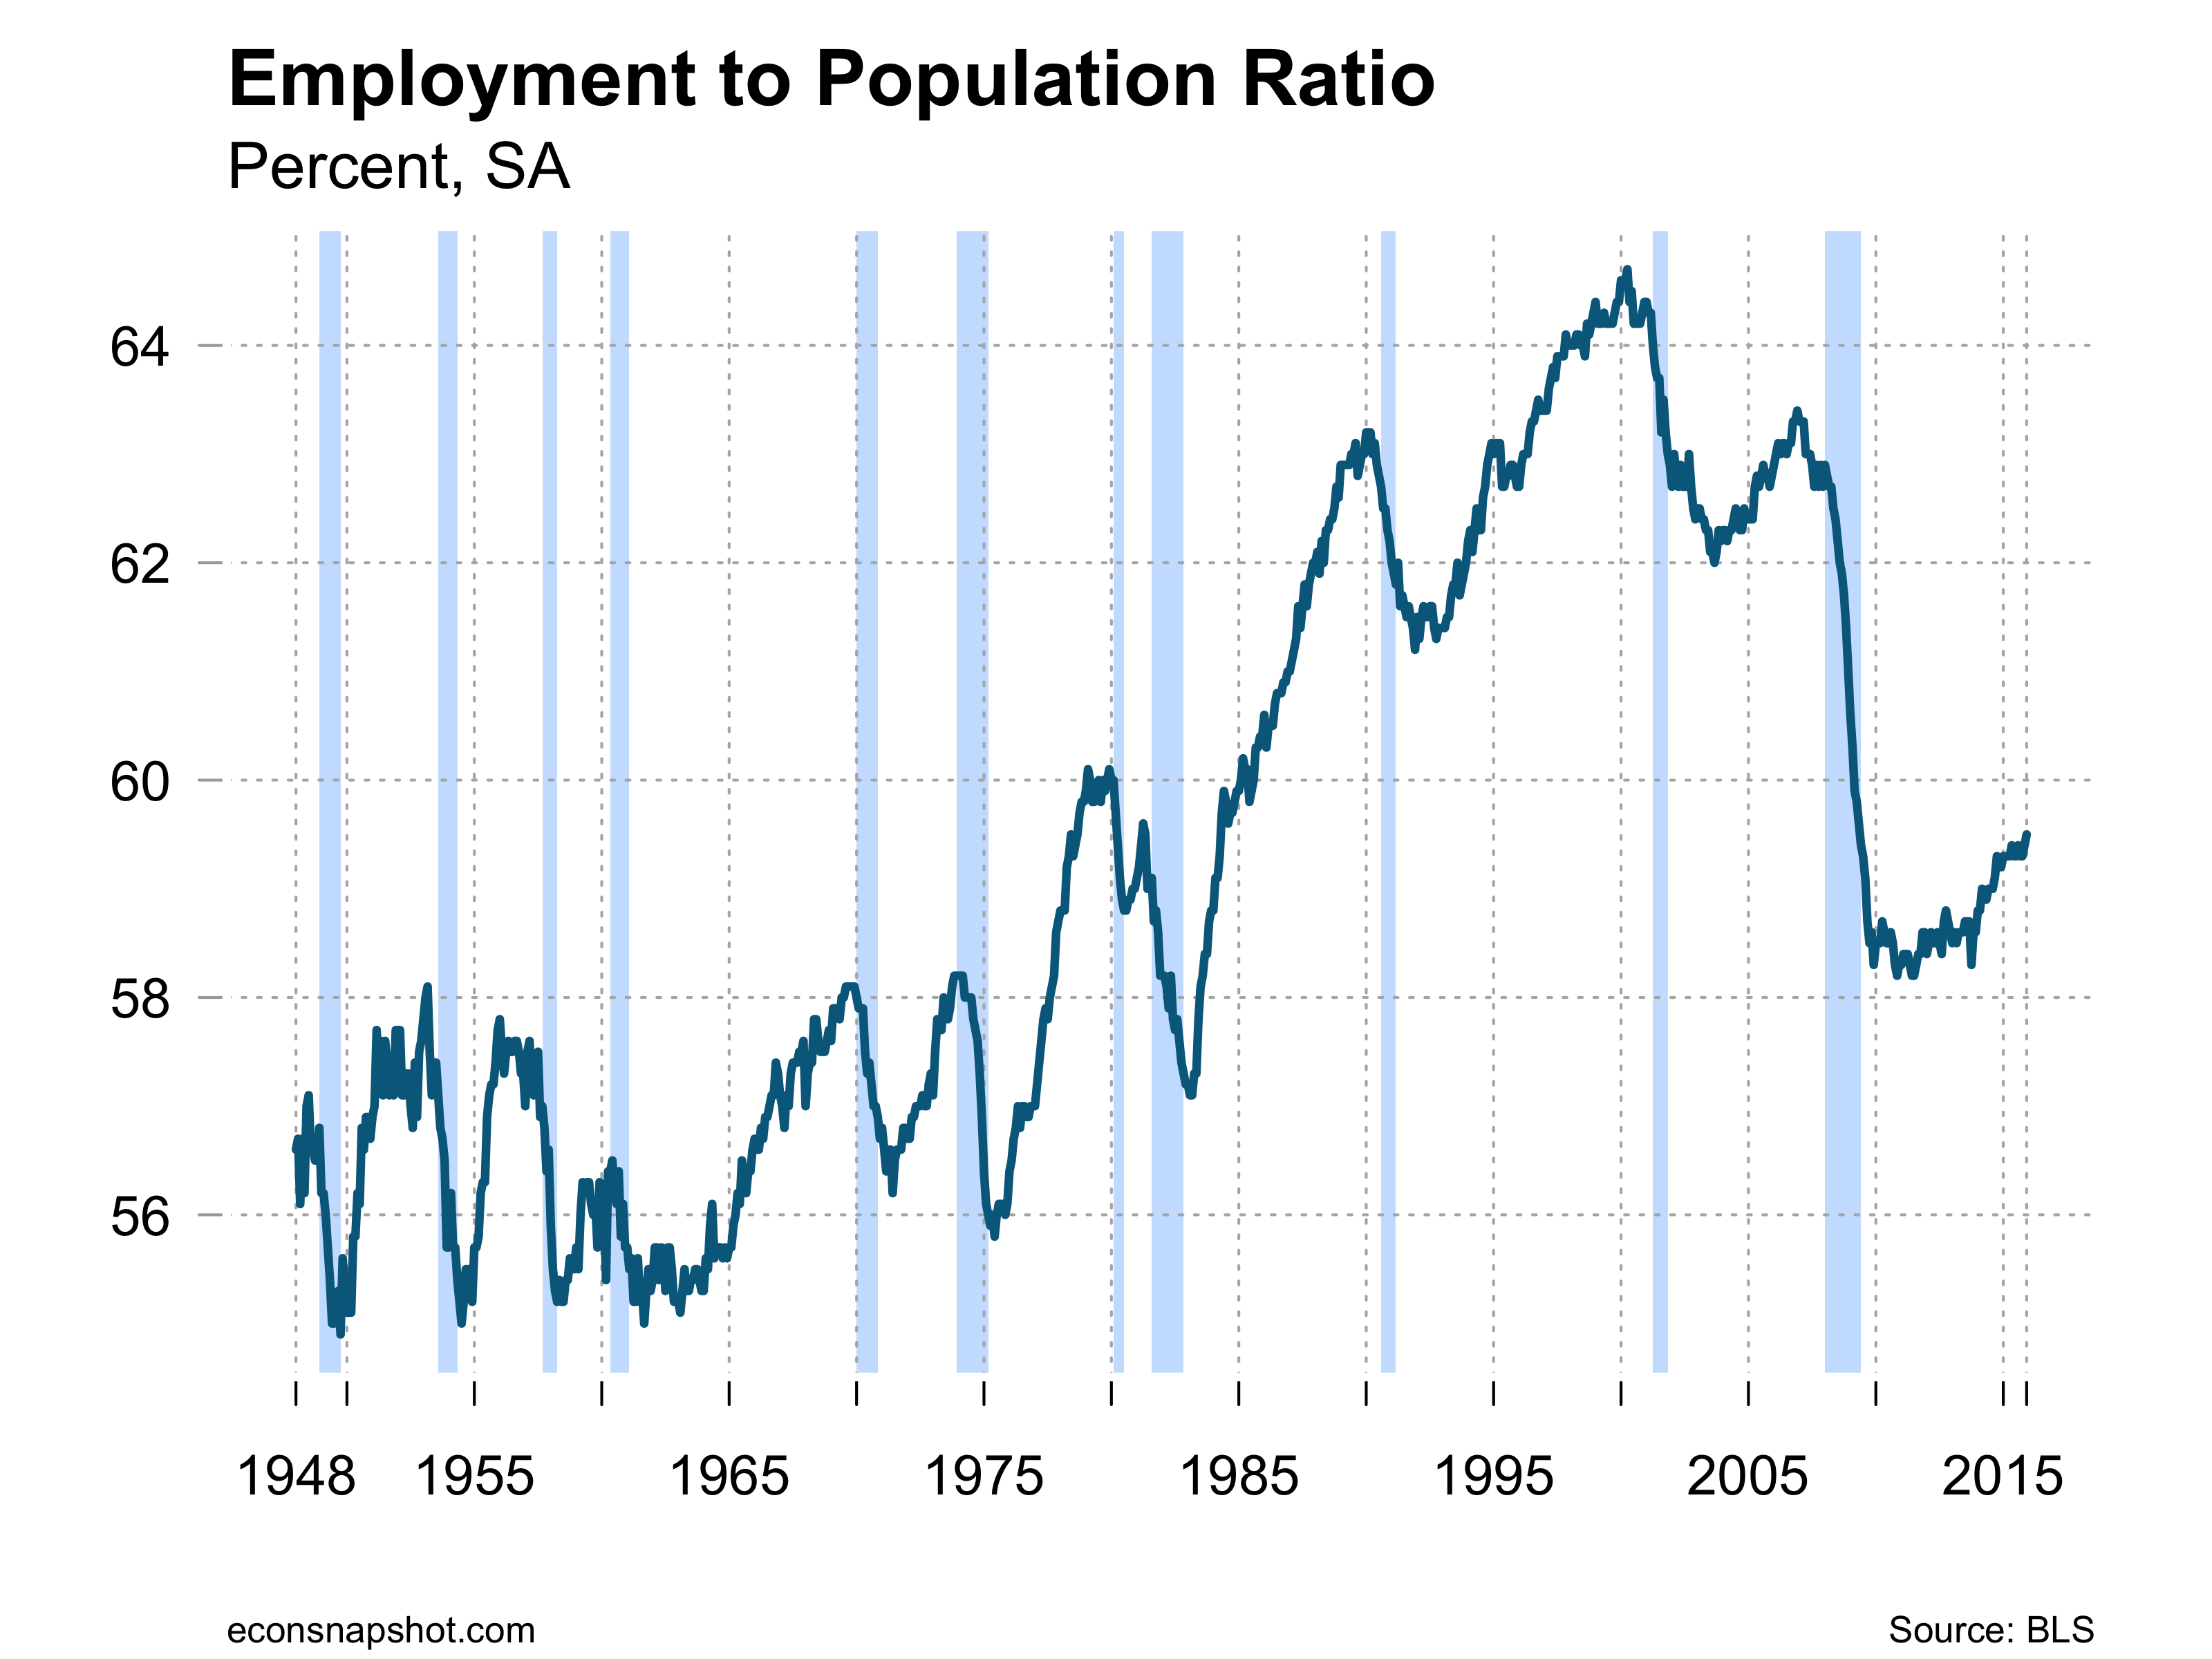


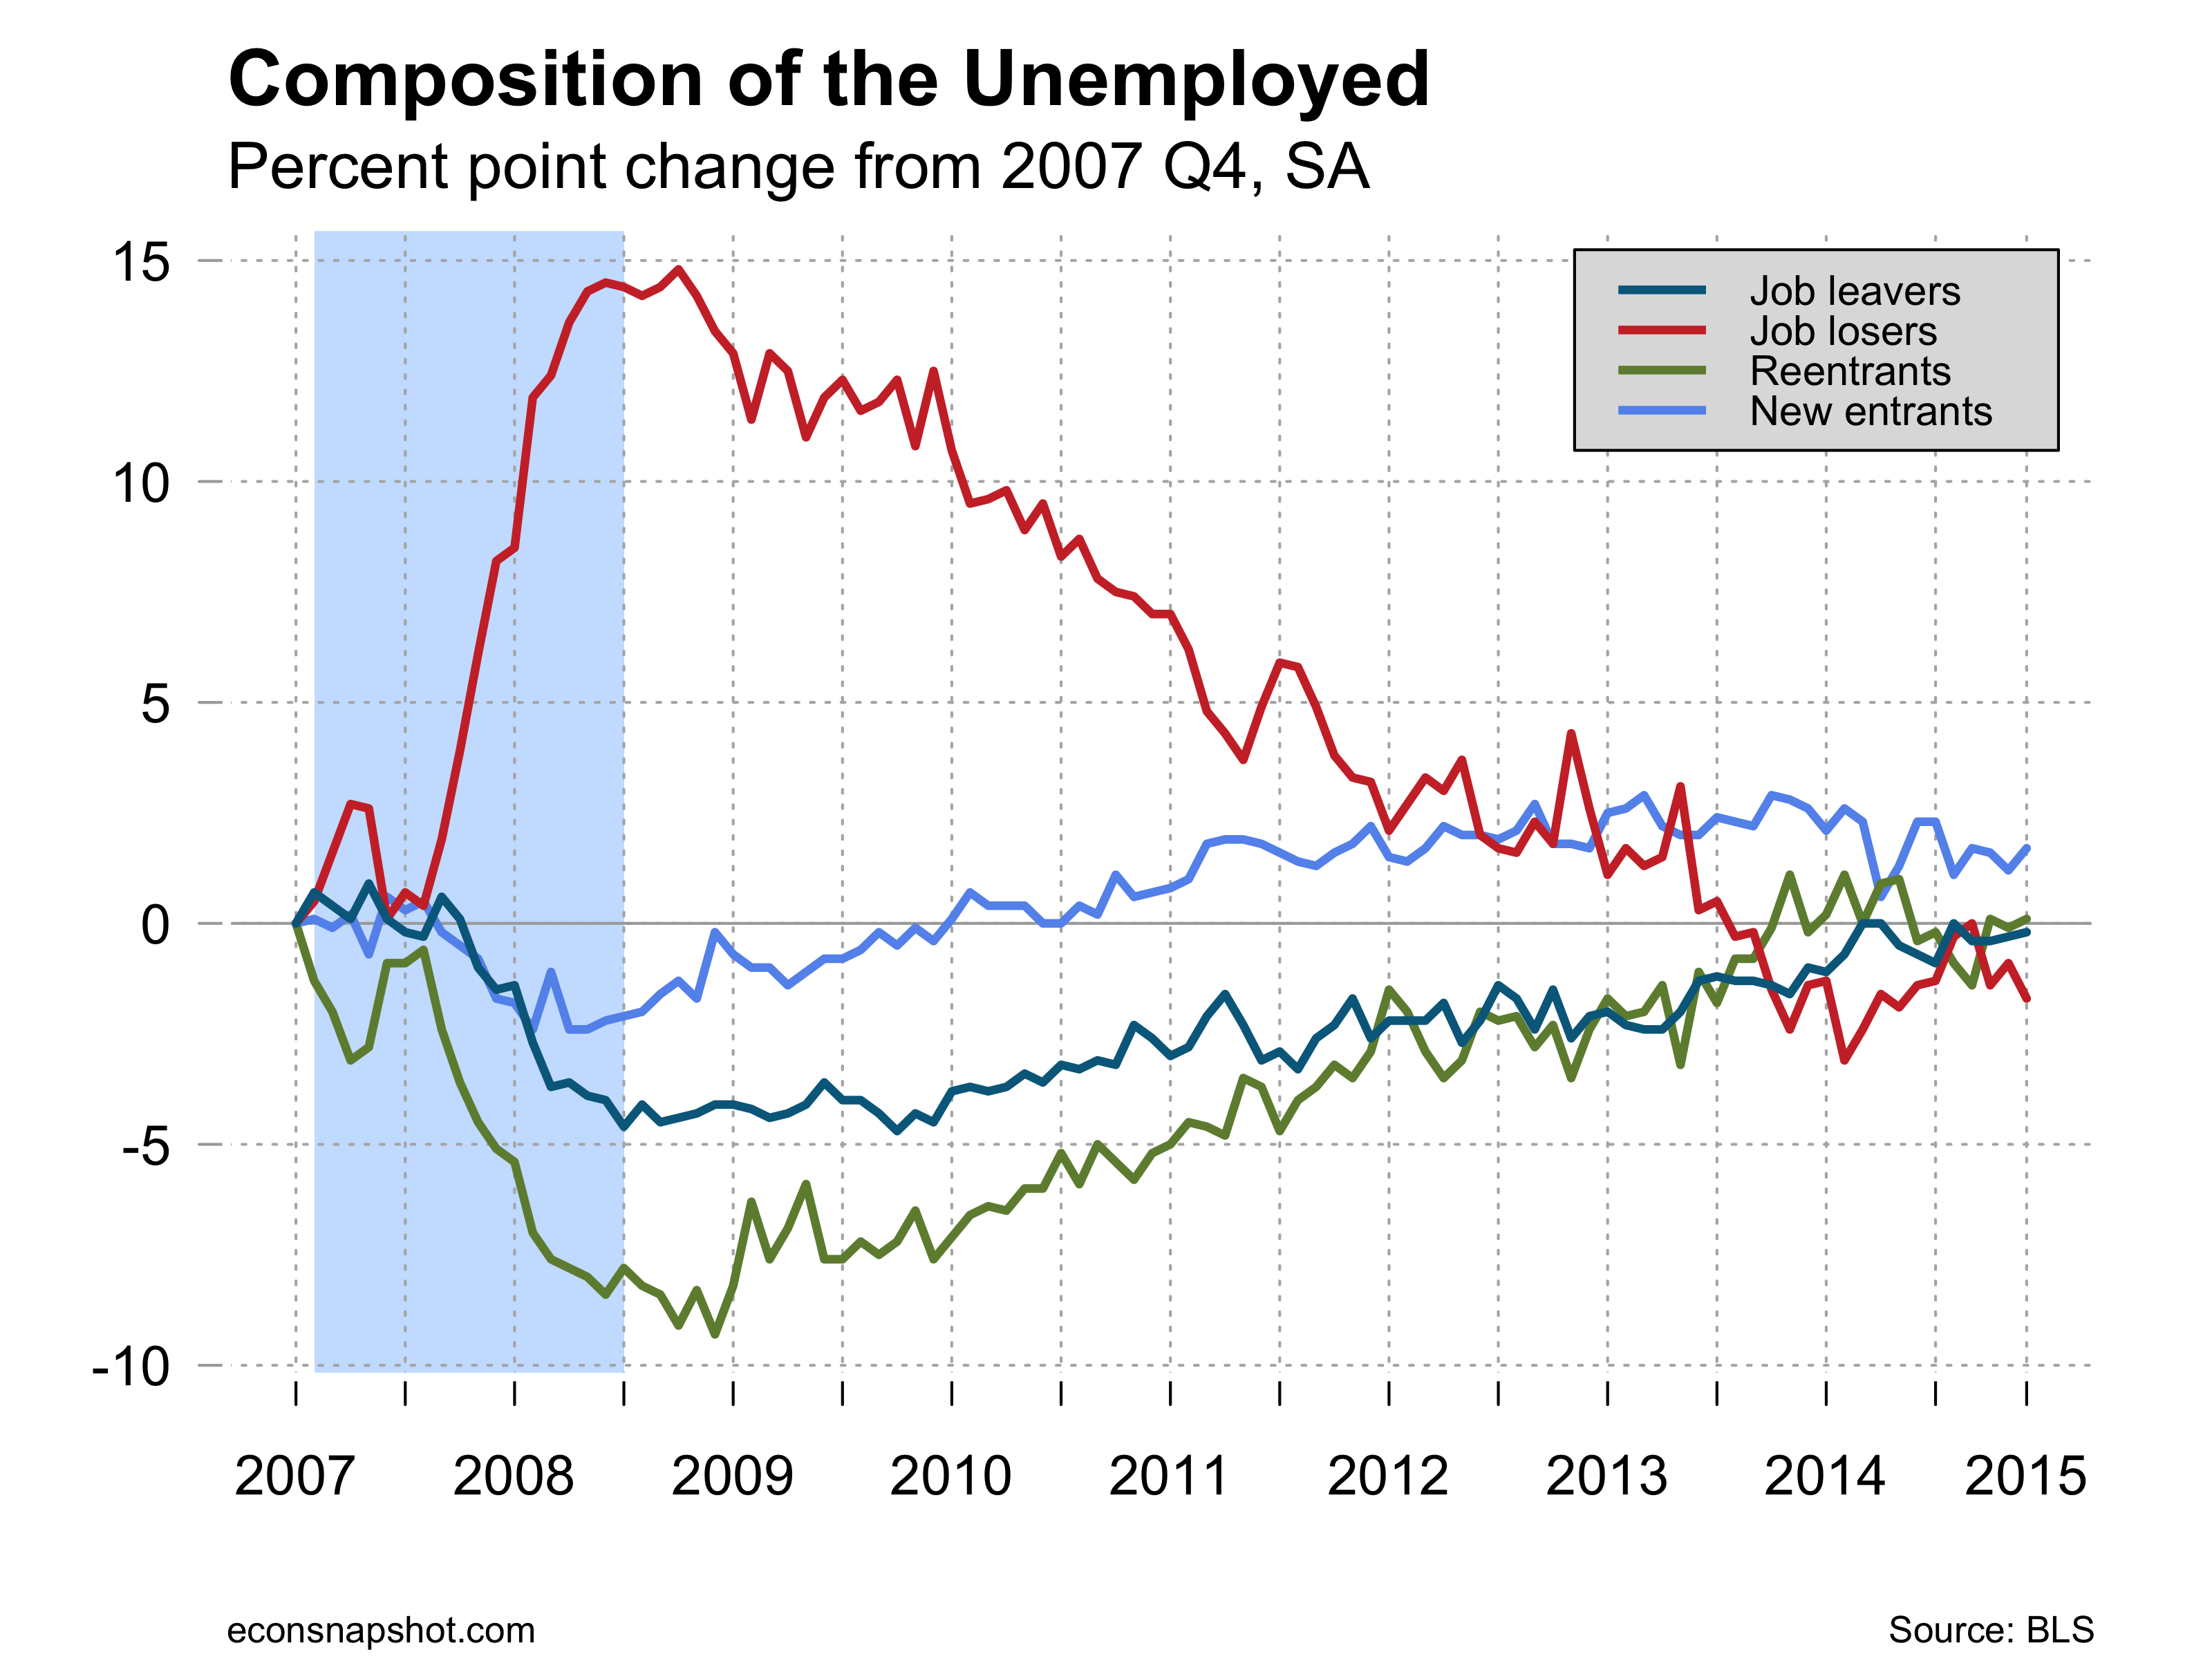
 The household survey