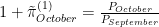
One of the challenges over the past couple of years has been measuring trend inflation. As shown in the figure below, monthly inflation rates are volatile; 12-month inflation rates are much smoother, but only slowly reflect changes in trend inflation. Previously, we’ve focused on the 3-month inflation rate.

As shown below, the 3-month inflation rate is approximately the average of three 1-month inflation rates. This means that each month, the 3-month inflation rate adds the current 1-month inflation rate, and drops the 1-month inflation rate from 4 months ago. Consequently, the 3-month inflation rate can drop precipitously if the inflation rate being dropped is relatively high.
A different way of putting the issue is that the calculation for the 3-month inflation rate assigns a weight of 1/3 to each of the past 3 months’ inflation rates, and a weight of 0 to inflation rates 4 or more months ago. Why such a discrete change in weights? Why not a more gradual decline in weights?
The remainder of this post gets into the guts of an alternative measure of trend inflation in which the weights on monthly inflation rates decline with their age. Readers uninterested in the details should feel free to jump to the end which presents our new measure of trend inflation.
The 3-month inflation rate as an average of 1-month inflation rates
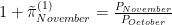
Consider the calculation of the gross 3-month (non-annualized) inflation rate for November,

where 


From the above, it follows that

The gross 3-month inflation rate is the product of the three immediate past 1-month inflation rates. Taking the natural logarithm,

we obtain

where the approximation arises from 

If we wish to work with annualized inflation rates, then

Again taking the natural logarithm, we obtain
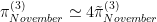
The 1-month inflation rates will have “12” in the place of “4”. We now have
![\pi^{(3)}_{November} \simeq \frac{1}{3} \left[\pi^{(1)}_{September} + \pi^{(1)}_{October} + \pi^{(1)}_{November}\right]](https://s0.wp.com/latex.php?latex=%5Cpi%5E%7B%283%29%7D_%7BNovember%7D+%5Csimeq+%5Cfrac%7B1%7D%7B3%7D+%5Cleft%5B%5Cpi%5E%7B%281%29%7D_%7BSeptember%7D+%2B+%5Cpi%5E%7B%281%29%7D_%7BOctober%7D+%2B+%5Cpi%5E%7B%281%29%7D_%7BNovember%7D%5Cright%5D&bg=ffffff&fg=000&s=0&c=20201002)
In other words, the 3-month annualized inflation rate for November is (approximately) the average of the three 1-month annualized inflation rates.
A related problem: computing an average
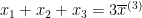
Given 3 observations on some variable, the sample average or mean is
![\overline x^{(3)} = \frac{1}{3} \left[x_{1} + x_{2} + x_{3}\right]](https://s0.wp.com/latex.php?latex=%5Coverline+x%5E%7B%283%29%7D+%3D+%5Cfrac%7B1%7D%7B3%7D+%5Cleft%5Bx_%7B1%7D+%2B+x_%7B2%7D+%2B+x_%7B3%7D%5Cright%5D&bg=ffffff&fg=000&s=0&c=20201002)
Now, if we add a fourth observation,
![\overline x^{(4)} = \frac{1}{4} \left[x_{1} + x_{2} + x_{3} + x_{4}\right]](https://s0.wp.com/latex.php?latex=%5Coverline+x%5E%7B%284%29%7D+%3D+%5Cfrac%7B1%7D%7B4%7D+%5Cleft%5Bx_%7B1%7D+%2B+x_%7B2%7D+%2B+x_%7B3%7D+%2B+x_%7B4%7D%5Cright%5D&bg=ffffff&fg=000&s=0&c=20201002)
However, computing 


Substituting into the formula for
![\overline x^{(4)} = \frac{1}{4} \left[ 3 \overline x^{(3)} + x_{4} \right]](https://s0.wp.com/latex.php?latex=%5Coverline+x%5E%7B%284%29%7D+%3D+%5Cfrac%7B1%7D%7B4%7D+%5Cleft%5B+3+%5Coverline+x%5E%7B%283%29%7D+%2B+x_%7B4%7D+%5Cright%5D&bg=ffffff&fg=000&s=0&c=20201002)
or,

This leads to a well-known formula for recursively computing an average:
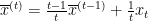
where t is the number of observations. It says that the mean at date t is a weighted average of the previous mean, and the current (date t) observation.
This is all well and good if the population average is constant. But what if the population average changes periodically. If we knew when these changes in population average occur, we would simply discard all the old observations, and start computing the average afresh. When we don’t know when changes in the population average occur, an alternative approach is to apply a constant “gain” or weight to new observations:

where 
Application: Trend inflation
The discussion above suggests measuring trend inflation via
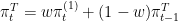
In words: trend inflation is a weighted average of the current one-month inflation rate (with weight w), and the previous trend inflation rate (with weight 1-w). Solving this equation backwards gives

That is to say, the measure of trend inflation at t is a weighted average of all past inflation rates, and that the weights decline geometrically with time. Put differently, there is a smooth drop off in the importance attached to previous inflation rates. By way of example, for w=1/3, the weight associated with the current inflation rate is 1/3 = 0.333; with the previous month’s inflation rate, 2/9 = 0.222; with the inflation rate 2 months ago, 4/27 = 0.148; and with inflation 12 months ago, roughly 0.00257 — very small.
Our new measure of trend inflation
The figure below plots our `constant-gain’ measure of trend core PCE inflation for a weight of 1/3 on the latest observation, along with the monthly, 3-month, and annual inflation rates. Relative to the 3-month inflation rate, this measure of trend inflation is somewhat smoother while still responding in a timely fashion to apparent changes in trend inflation.
