by Zach Bethune, Tom Cooley, and Peter Rupert
Today’s second estimate of Q1 GDP issued by the BEA reveals a downward revision of nearly one percentage point, from 0.2% to -0.7.
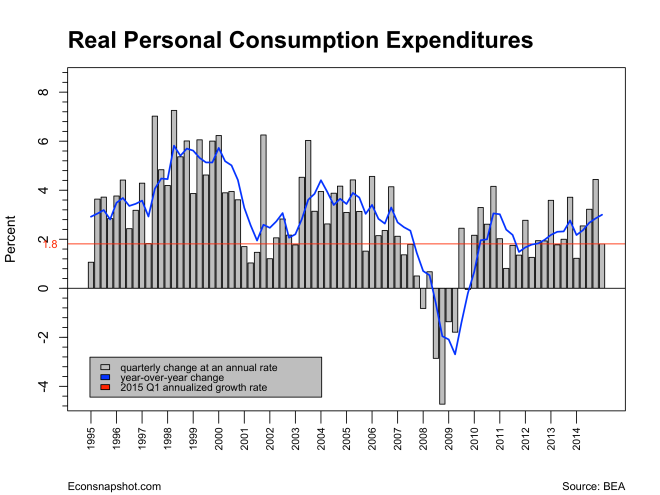
Many prognosticators envisioned an even larger drop so this “restrained” decline might not send shock waves across markets…unless, of course, there are other signs of weakness moving forward that might signal weaker Q2 growth. For example, inventories were revised down by about half of what people thought, $15.2 billion. While personal consumption expenditures saw almost no revision, the (expected) downward revision in exports materialized, revised down by $26.3 billion. Final sales also saw a big downward revision compared to the advance estimate, from -0.5 to -1.2.
Residual Seasonality and GDP vs. GDI
A recent report from the San Francisco Fed argues that the large revisions to first Quarter data and the remarkable weakness in the first quarter for the last few years may be the result of “residual seasonality” rather than fundamentals. Economists at the Federal Reserve Board reached a similar conclusion. The Bureau of Economic Analysis is looking at this issue and will incorporate their conclusions into the July revisions to GDP. Many expect that review to result in a .5% or so upward revision of the data In our view it would be a mistake to attach too much importance to this possibility. The first quarter was unquestionably weak for reasons that were quite foreseeable. Some of it was bad luck (i.e. bad weather and port strikes) but some of it was fundamental – lower exports because of a stronger dollar and weakness in other economies.
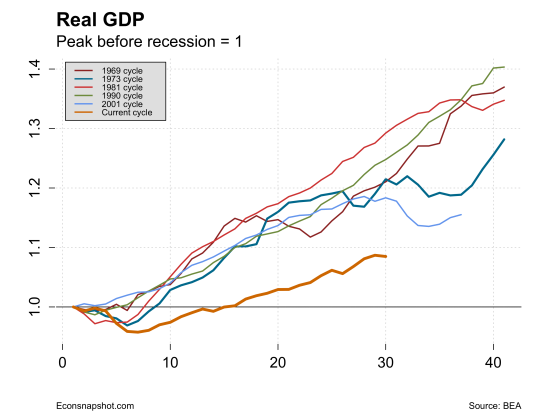
The more important issues are twofold: How does this bear on the argument that we we are caught in a period of “secular stagnation” as former Treasury Secretary Larry Summers and others have argued. And, how does the weaker economic growth impact the probability of Fed “liftoff” in the near future. On the first question it would be hard to refute the idea that U.S. potential GDP has shifted down a notch. Compared with previous recoveries this one continues to be anemic. There has also been a distinct slowing of both residential and non-residential fixed investment that does not bode well for future growth of the economy.
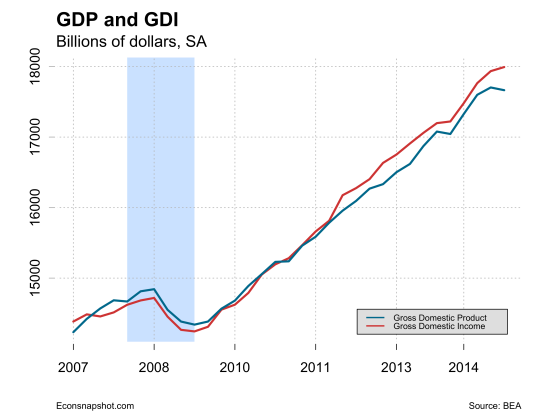
Another theme that has emerged is a discussion of the merits of looking at Gross Domestic Income (GDI) vs. GDP. The argument is that GDI is a better gauge of the economy than the traditional Gross Domestic Product (GDP) measure. The reasons given can be found here and here. As the graphs below show, however, this is certainly not a matter of using one or the other. Each has shown lackluster performance. In NIPA theory these two measures are equivalent, but, GDP and GDI do differ at times. Over a long time frame, they do indeed almost perfectly rest on top of each other.
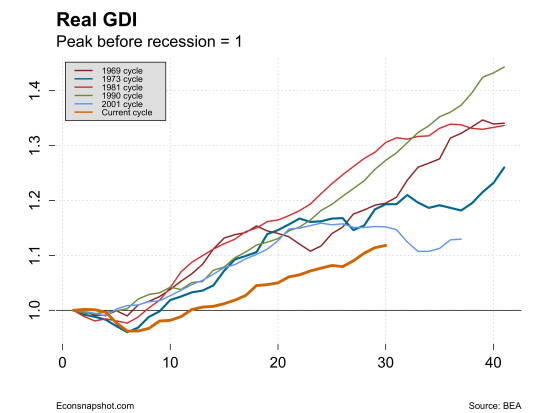
If we zoom in to the recent experience since 2007, real GDI has performed better than real GDP. Indeed it is the end points that signal a decline in real GDP but not in real GDI…
…but it was the opposite in the early 1990’s when real GDI does worse than real GDP.
However, the main point to be made here is that using either one tells a story of an anemic recovery since the Great Recession of 2007, and splitting hairs over GDP vs. GDI seems a minor issue.
All of these factors are going to caution the FOMC when it meets in June because the last thing they want to do is derail a recovery that is now both mature and showing some signs of weakness. By and large the labor market seems to be operating near full employment, albeit without wage growth. Whether the first quarter weakness signals a more prolonged slowdown won’t be known for some time but it seems likely to put liftoff on hold for a while.


