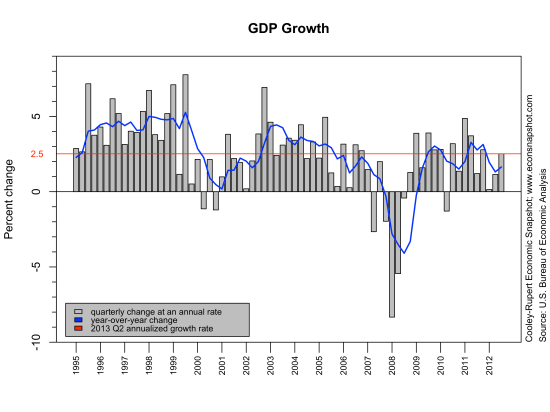
The Bureau of Economic Analysis announced here that Q2 real GDP increased at a seasonally adjusted annual rate of 1.7%, beating analysts expectations that were somewhere around 1.0%. In addition, Q1 was revised up to 1.1% from 0.4%. Government spending was revised up slightly in Q1, from -4.8% to -4.1%, and the Q2 change revealed stronger spending than many had predicted, still negative however, -0.4%. Personal consumption growth increased 1.8% and was revised up to 2.3% (was 1.8%) in Q1.
Comprehensive (benchmark) revisions
Every 5 years or so the BEA undergoes large benchmark revisions to incorporate new methodologies and statistical techniques. In this latest round of revisions the BEA incorporated several major changes (for a more detailed account go here). In particular, the revisions
- Change the base year for real variables to 2009$ from 2005$.
- Recognize expenditures by business, government, and nonprofit institutions serving households (NPISH) on research and development as fixed investment.
- Recognize expenditures by business and NPISH on entertainment, literary, and other artistic originals as fixed investment.
- Expand the ownership transfer costs of residential fixed assets that are recognized as fixed investment and improve the accuracy of the associated asset values and services lives.
- Measure the transactions of defined benefit pension plans on an accrual accounting basis by recognizing the costs of unfunded liabilities and showing the pension plans as a sub-sector of the financial corporate sector.
- Harmonize the treatment of wages and salaries by using accrual-based estimates consistently throughout the accounts.
These comprehensive revisions mainly affect the levels of variables. We plot below real GDP (logged) successively adding the changes in the comprehensive revision. The change to the 2009$ base year shifts up the level of real GDP as can be seen in the graph below (black line compared to the red line). Adding intangible investment shifts the line up further, but also has some growth rate effects (red line compared to green line). The blue line represents the current estimate.

If we are mostly interested in how the revisions changed GDP growth, one way of controlling for the level is to normalize each series at the beginning of the peaks of business cycles. The graph below shows the pre-revision data (dashed lines) and the post-revision data (solid lines) using the same technique as we have used in our earlier blogs, plotting the evolution of the economy since the previous peak of the NBER recession dates. For almost all of the recessions the revisions lie above the older data.
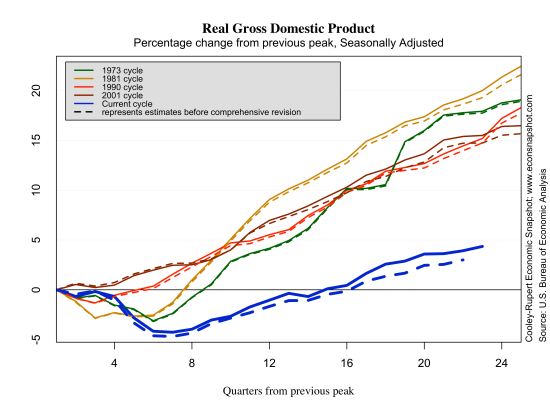
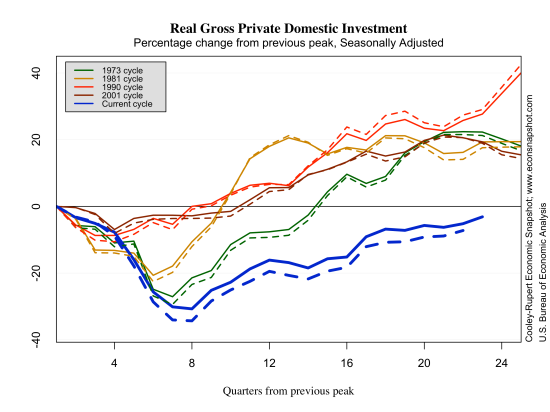
The graph shows that the revisions have made the latest recession appear not quite as deep and the latest recovery a little stronger than the pre-revision data had suggested.The same pattern emerges for consumption and investment.

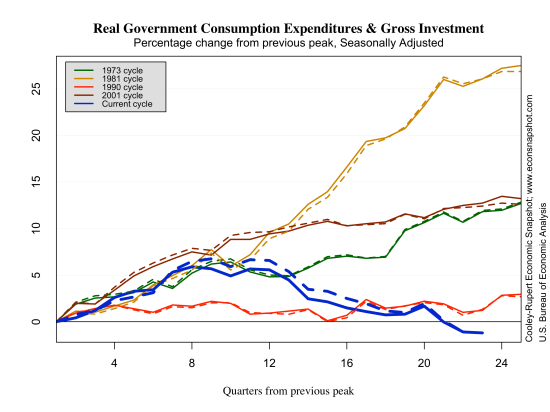
In contrast, the revision to government consumption plus government investment shows a decidedly downward revision for this past recession and recovery.
Although there was a bump up in GDP growth from the revisions, as is evident from the GDP graph above, the current recovery is still much weaker than past recoveries.
In order to assess how the incorporation of expenditures on intangible capital into fixed investment, we first look at the newly added components. Nonresidential fixed investment now includes the major categories: structures, equipment, and intellectual property products. Previously, equipment and software were lumped together. Now, software is included in intellectual property along with research and development and entertainment, literary, and artistic originals.
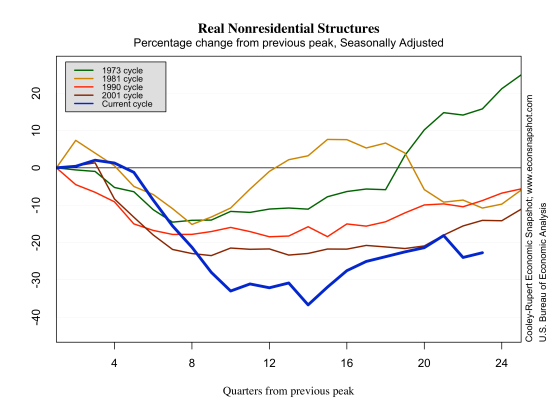
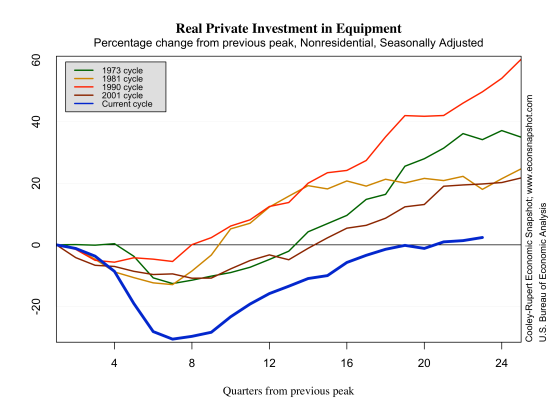
What is striking about the new methodology is that over the course of business cycles it is equipment and structures that fall substantially while intellectual property does not. There appears to be “hoarding” of intellectual capital. Traditional capital expenditures are cut first in response to shocks but not the inputs into intellectual property accumulation, such as research scientists.

As is evident from the graph below, intangible capital has grown faster than tangible capital. That is, the ratio of intangible to tangible has increased substantially. Moreover, almost all of the cyclical volatility comes from the tangible capital. As intangible capital has become a larger share of investment the volatility of GDP has declined.


