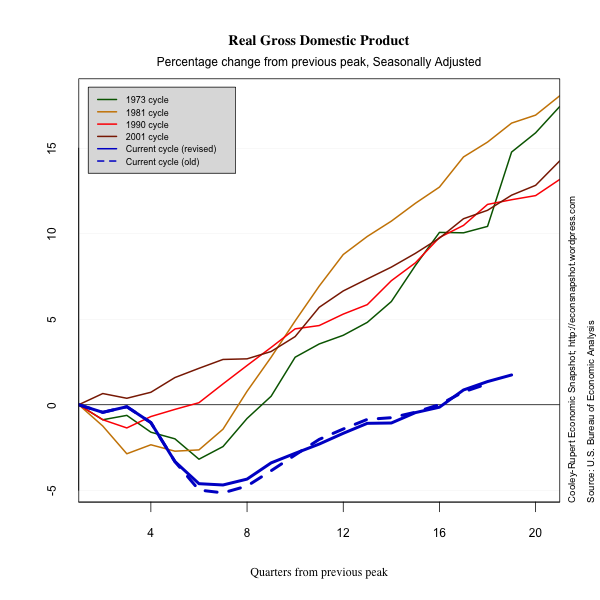
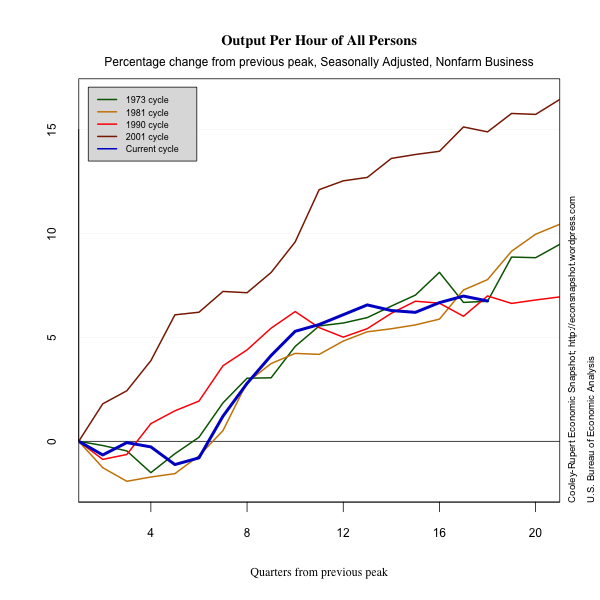
The first report on second quarter real GDP growth was largely as expected after many weak signals. Real GDP grew at a seasonally adjusted annual rate of 1.5% in the second quarter of 2012. Annual benchmark revisions show growth rates of 2.0% (was 1.9%) in Q1 and 4.1% (was 3.0%) in Q4 of 2011. The overall path of the expansion is somewhat weaker as a result, with revisions dating back to 2009 showing 2010 revised down (now 2.4% was 3.0%) with nearly offsetting upward revisions for 2009 (now -3.1%) was -3.5%) and 2011 (now 1.8% was 1.7%).
Revision highlights and low lights
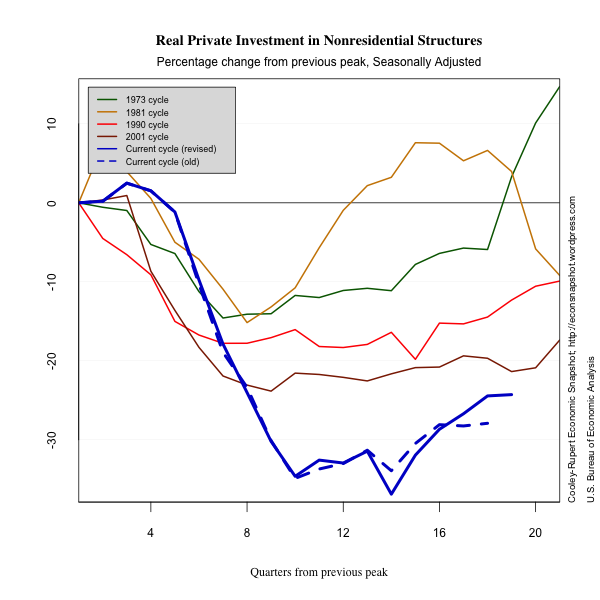
While the revisions did little to the overall path of the recovery, there were some interesting and large revisions to the components. As an example, nonresidential investment and investment in structures saw large upward revisions in growth rates over the past several quarters.
                            Q2 11  Q3 11  Q4 11  Q1 12
  Nonresidential..........  14.5   19.0    9.5    7.5
   Previously published..   10.3   15.7    5.2    3.1
    Structures............  35.2   20.7   11.5   12.9
      Previously published  22.6   14.4    -.9    1.9
In spite of the stronger picture for these series, there were downward revisions to investment in equipment and software. For this reason it is useful to have a complete picture of the revisions to see how extensive they can be. We present this below.
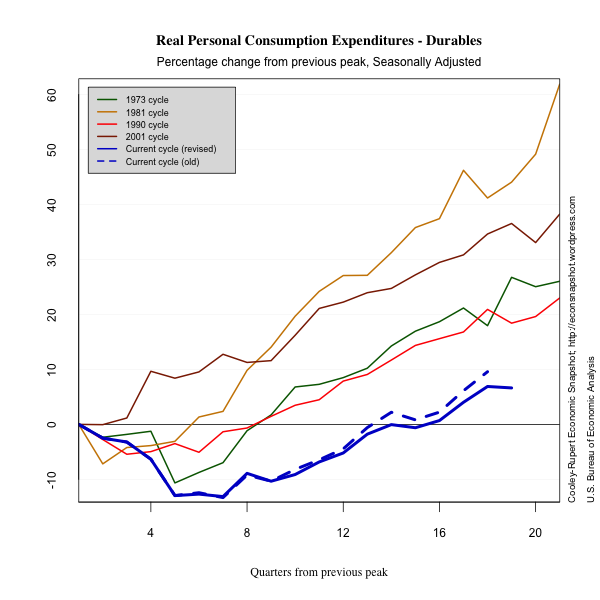
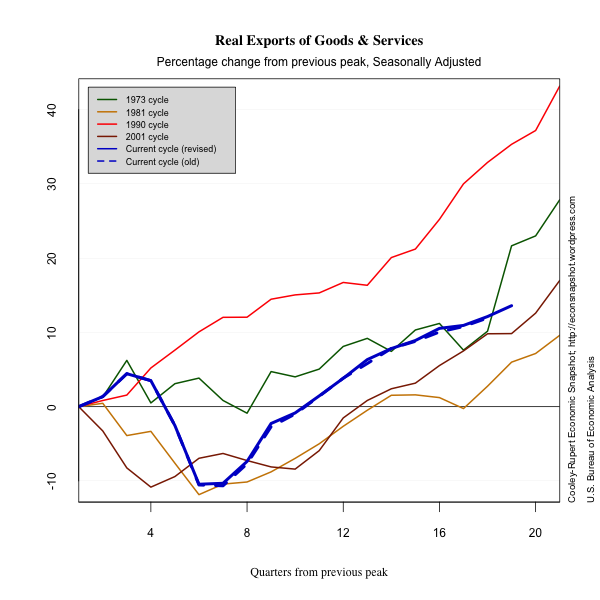
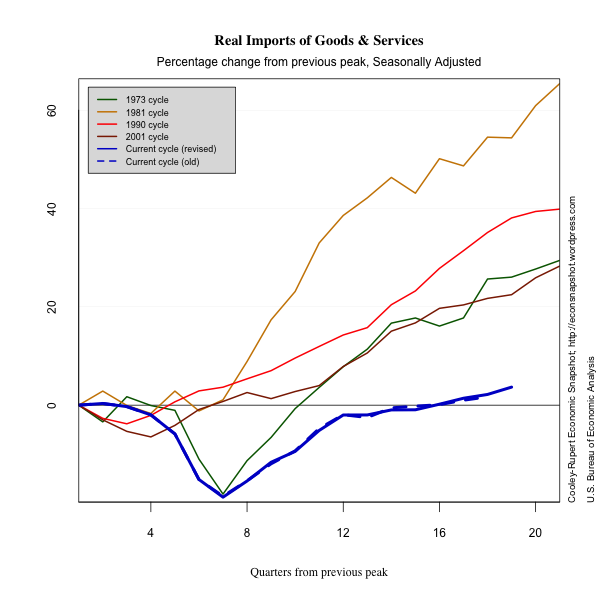
The most important part of this data release are the preliminary estimates for second quarter GDP and its components. These suggest a weakening and possibly faltering recovery. Consumption of non-durables increased only very slightly and consumption of durables declined after a strong first quarter rebound that helped the auto sector. Both exports and imports increased compared to the first quarter.
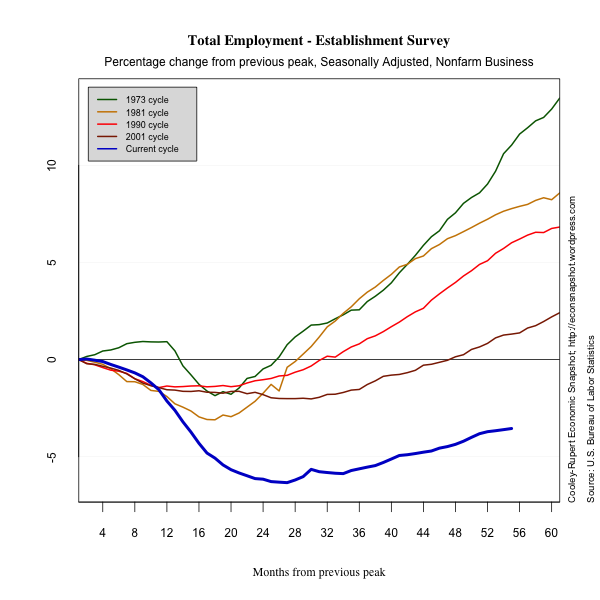
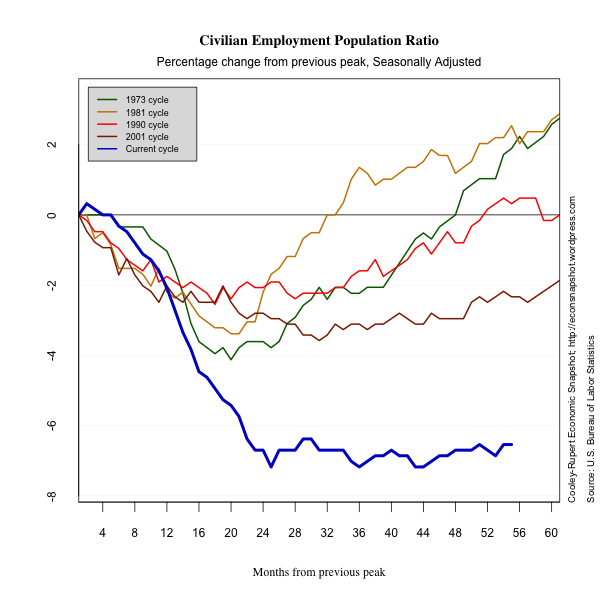
The evidence suggests that the situation in Europe where most of the economies are contracting again and the slowdown in the emerging margins of Asia are having an effect on the U.S. recovery. The lengthy contraction in employment is a potent of how severe our “growing pains” are.
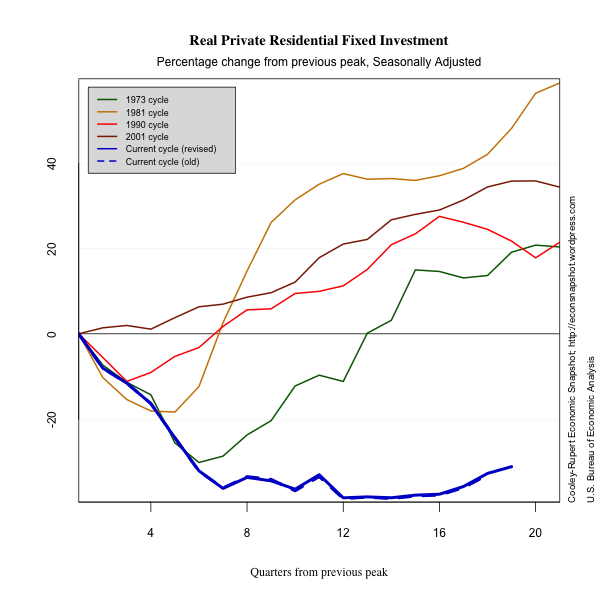
In a departure from our standard presentation, we show the revisions explicitly in the following graphs so you can see how the picture of the recovery changes with better information. The magnitude of the revisions raise the question of whether markets overreact to preliminary information about the recovery….or is it simply the business press who over react?
Glossary
Compensation includes accrued wages and salaries, supplements, employer contributions to employee benefit plans, and taxes.
Consumer Price Index measures the price paid by urban consumers
for a representative basket of goods and services. Prices are collected from 87 urban areas and from approximately 23,000 retail and service establishments.
Debt Outstanding measures the current level debt owed on credit market
instruments. Credit market instruments include open market paper, Treasury securities, agency and GSE-backed securities, municipal securities, corporate and foreign bonds, bank loans, mortgages, and
consumer credit.
Durables are goods that have an average useful life of at least 3
years.
Employment Population Ratio is the ratio of the number of
civilians in the labor force to the total civilian population.
Exports consist of goods and services that are sold or
transferred by U.S. residents to foreign residents.
Goods are tangible commodities that can be stored or inventoried.
Government Consumption Expenditures and Gross Investment measures
current consumption expenditures by the government in order to produce goods and services to the public and investment in structures and equipment and software.
Gross Private Domestic Investment measures additions and
replacements to the stock of private fixed assets without deduction of
depreciation.
Imports consist of goods and services that are sold or
transferred by foreign residents to U.S. residents.
Industrial Production Index measures real output of
manufacturing, mining, and electric and gas utilities industries.
Job Openings or Vacancies are all positions that are open (not
filled) on the last business day of the month.
Labor Force is defined as the number of unemployed persons plus
the number of employed persons.
Labor Force Participation Rate is the ratio of unemployed persons
to the number of persons in the labor force.
Net Worth equals to total assets minus total liabilities. Assets
include owner-occupied real estate, consumer durables, and equipment and software owned by nonprofit organizations.
Nondurables are goods that have an average useful life of less
than 3 years.
Nonresidential Fixed Investment measures investment by businesses
and nonprofit institutions in nonresidential structures and in equipment and software.
Personal Consumption Expenditures measures the value of goods and services purchased by households, nonprofit institutions that primarily serve households, private non-insured welfare funds, and private trust funds.
Residential Fixed Investment measures investment by businesses and households in residential structures and equipment, primarily new construction of single-family and multifamily units.
Services are commodities that cannot be stored or inventoried and
that are usually consumed at the place and time of purchase.
Total Borrowing measures the flow of new credit market liabilities during the period. Credit market liabilities include open market paper, Treasury securities, agency and GSE-backed securities, municipal securities, corporate and foreign bonds, bank loans, mortgages, and
consumer credit.
