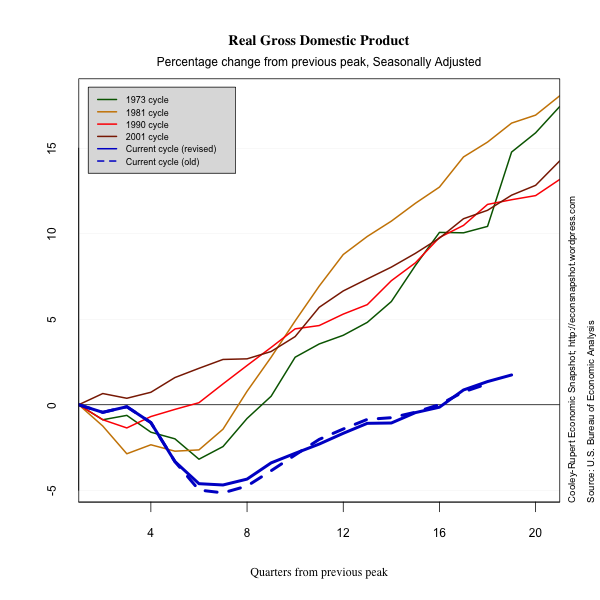
The first report on second quarter real GDP growth was largely as expected after many weak signals. Real GDP grew at a seasonally adjusted annual rate of 1.5% in the second quarter of 2012. Annual benchmark revisions show growth rates of 2.0% (was 1.9%) in Q1 and 4.1% (was 3.0%) in Q4 of 2011. The overall path of the expansion is somewhat weaker as a result, with revisions dating back to 2009 showing 2010 revised down (now 2.4% was 3.0%) with nearly offsetting upward revisions for 2009 (now -3.1%) was -3.5%) and 2011 (now 1.8% was 1.7%).
Revision highlights and low lights
While the revisions did little to the overall path of the recovery, there were some interesting and large revisions to the components. As an example, nonresidential investment and investment in structures saw large upward revisions in growth rates over the past several quarters.
                            Q2 11  Q3 11  Q4 11  Q1 12
  Nonresidential..........  14.5   19.0    9.5    7.5
   Previously published..   10.3   15.7    5.2    3.1
    Structures............  35.2   20.7   11.5   12.9
      Previously published  22.6   14.4    -.9    1.9
In spite of the stronger picture for these series, there were downward revisions to investment in equipment and software. For this reason it is useful to have a complete picture of the revisions to see how extensive they can be. We present this below.
The most important part of this data release are the preliminary estimates for second quarter GDP and its components. These suggest a weakening and possibly faltering recovery. Consumption of non-durables increased only very slightly and consumption of durables declined after a strong first quarter rebound that helped the auto sector. Both exports and imports increased compared to the first quarter.
The evidence suggests that the situation in Europe where most of the economies are contracting again and the slowdown in the emerging margins of Asia are having an effect on the U.S. recovery. The lengthy contraction in employment is a potent of how severe our “growing pains” are.
In a departure from our standard presentation, we show the revisions explicitly in the following graphs so you can see how the picture of the recovery changes with better information. The magnitude of the revisions raise the question of whether markets overreact to preliminary information about the recovery….or is it simply the business press who over react?
Continue reading “The Recovery in the Rearview Mirror and Discouraging News About Q2”
