The second estimate of GDP for the first quarter of 2012 and its components shows a much weaker economy than previously thought. After robust growth in real GDP at an annual rate of 3% in the fourth quarter of 2011 the economy slowed markedly to a 1.9% rate in the first quarter. Most of the change was due to downward revisions to state and local government spending and to personal consumption, particularly durables. These were somewhat offset by upward revisions to non-residential fixed investment and exports.
The somewhat negative report from the BEA was reinforced by the Institute for Supply Management’s release of the Purchasing Managers Index, a closely watched barometer of manufacturing activity. It showed a sharp decline to its lowest level since 2009.
The Labor Market – A Grim May Jobs Report
The latest Employment Situation report from the Bureau of Labor Statistics shows non-farm payroll employment was essentially stagnant. The number of employed persons increased by only 69,000 workers. This is less than half the level of job gains in March and slightly below the increase of 77,000 jobs in April. April’s number was revised sharply downward from 110,000 . This is very anemic compared to the average of over 250,000 jobs per month for the first quarter of the year. This will provide little updraft to the stagnant labor market. The number of unemployed was essentially unchanged at 12.7 million and the unemployment rate remained essentially unchanged at 8.2%. The labor force participation reversed the decline of last month and stood at 63.8 %. For comparison, as we did last month, we plot employment as reported by ADP, an association of payroll processors. Many observers view this as a useful early indicator of the BLS numbers.
The number of long term unemployed rose to 5.2 million workers and account for 42.8% of the total unemployed.
As we reported last month, according to the Jobs Calculator at the FRB Atlanta, 146,417 jobs must be created per month to reach 7.5% unemployment by the end of 2013, which is in the middle of the central tendency of the forecasts by the Federal Open Market Committee. This is not an unreasonable number but it is well above the latest employment numbers and it is based on a historically low labor force participation rate. If we believed that “equilibrium” labor force participation is 66.2%, the number just as we entered the recession and below the all time high we would have to add 438,547 jobs per month to get to a 7.5% unemployment rate by the end of 2013. That seems unattainable under current conditions and given the state of the world economy.
Employment continued to increase in professional and business services, health care services and leisure and hospitality. Manufacturing jobs also increased. Retail trade employment increased following earlier declines. Construction had the largest declines mostly comprised of negative job growth in heavy and civil engineering construction (-11,200) and specialty trade contractors (-17,700).
Credit Markets
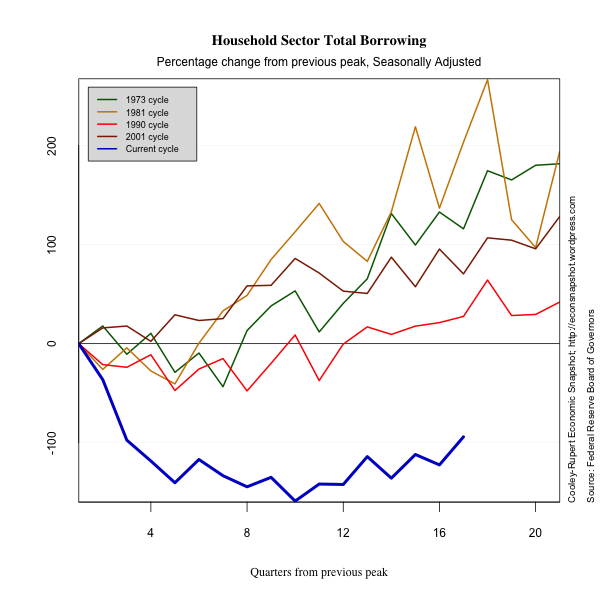
Consumer credit markets continue to remain static while households continue to de-leverage. Total household debt as a percentage of GDP remains 10% below its level at the peak of the business cycle and shows no signs of increasing. Household borrowing is still far below its peak level and is only starting to increase slightly. In the NY Fed’s recently released Quarterly Report on Household Debt and Credit shows households reduced outstanding debt on mortgagees, credit cards, home equity lines of credit, and auto loans. Debt on student loans continued to increase. Lately, though, the deleveraging hasn’t been because of reduced willingness to lend. Credit card limits have increased to three straight quarters.
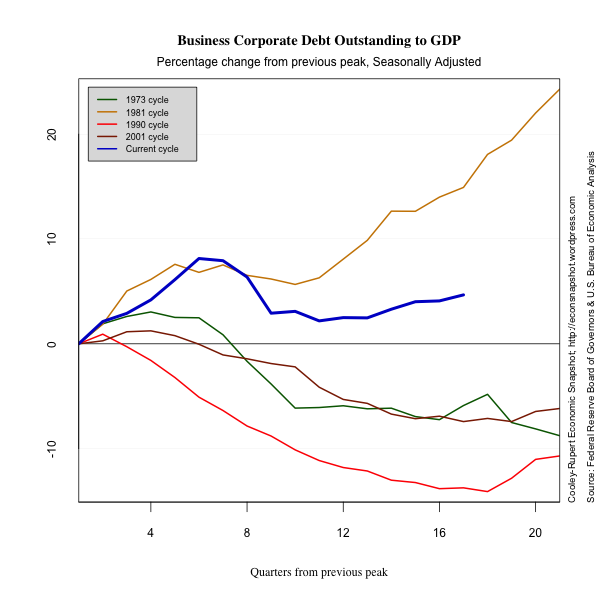
Futher, business corporate sector debt outstanding and borrowing is slowly beginning to return normal. Debt is above its level at the peak of the business cycle and is growing (although slowly). Borrowing hasn’t returned to pre-recession levels, but is on pace with other recoveries despite the tremendous shock to financial markets during 2007 and 2008.
Industrial Production and Inflation
In this section we present some plots of miscellaneous series that reflect other characteristics of this business cycle. The decline in industrial production is dramatic. There is no evidence of inflation or deflation.
Glossary
Compensation includes accrued wages and salaries, supplements, employer contributions to employee benefit plans, and taxes.
Consumer Price Index measures the price paid by urban consumers
for a representative basket of goods and services. Prices are collected from 87 urban areas and from approximately 23,000 retail and service establishments.
Debt Outstanding measures the current level debt owed on credit market
instruments. Credit market instruments include open market paper, Treasury securities, agency and GSE-backed securities, municipal securities, corporate and foreign bonds, bank loans, mortgages, and
consumer credit.
Durables are goods that have an average useful life of at least 3
years.
Employment Population Ratio is the ratio of the number of
civilians in the labor force to the total civilian population.
Exports consist of goods and services that are sold or
transferred by U.S. residents to foreign residents.
Goods are tangible commodities that can be stored or inventoried.
Government Consumption Expenditures and Gross Investment measures
current consumption expenditures by the government in order to produce goods and services to the public and investment in structures and equipment and software.
Gross Private Domestic Investment measures additions and
replacements to the stock of private fixed assets without deduction of
depreciation.
Imports consist of goods and services that are sold or
transferred by foreign residents to U.S. residents.
Industrial Production Index measures real output of
manufacturing, mining, and electric and gas utilities industries.
Job Openings or Vacancies are all positions that are open (not
filled) on the last business day of the month.
Labor Force is defined as the number of unemployed persons plus
the number of employed persons.
Labor Force Participation Rate is the ratio of unemployed persons
to the number of persons in the labor force.
Net Worth equals to total assets minus total liabilities. Assets
include owner-occupied real estate, consumer durables, and equipment and software owned by nonprofit organizations.
Nondurables are goods that have an average useful life of less
than 3 years.
Nonresidential Fixed Investment measures investment by businesses
and nonprofit institutions in nonresidential structures and in equipment and software.
Personal Consumption Expenditures measures the value of goods and services purchased by households, nonprofit institutions that primarily serve households, private non-insured welfare funds, and private trust funds.
Residential Fixed Investment measures investment by businesses and households in residential structures and equipment, primarily new construction of single-family and multifamily units.
Services are commodities that cannot be stored or inventoried and
that are usually consumed at the place and time of purchase.
Total Borrowing measures the flow of new credit market liabilities during the period. Credit market liabilities include open market paper, Treasury securities, agency and GSE-backed securities, municipal securities, corporate and foreign bonds, bank loans, mortgages, and
consumer credit.

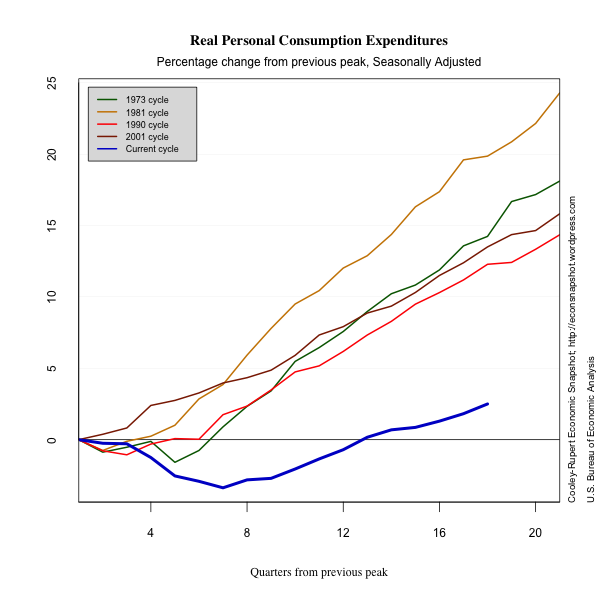
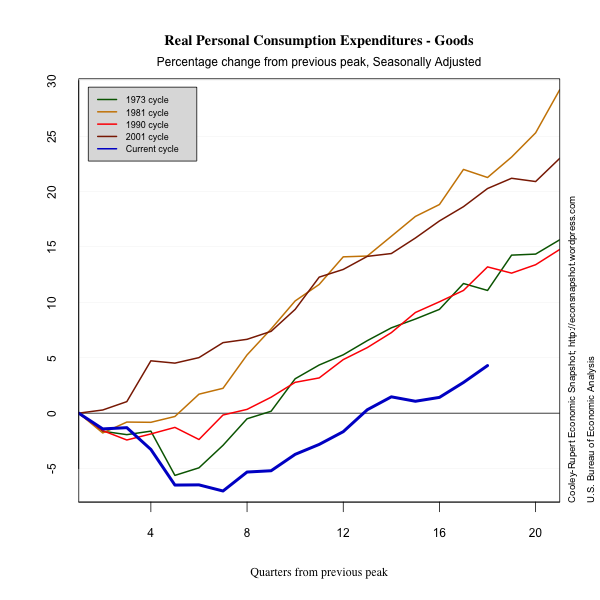


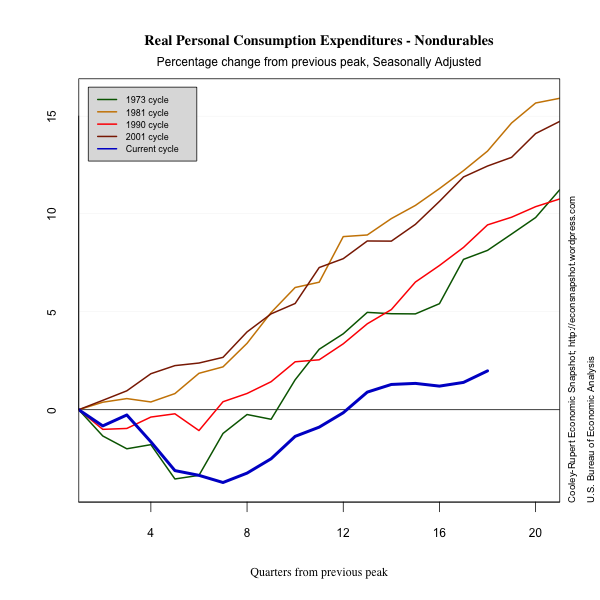
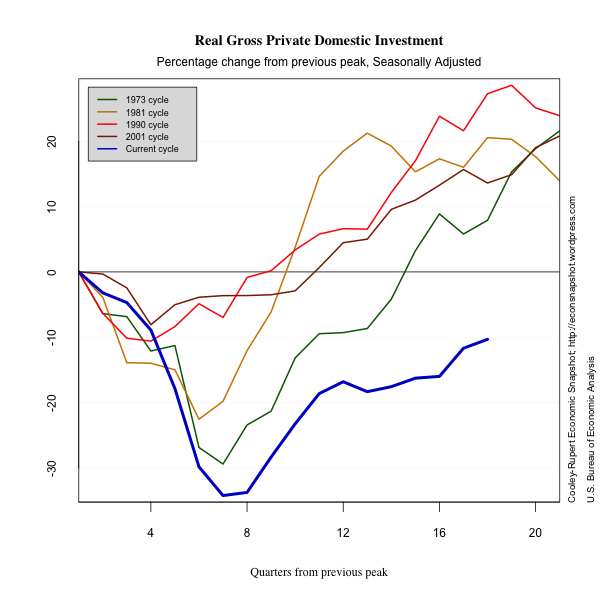

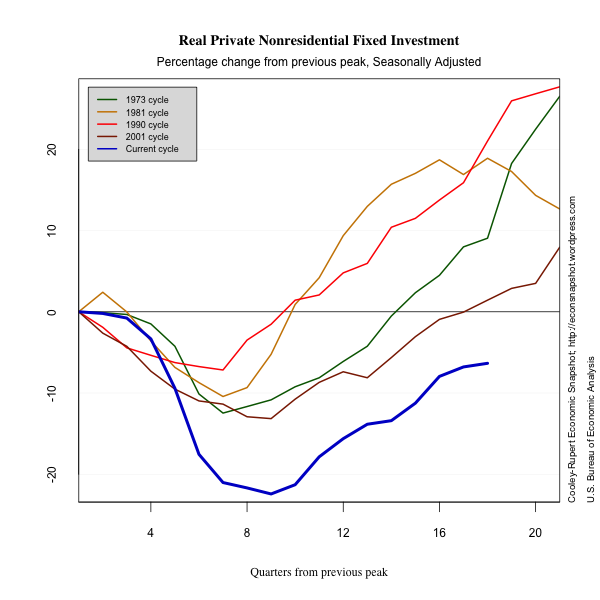
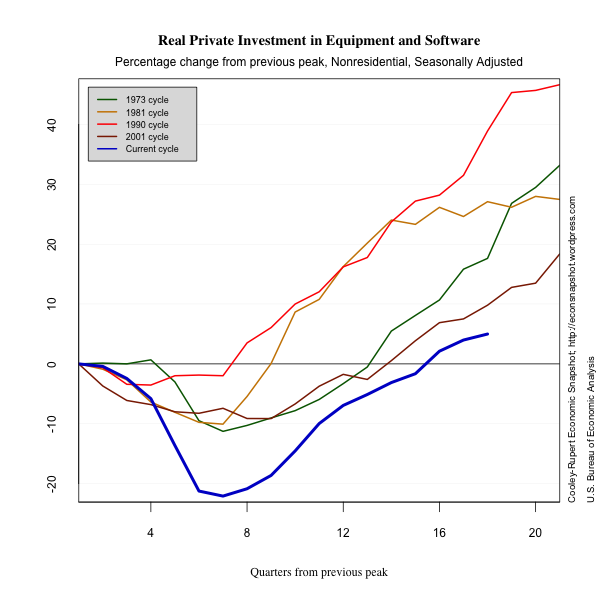
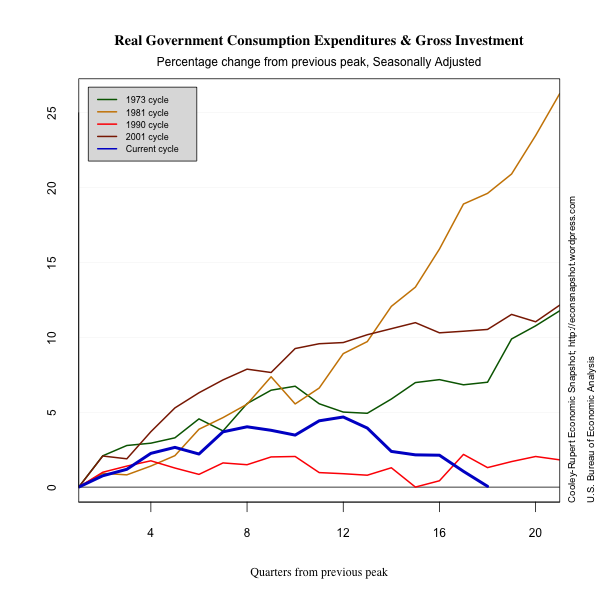
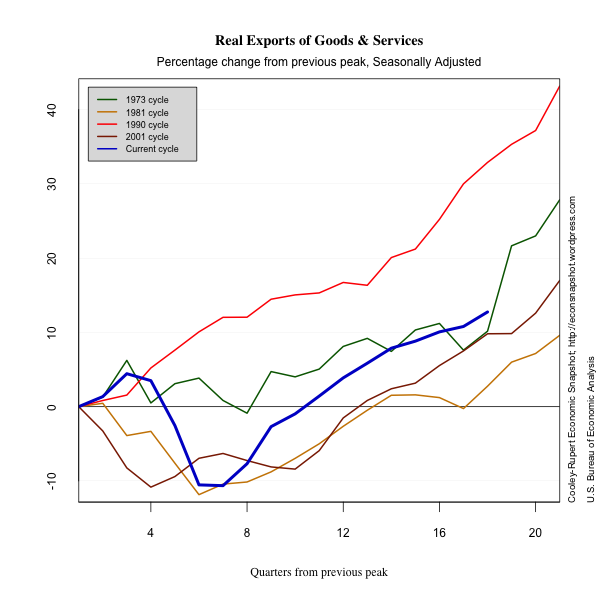
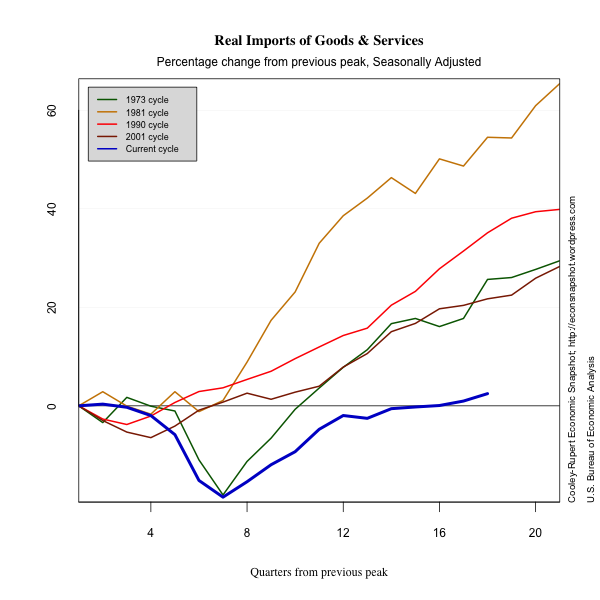
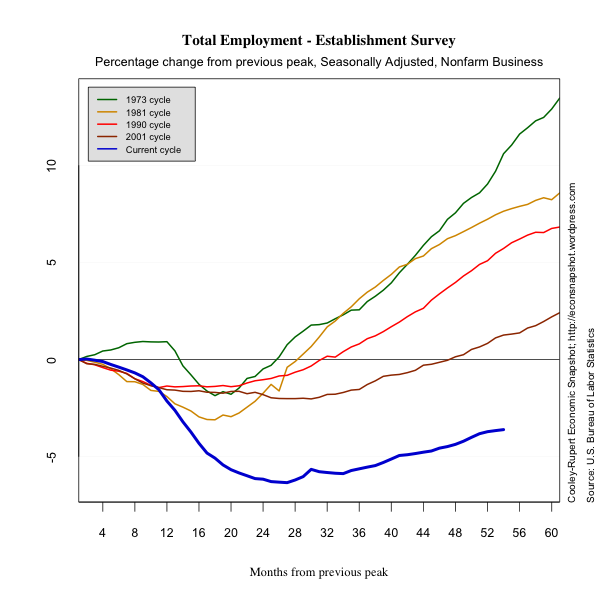
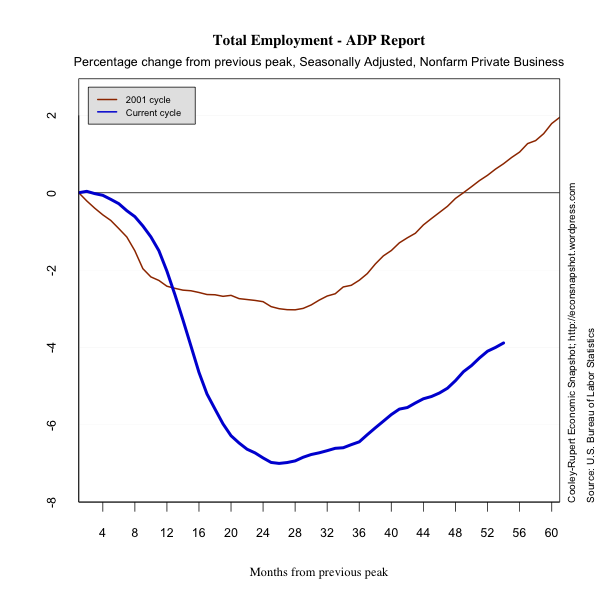


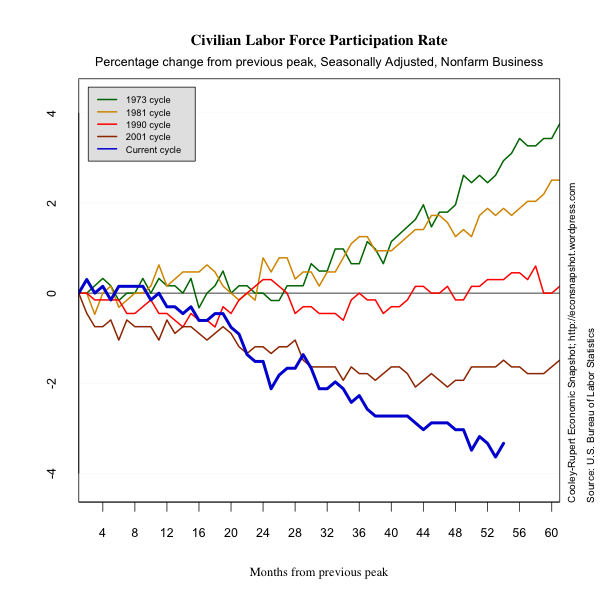
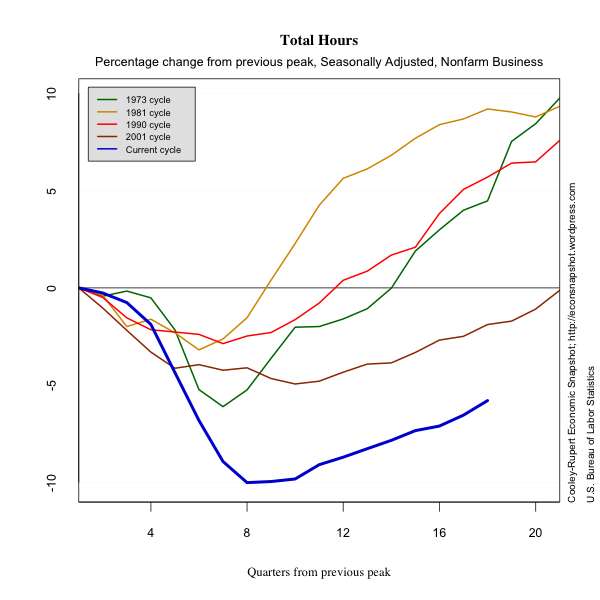
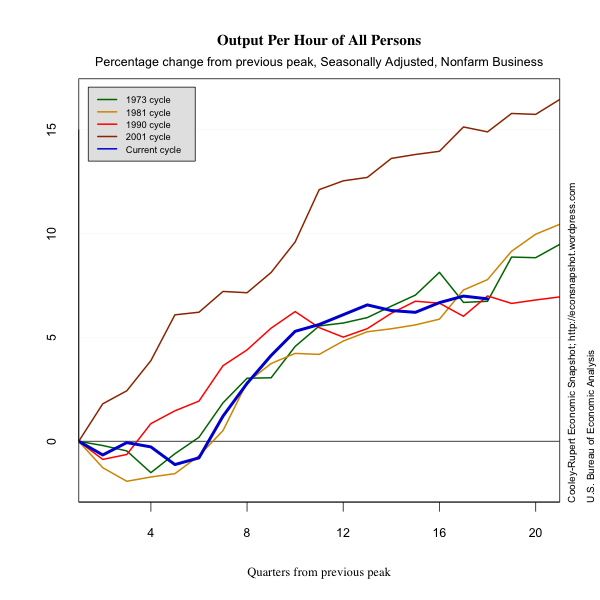
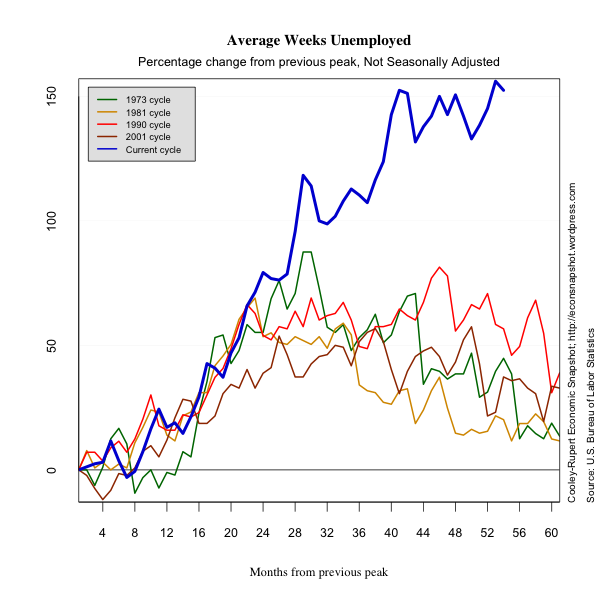
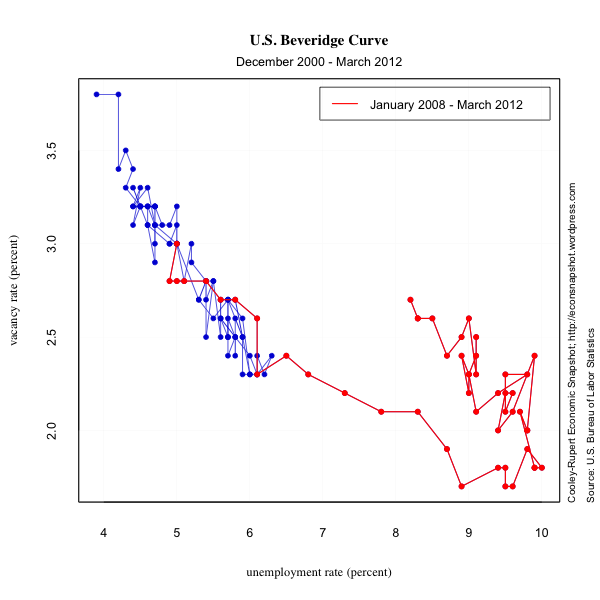


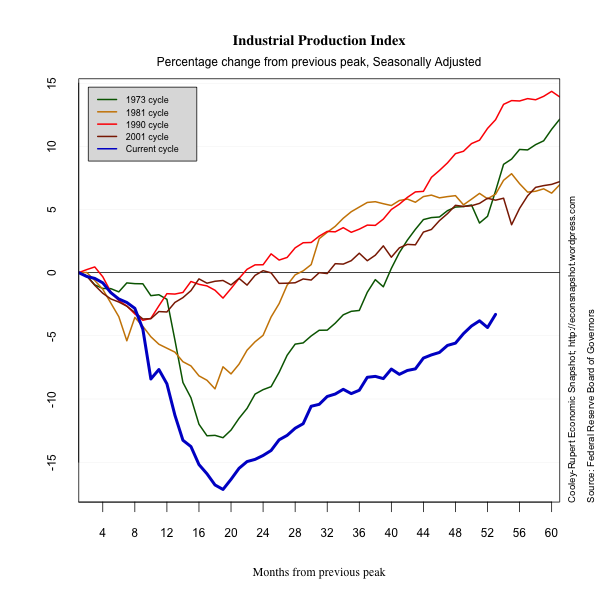

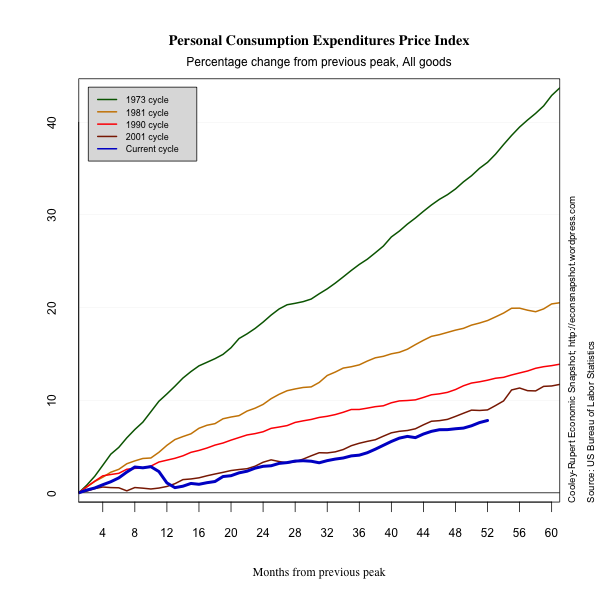
Presenting the data in this format is illuminating. It shows how dismal the economy truly is.