Welcome to the Cooley-Rupert Economic Snapshot, our view of the current economic environment. This is the latest version of our snapshot of the U.S. Economy based on the new employment numbers released today by the Bureau of Labor Statistics. The complete Snapshot based on final revisions to third quarter GDP from the Bureau of Economic Analysis can be found in our previous post.
As in all of our snapshots we present the data in a way that we find particularly useful for assessing where we are in the business cycle and tracking the U.S. economic recovery. The paths of all the series presented are plotted relative to their value at the peak of the respective business cycles. We use the business cycle dates identified by the National Bureau of Economic Research.
You can also find the most recent version of the entire snapshot in pdf form here. As always we welcome any suggestions for additional data that you would like to see and suggestions for how to improve the presentation of the data.
The Labor Market
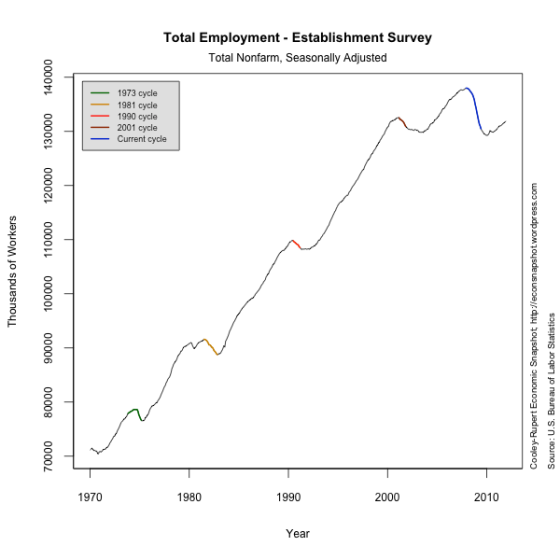
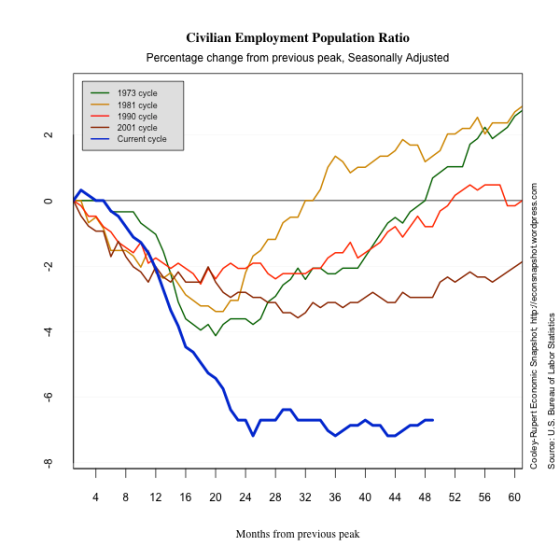
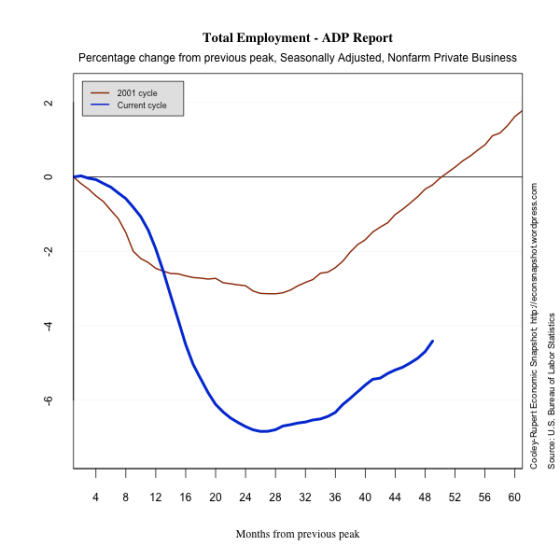
The latest Employment Situation report from the Bureau of Labor Statistics shows a net addition of 200,000 non-farm jobs in December. Prior payrolls were revised lower for November (100,000 from 120,000) and higher for October (112,000 from 100,000). These indicate a continued improvement in labor market conditions but at the same glacial pace of recent months. When we look at total employment relative to the long term trend in employment, not only are we well below the previous peak, we are very far below where a healthy economy might be. An encouraging sign is that the manufacturing sector and the construction sector both added jobs while the Government sector continues to shed them. For comparison, as we did last month, we plot employment as reported by ADP, an association of payroll processors. Many observers view this as a useful early indicator of the BLS numbers.
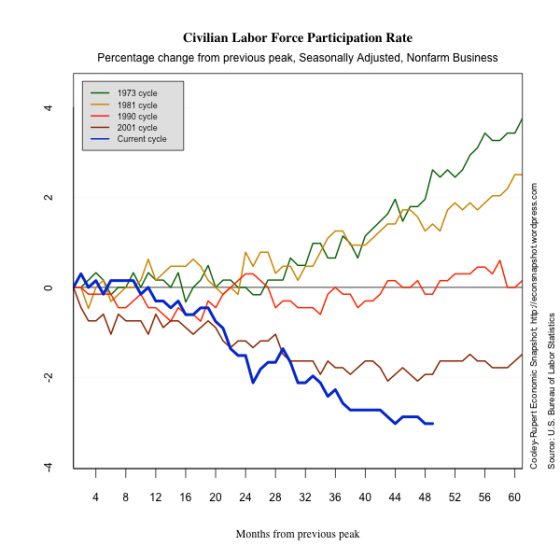
The civilian unemployment rate declined to 8.5% without a further decrease in labor force participation. It stayed steady at 64%. Also encouraging is the fact that the duration of unemployment declined slightly. Currently the average number of weeks spent unemployed is 40.8. That is still nearly 150% higher than it was at the peak of the business cycle. At this point during the previous four recoveries, unemployment duration was on average only 16% above its peak level. Indeed, during the so-called “jobless recovery” at the beginning of this decade, duration was only about 50% above the level at the previous peak.
We also include data on Aggregate Hours of work. Aggregate Hours captures changes in both the extensive margin of labor force adjustment (employment), and the intensive margin (hours of work). Many believe this offers a more accurate picture of the economy …and the picture is grim.
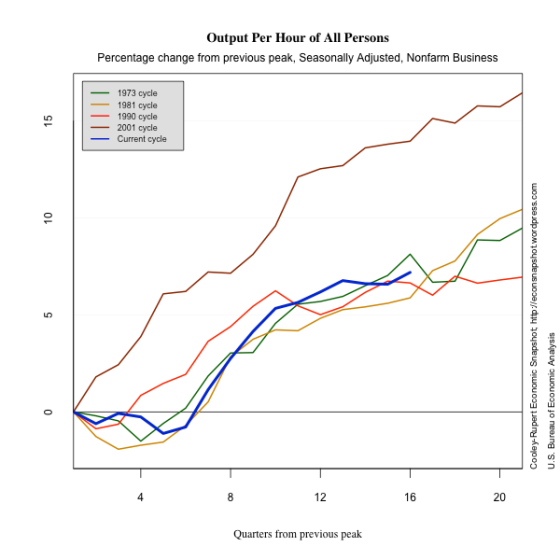
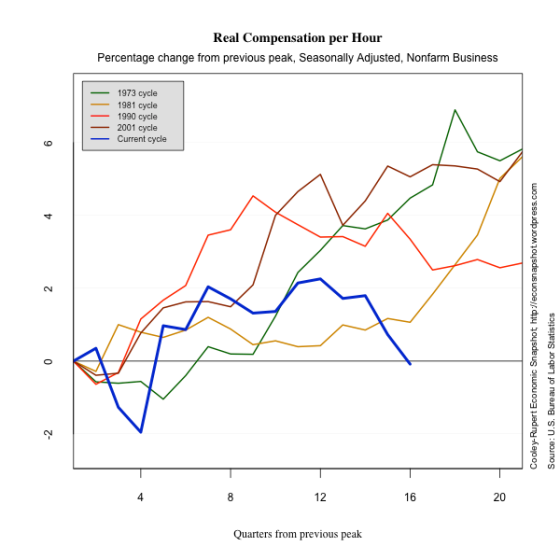
Productivity continues to increase and unit labor costs continued to decline.

