Welcome to the Cooley-Rupert Economic Snapshot – our view of the current economic environment.
This post primarily contains updates from the recent employment situation released by the BLS. Updates about GDP and its components based on preliminary estimates of third quarter activity from the BEA can be found here. The most up-to-date analysis concerning GDP, the labor market, the credit market, and other economic indicators are available here in one pdf document.
As always we welcome any suggestions for additional data that you would like to see and suggestions for how to improve the presentation of the data.
Introduction
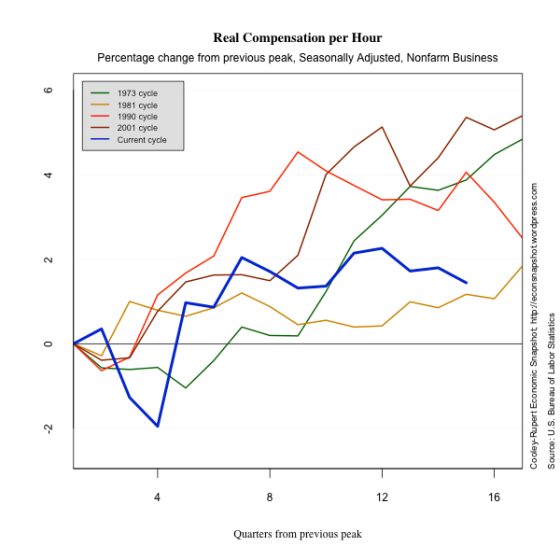
This is the latest version of our snapshot of the U.S. Economy based on the Employment Situation released by the Bureau of Labor Statistics. As in previous snapshots we present the data in a way that we find particularly useful for assessing where we are in the business cycle and tracking the U.S. economic recovery. The paths of all the series presented are plotted relative to the their value at the peak of the respective business cycles. We use the business cycle dates identified by the National Bureau of Economic Research.
The Labor Market – Nice Revisions!
The employment situation report from the BLS this morning shows a net addition of 80,000 non-farm jobs in October. The unemployment rate declined slightly to 9.0%. While the 80,000 figure is really nothing to write home about, the revisions to August and September were substantial. Prior payrolls were revised higher for both August (104,000 from 57,000) and September (158,000 from 103,000). Private sector jobs increased by 104,000 and the government sector continued to shrink, losing another 24,000 jobs. Construction continues to get hammered, losing another 20,000 jobs. Since May the construction sector has been see-sawing up and down, but on net has shed 1,000 jobs. The employment to population ratio continued to slowly creep up. However, there was virtually no change in the labor force participation rate. The number of long term unemployed (27 weeks and over) fell by 366,000.
As we noted in a previous post, the dating of business cycles by the NBER is based on a mixture of evidence that often includes reference to the labor market. Indeed, when the NBER dating committee dated the beginning of this past recession, they made it clear that the labor market was a key variable in their decision, as can be seen here. However, when the committee announced the trough there was no mention of the labor market, which has not shown any signs of recovery. Indeed, the paths of the employment/population ratio and the labor force participation rate make the strongest case for concern about a double dip recession.
In this post we take a deeper look at the labor market, including data on Aggregate Hours of work and the duration of unemployment. Aggregate Hours captures changes in both the extensive margin of labor force adjustment (employment), and the intensive margin (hours of work). Many believe this offers a more accurate picture of the economy …and the picture is grim. The data on the duration of unemployment is particularly discouraging.
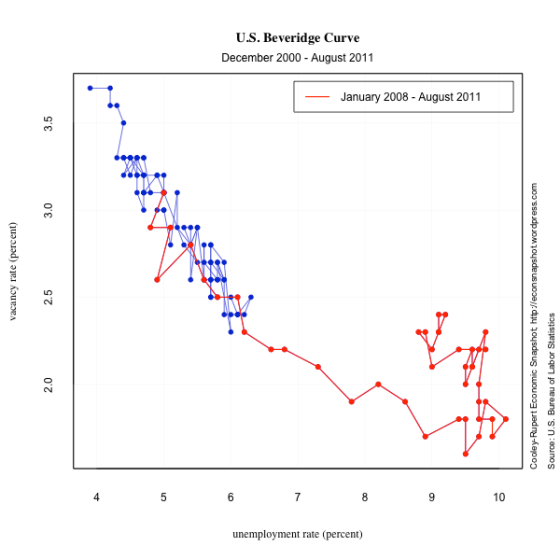
We also include data from JOLTS, the Job Openings and Labor Turnover Survey. These show some more refined features of the labor market and permit comparison to the 2001 business cycle. What stands out in these data is that, while separations look similar to the 2001 cycle, this masks the extraordinarily abrupt increase in layoffs and discharges and the sharp decline in quits.


