By Thomas Cooley and Peter Rupert
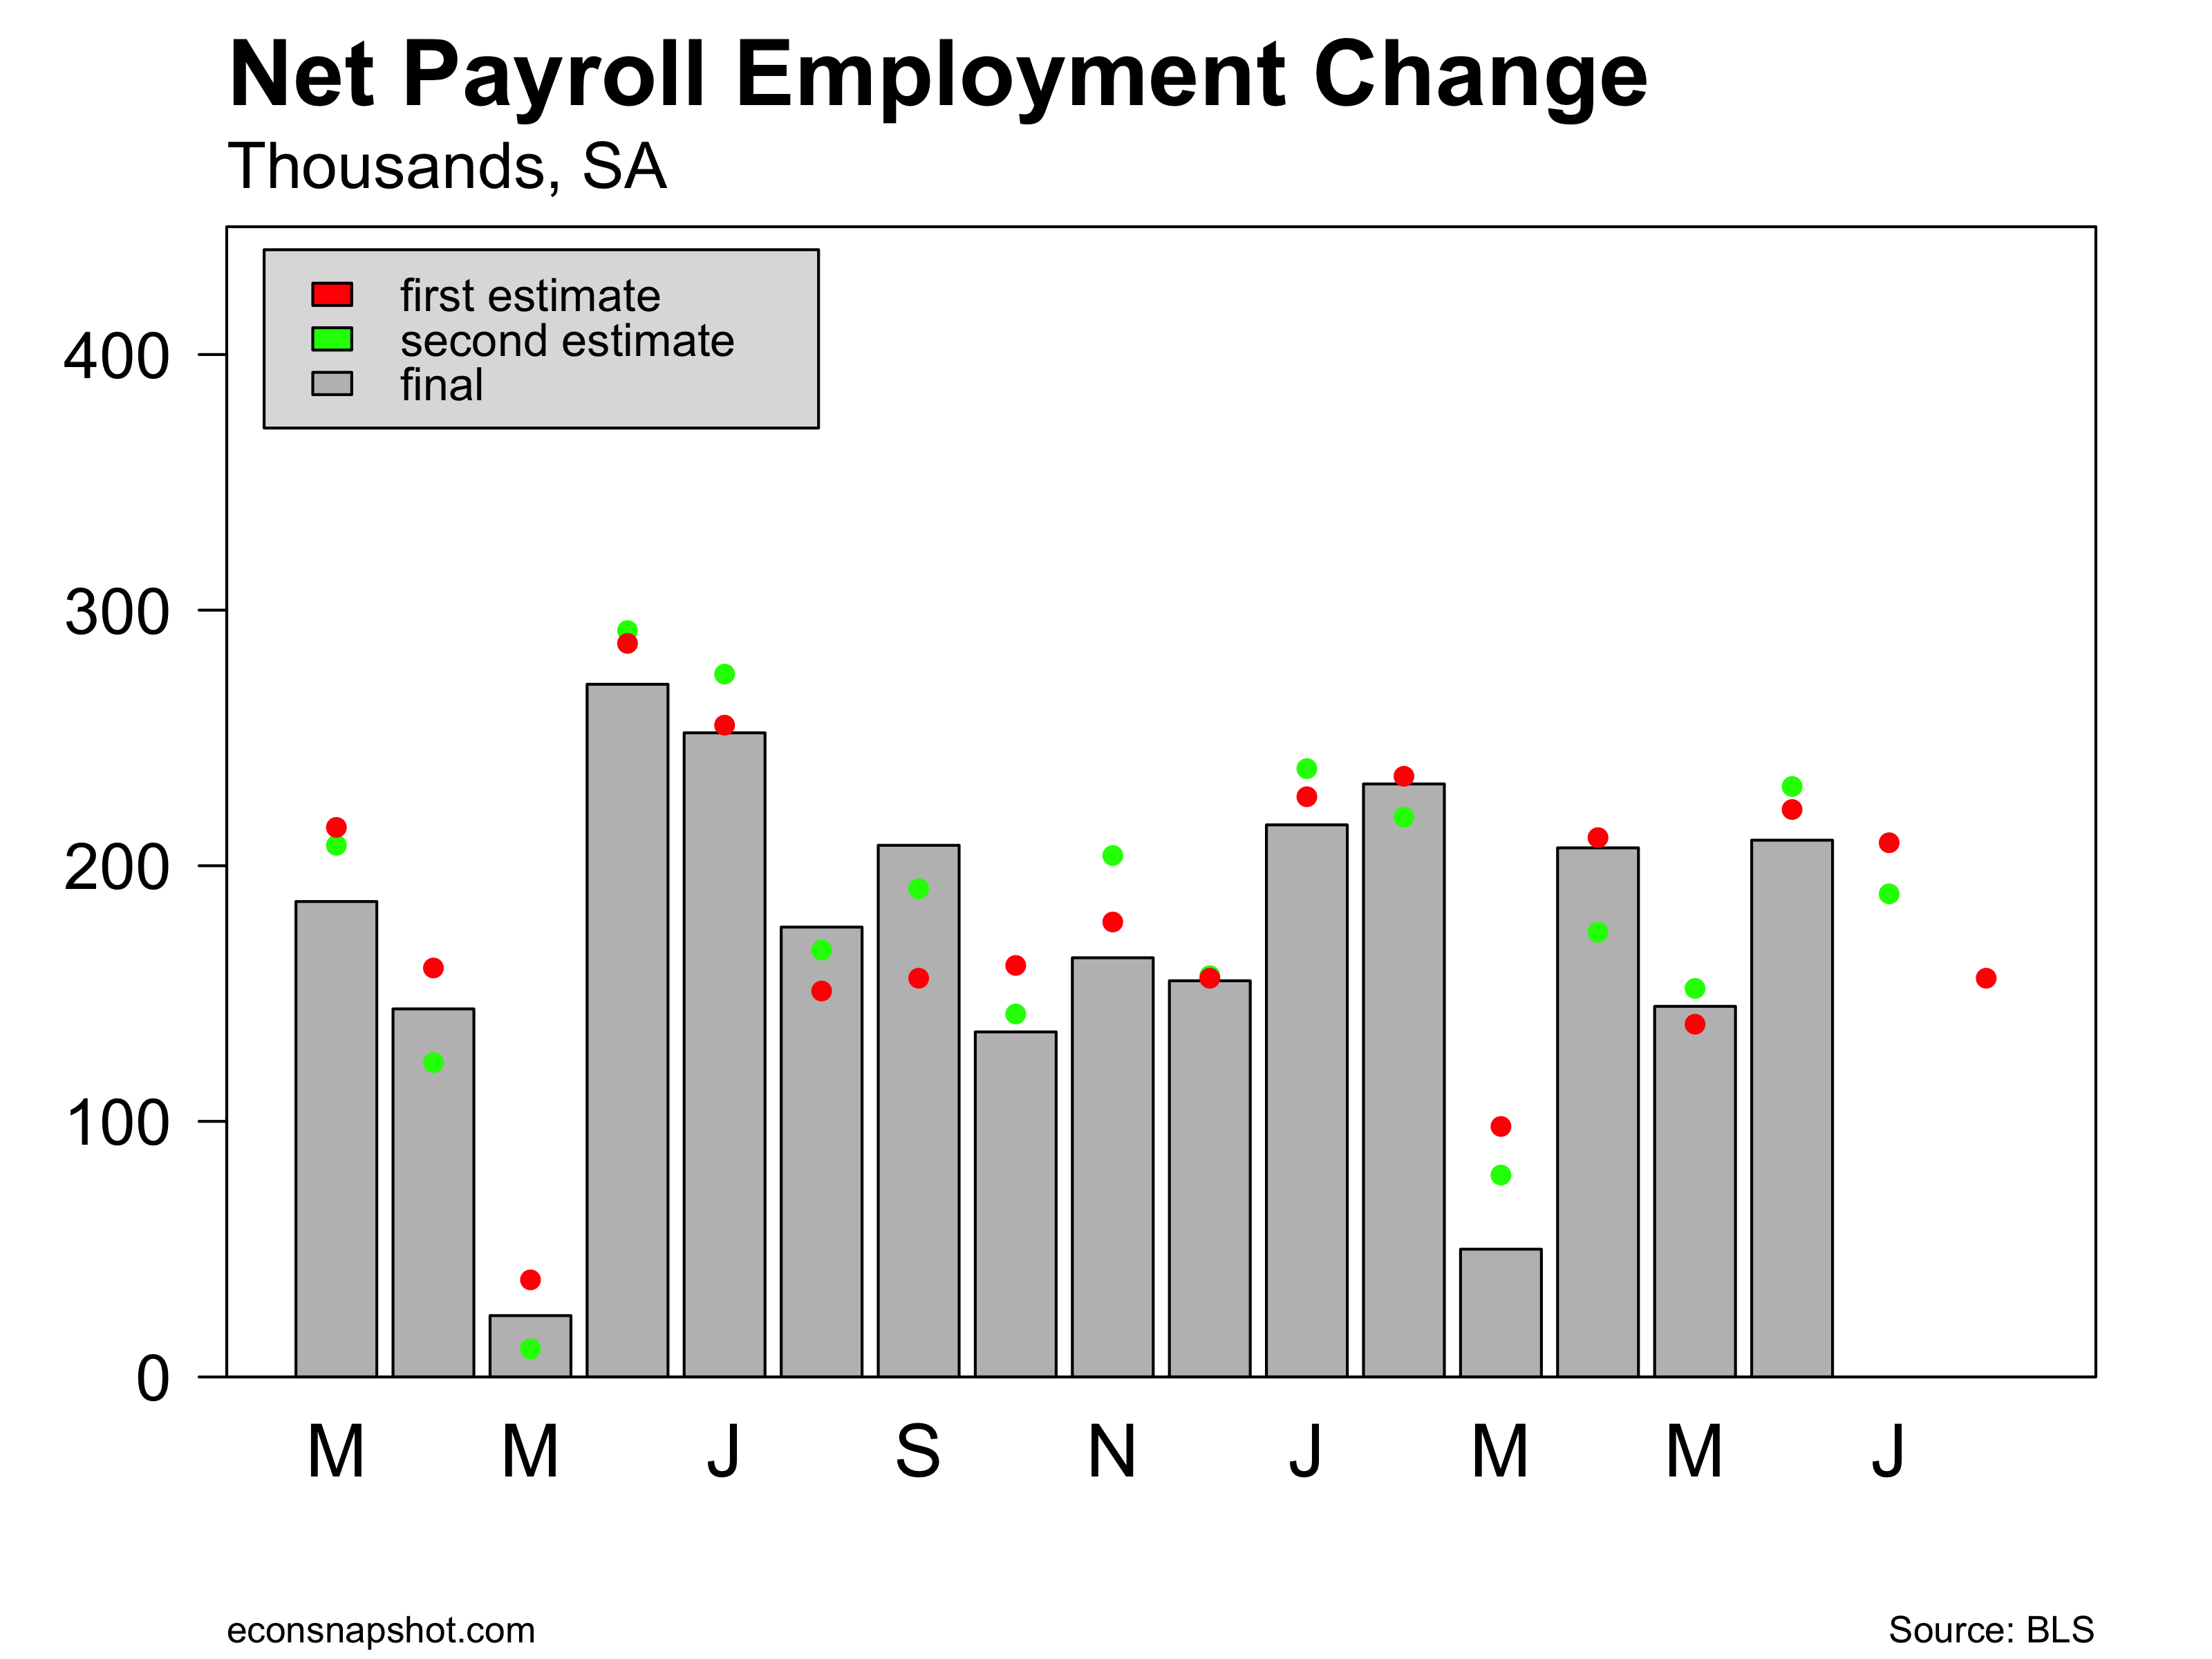
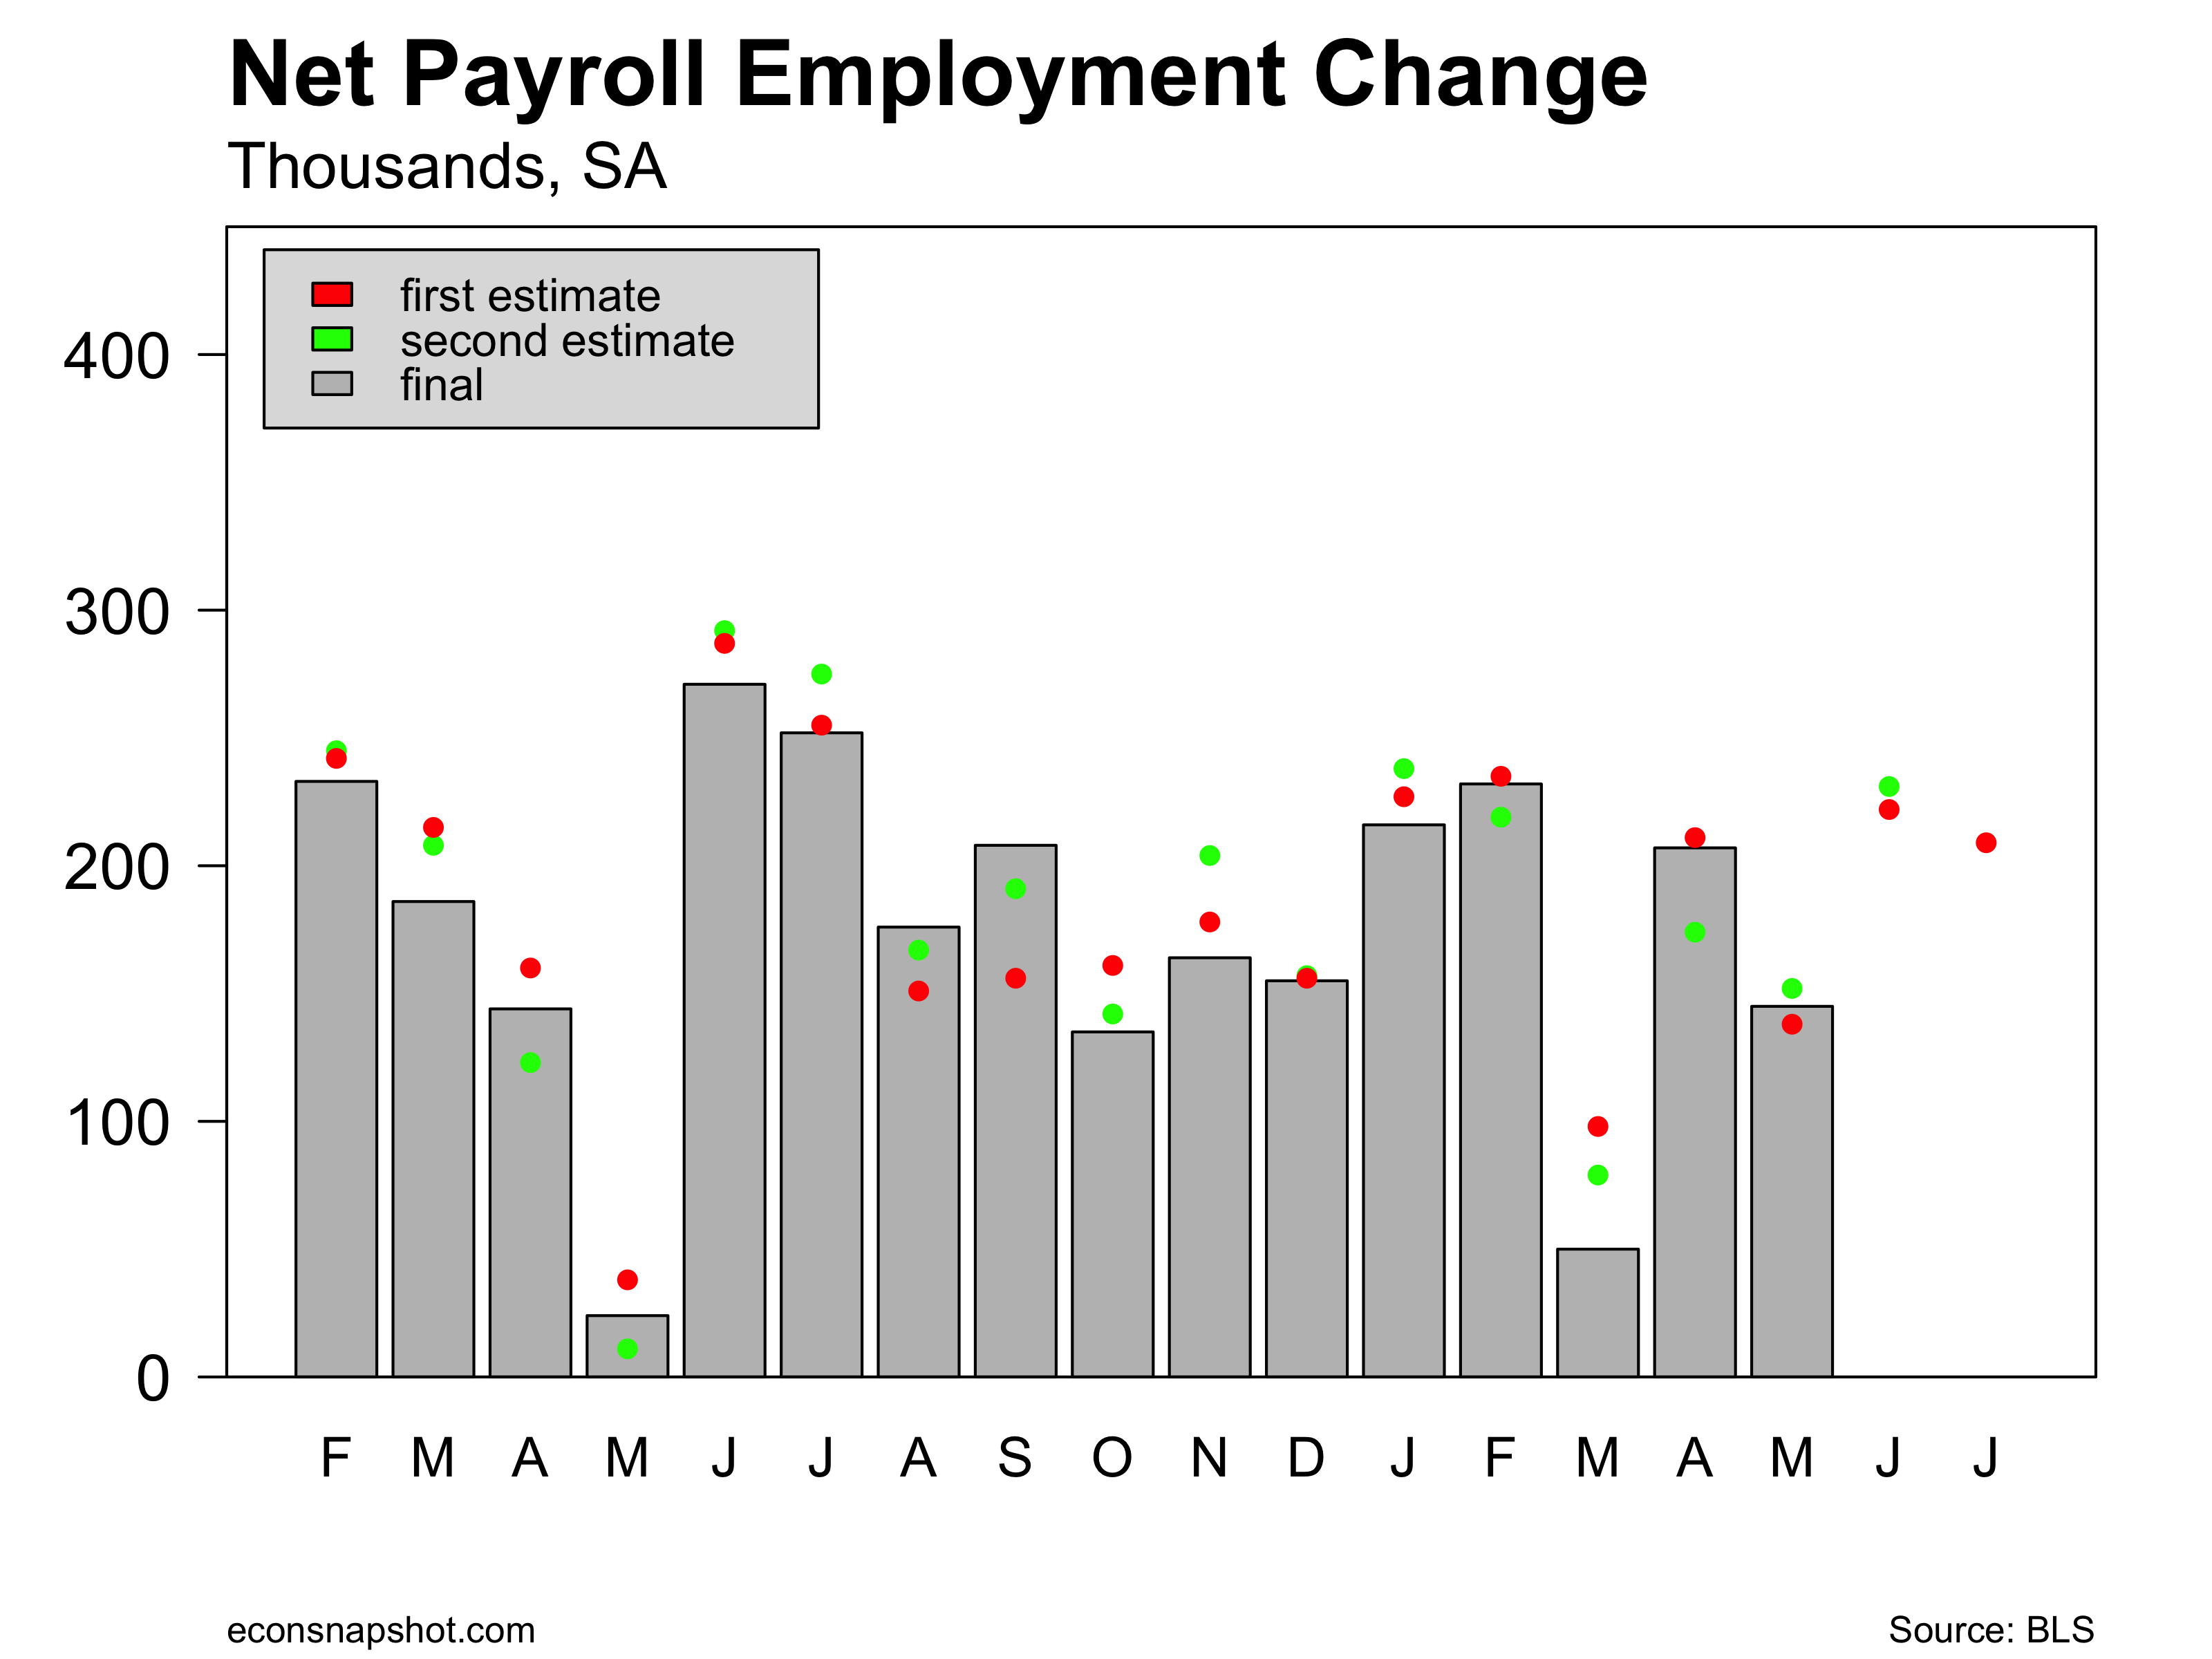
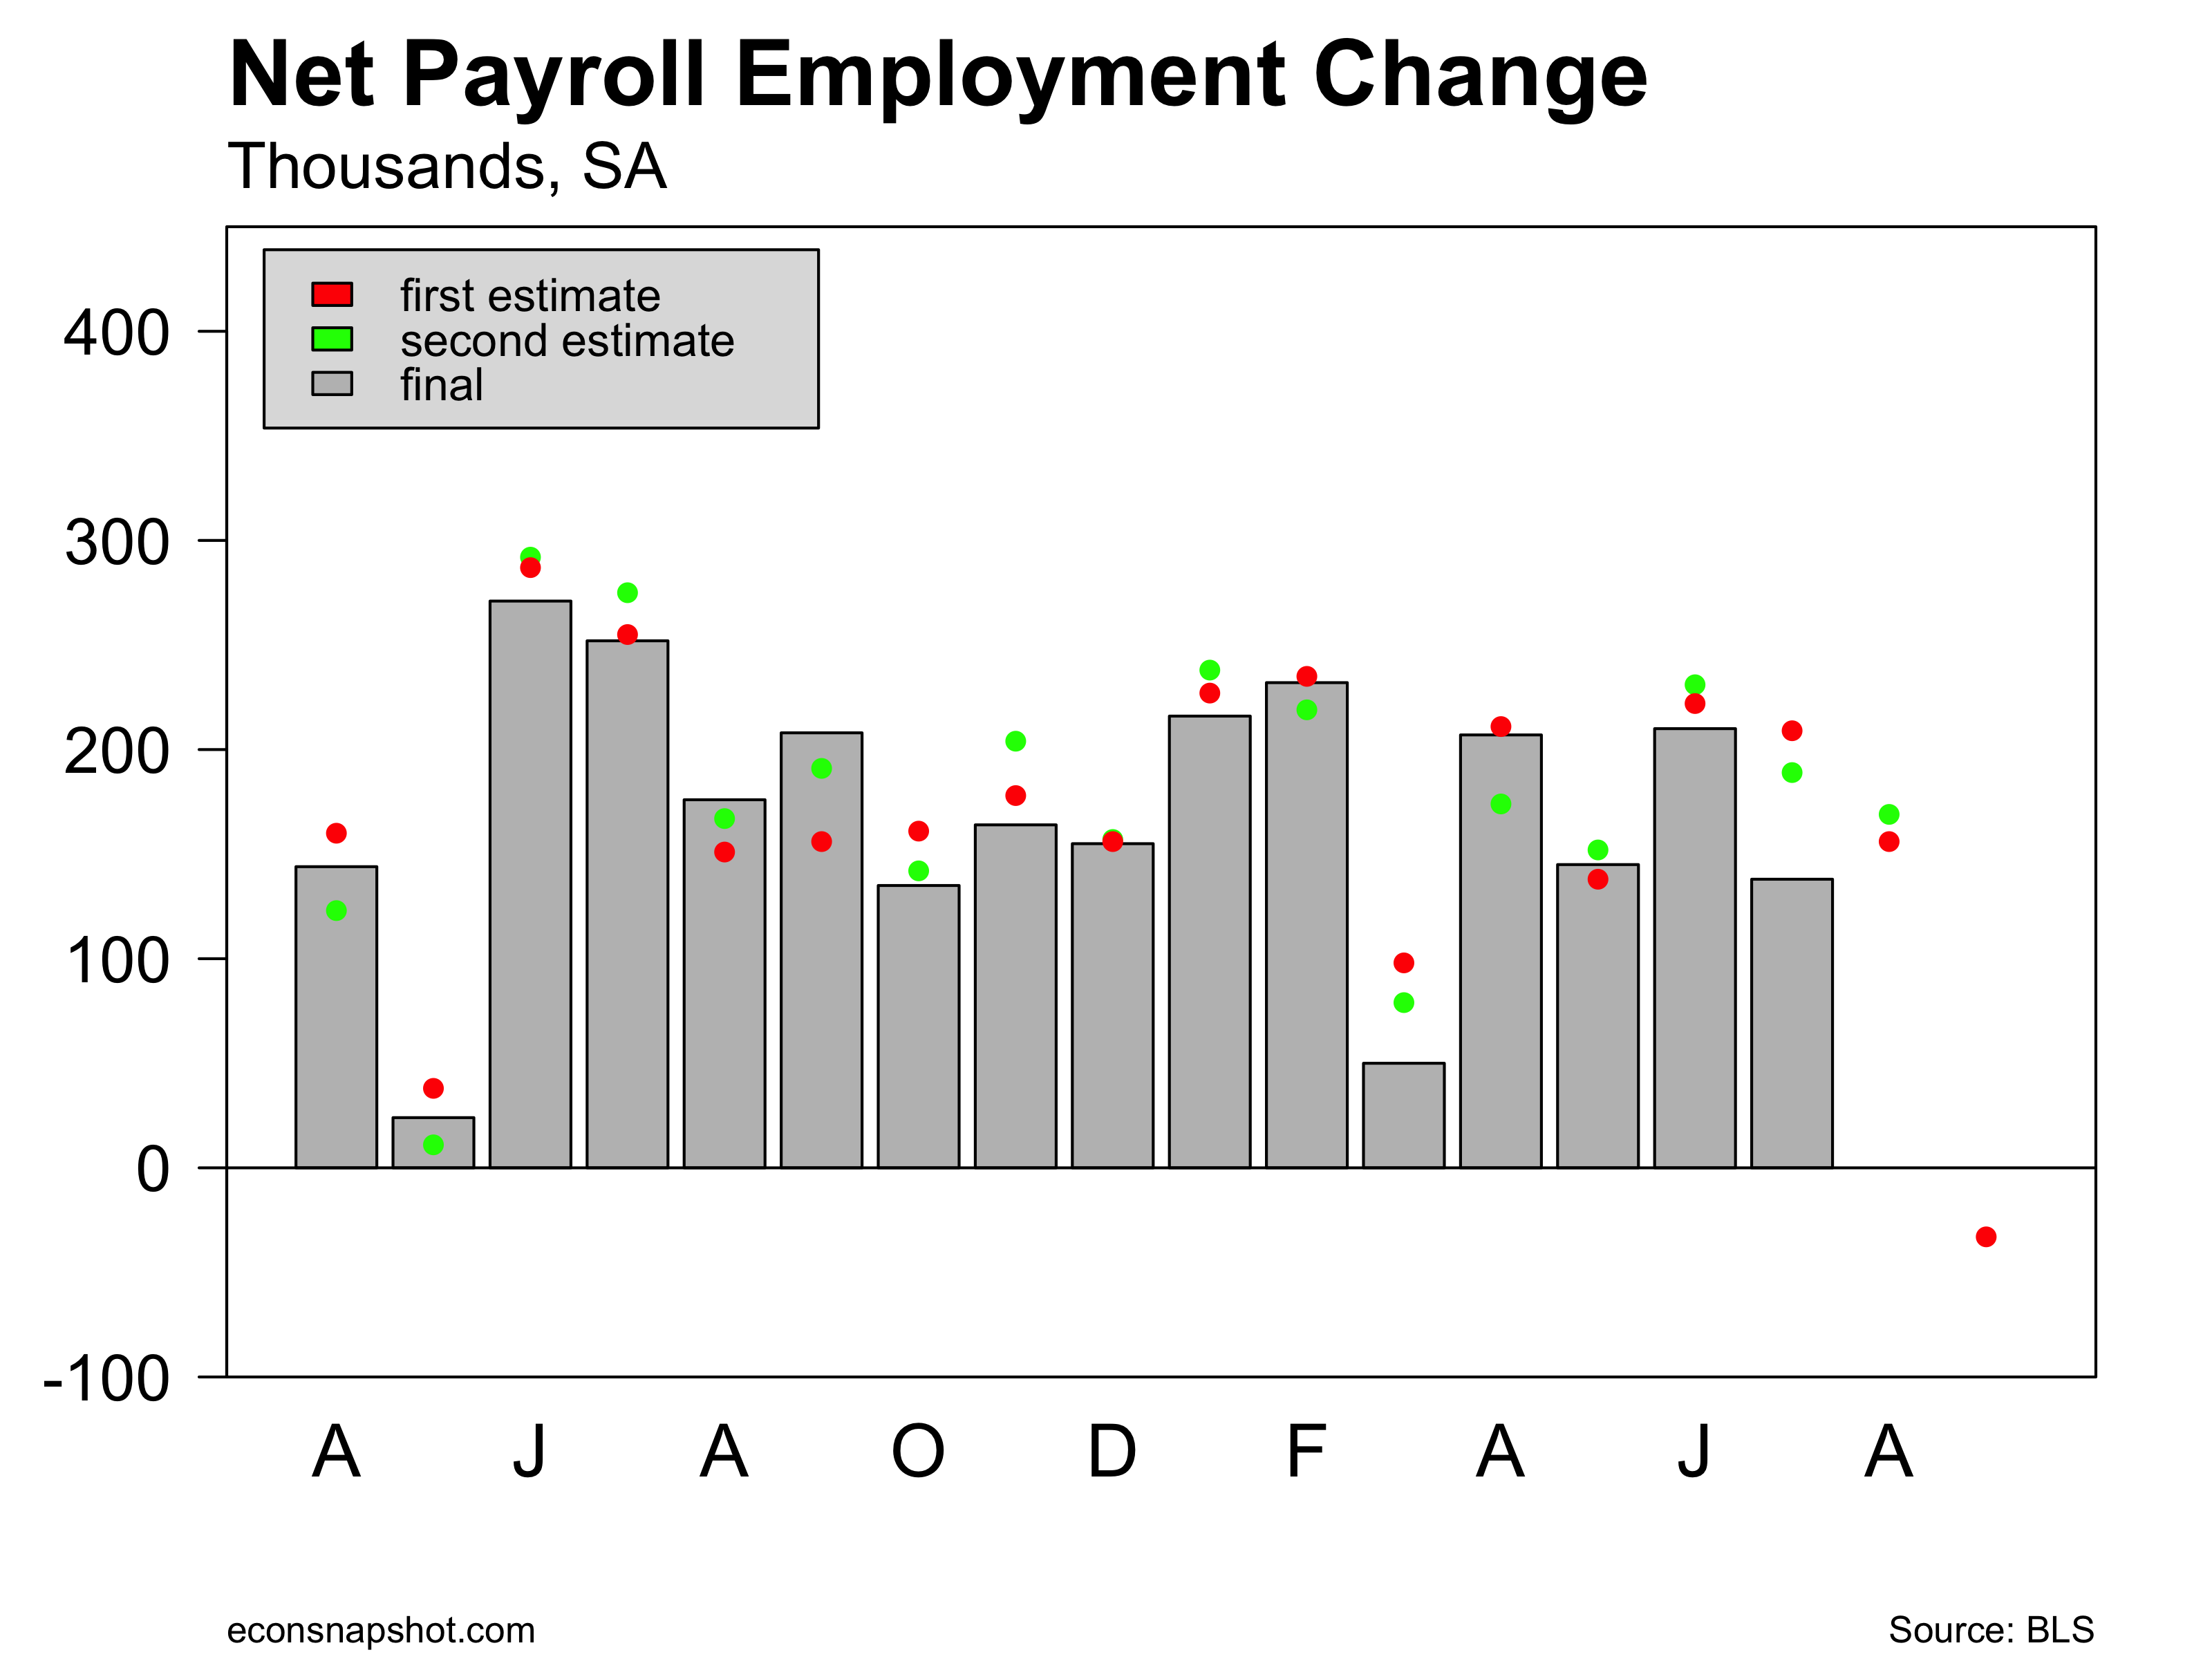
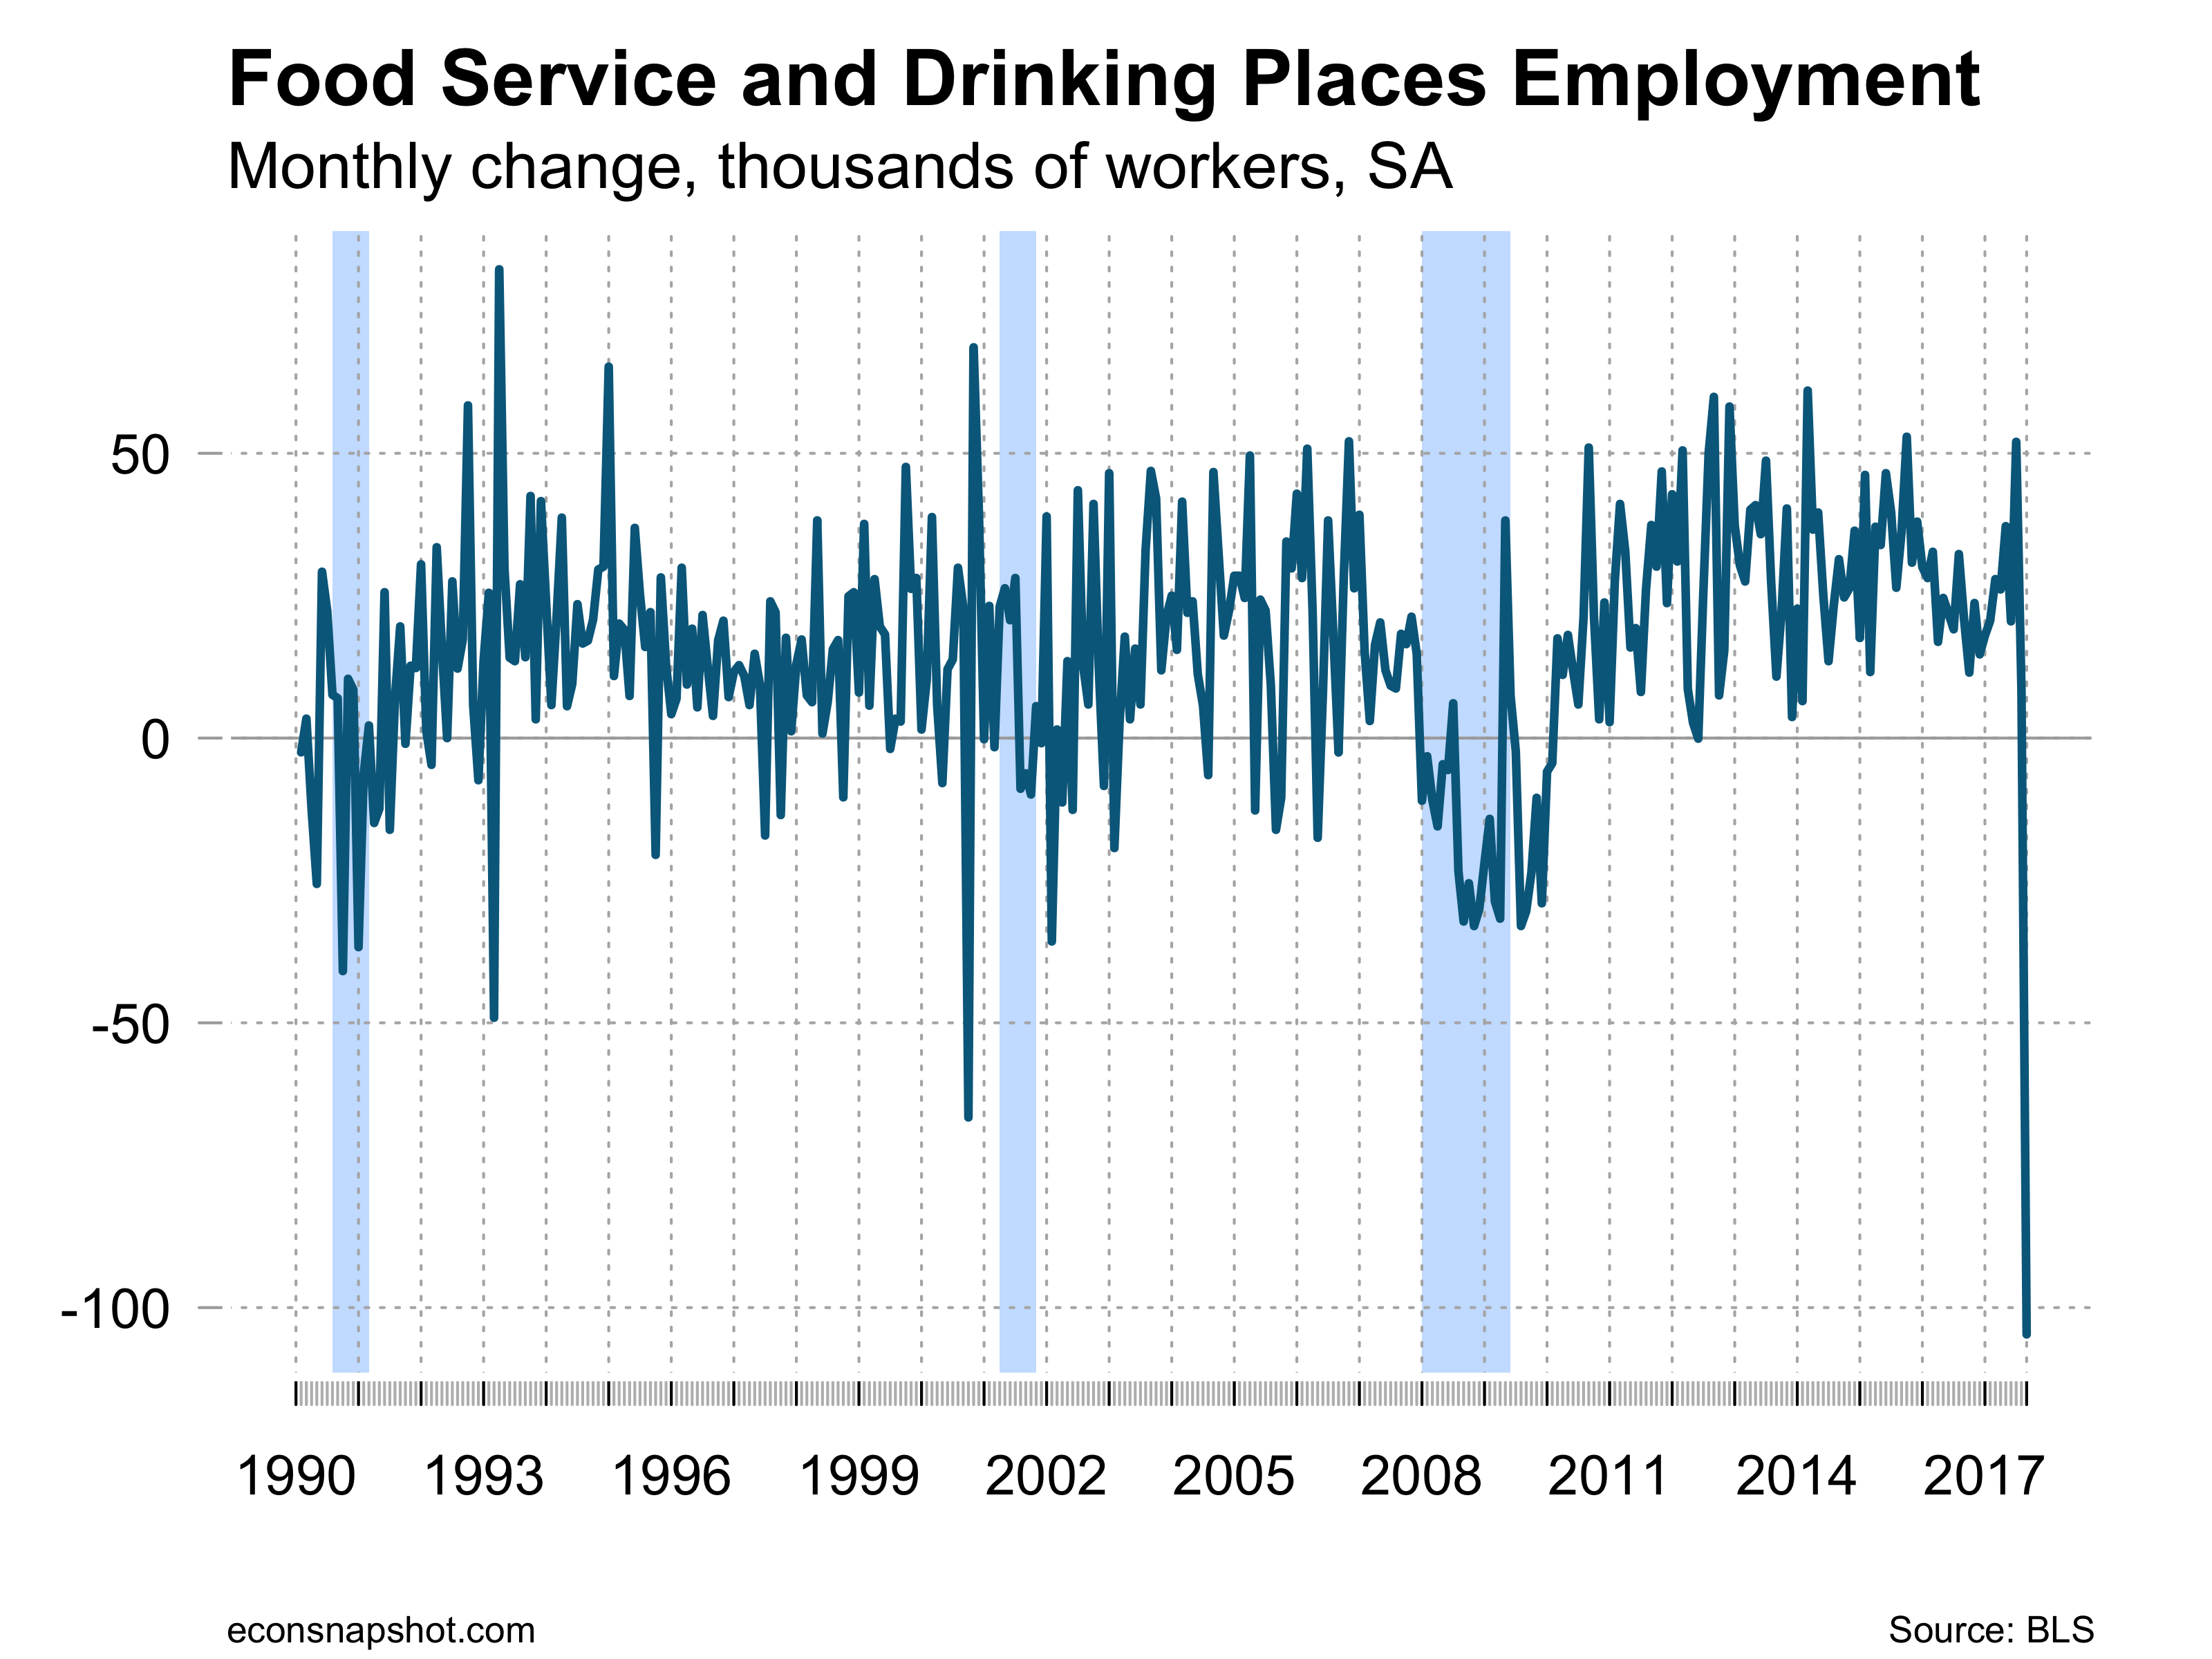
The BLS announced a 33,000 decline in in payroll employment. Employment in the food services and drinking places sector fell by 104,000. Several disruptions occurred during the past month, including hurricane Irma that occurred at the beginning of the BLS survey week. This is the first decline in employment since September, 2010 as the economy was recovering from the Great Recession. The drop in employment in food services and drinking places was the largest since the series started. This decline was largely responsible for the overall decline in payroll employment.
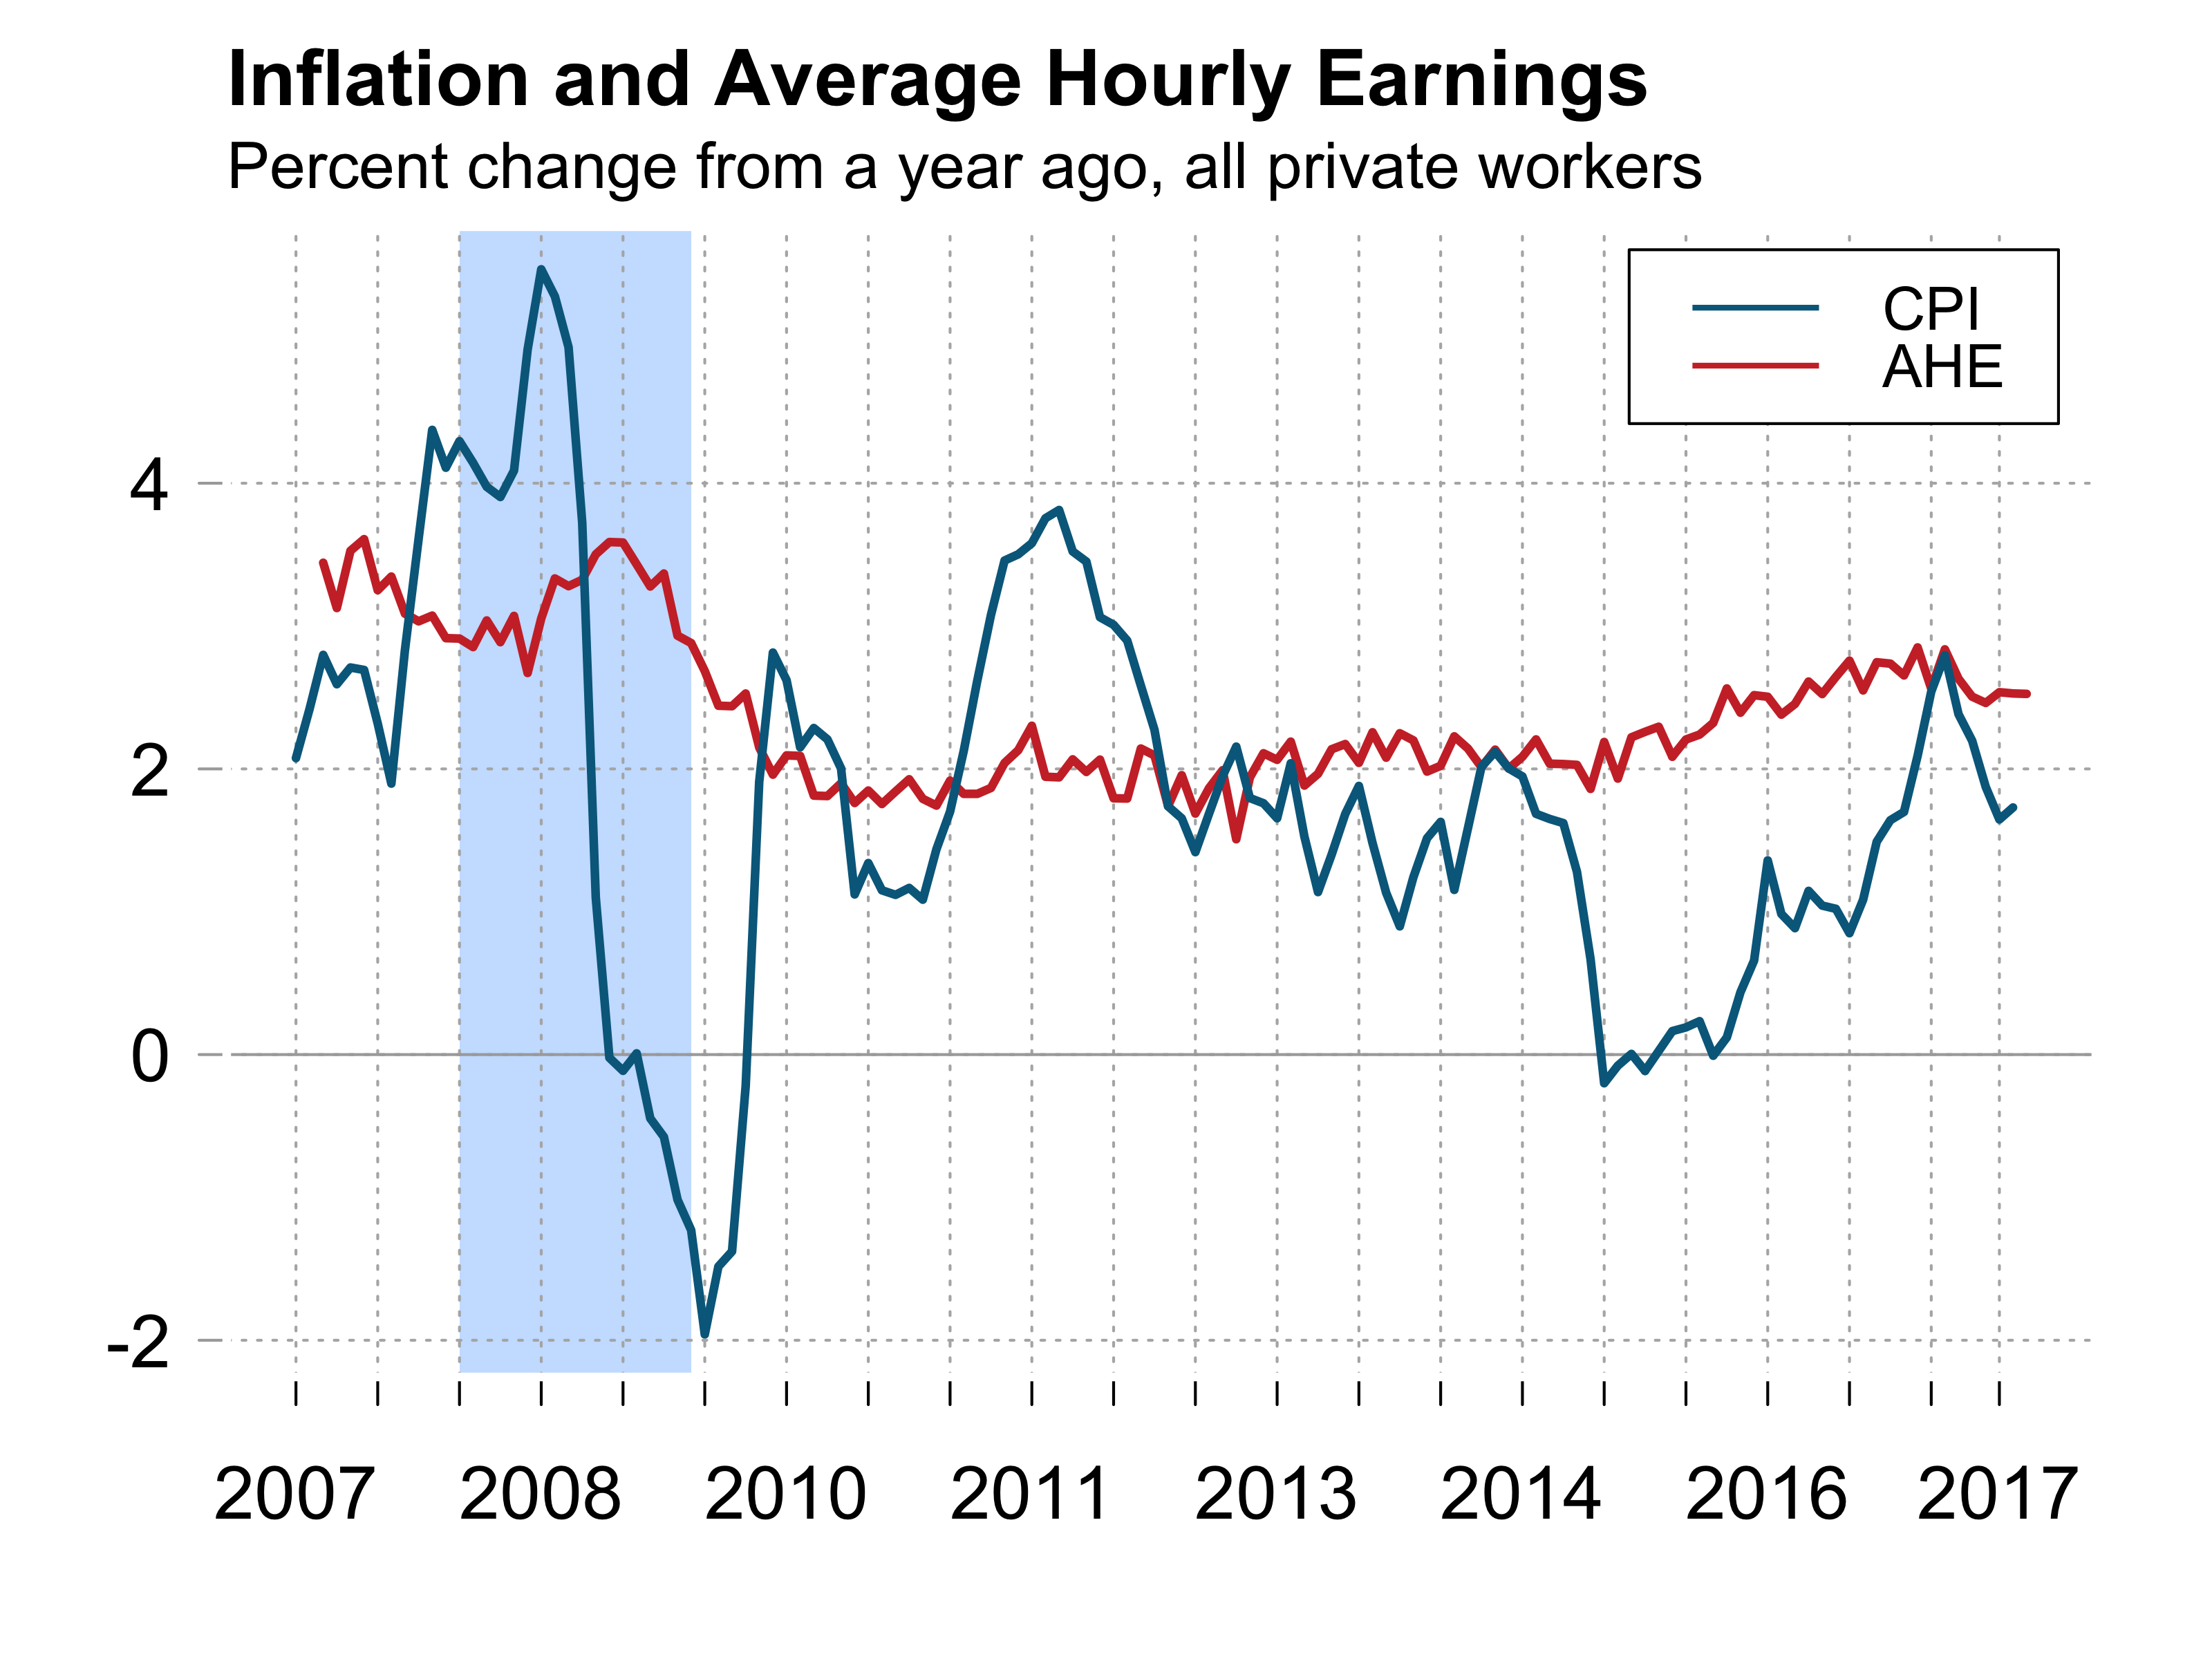
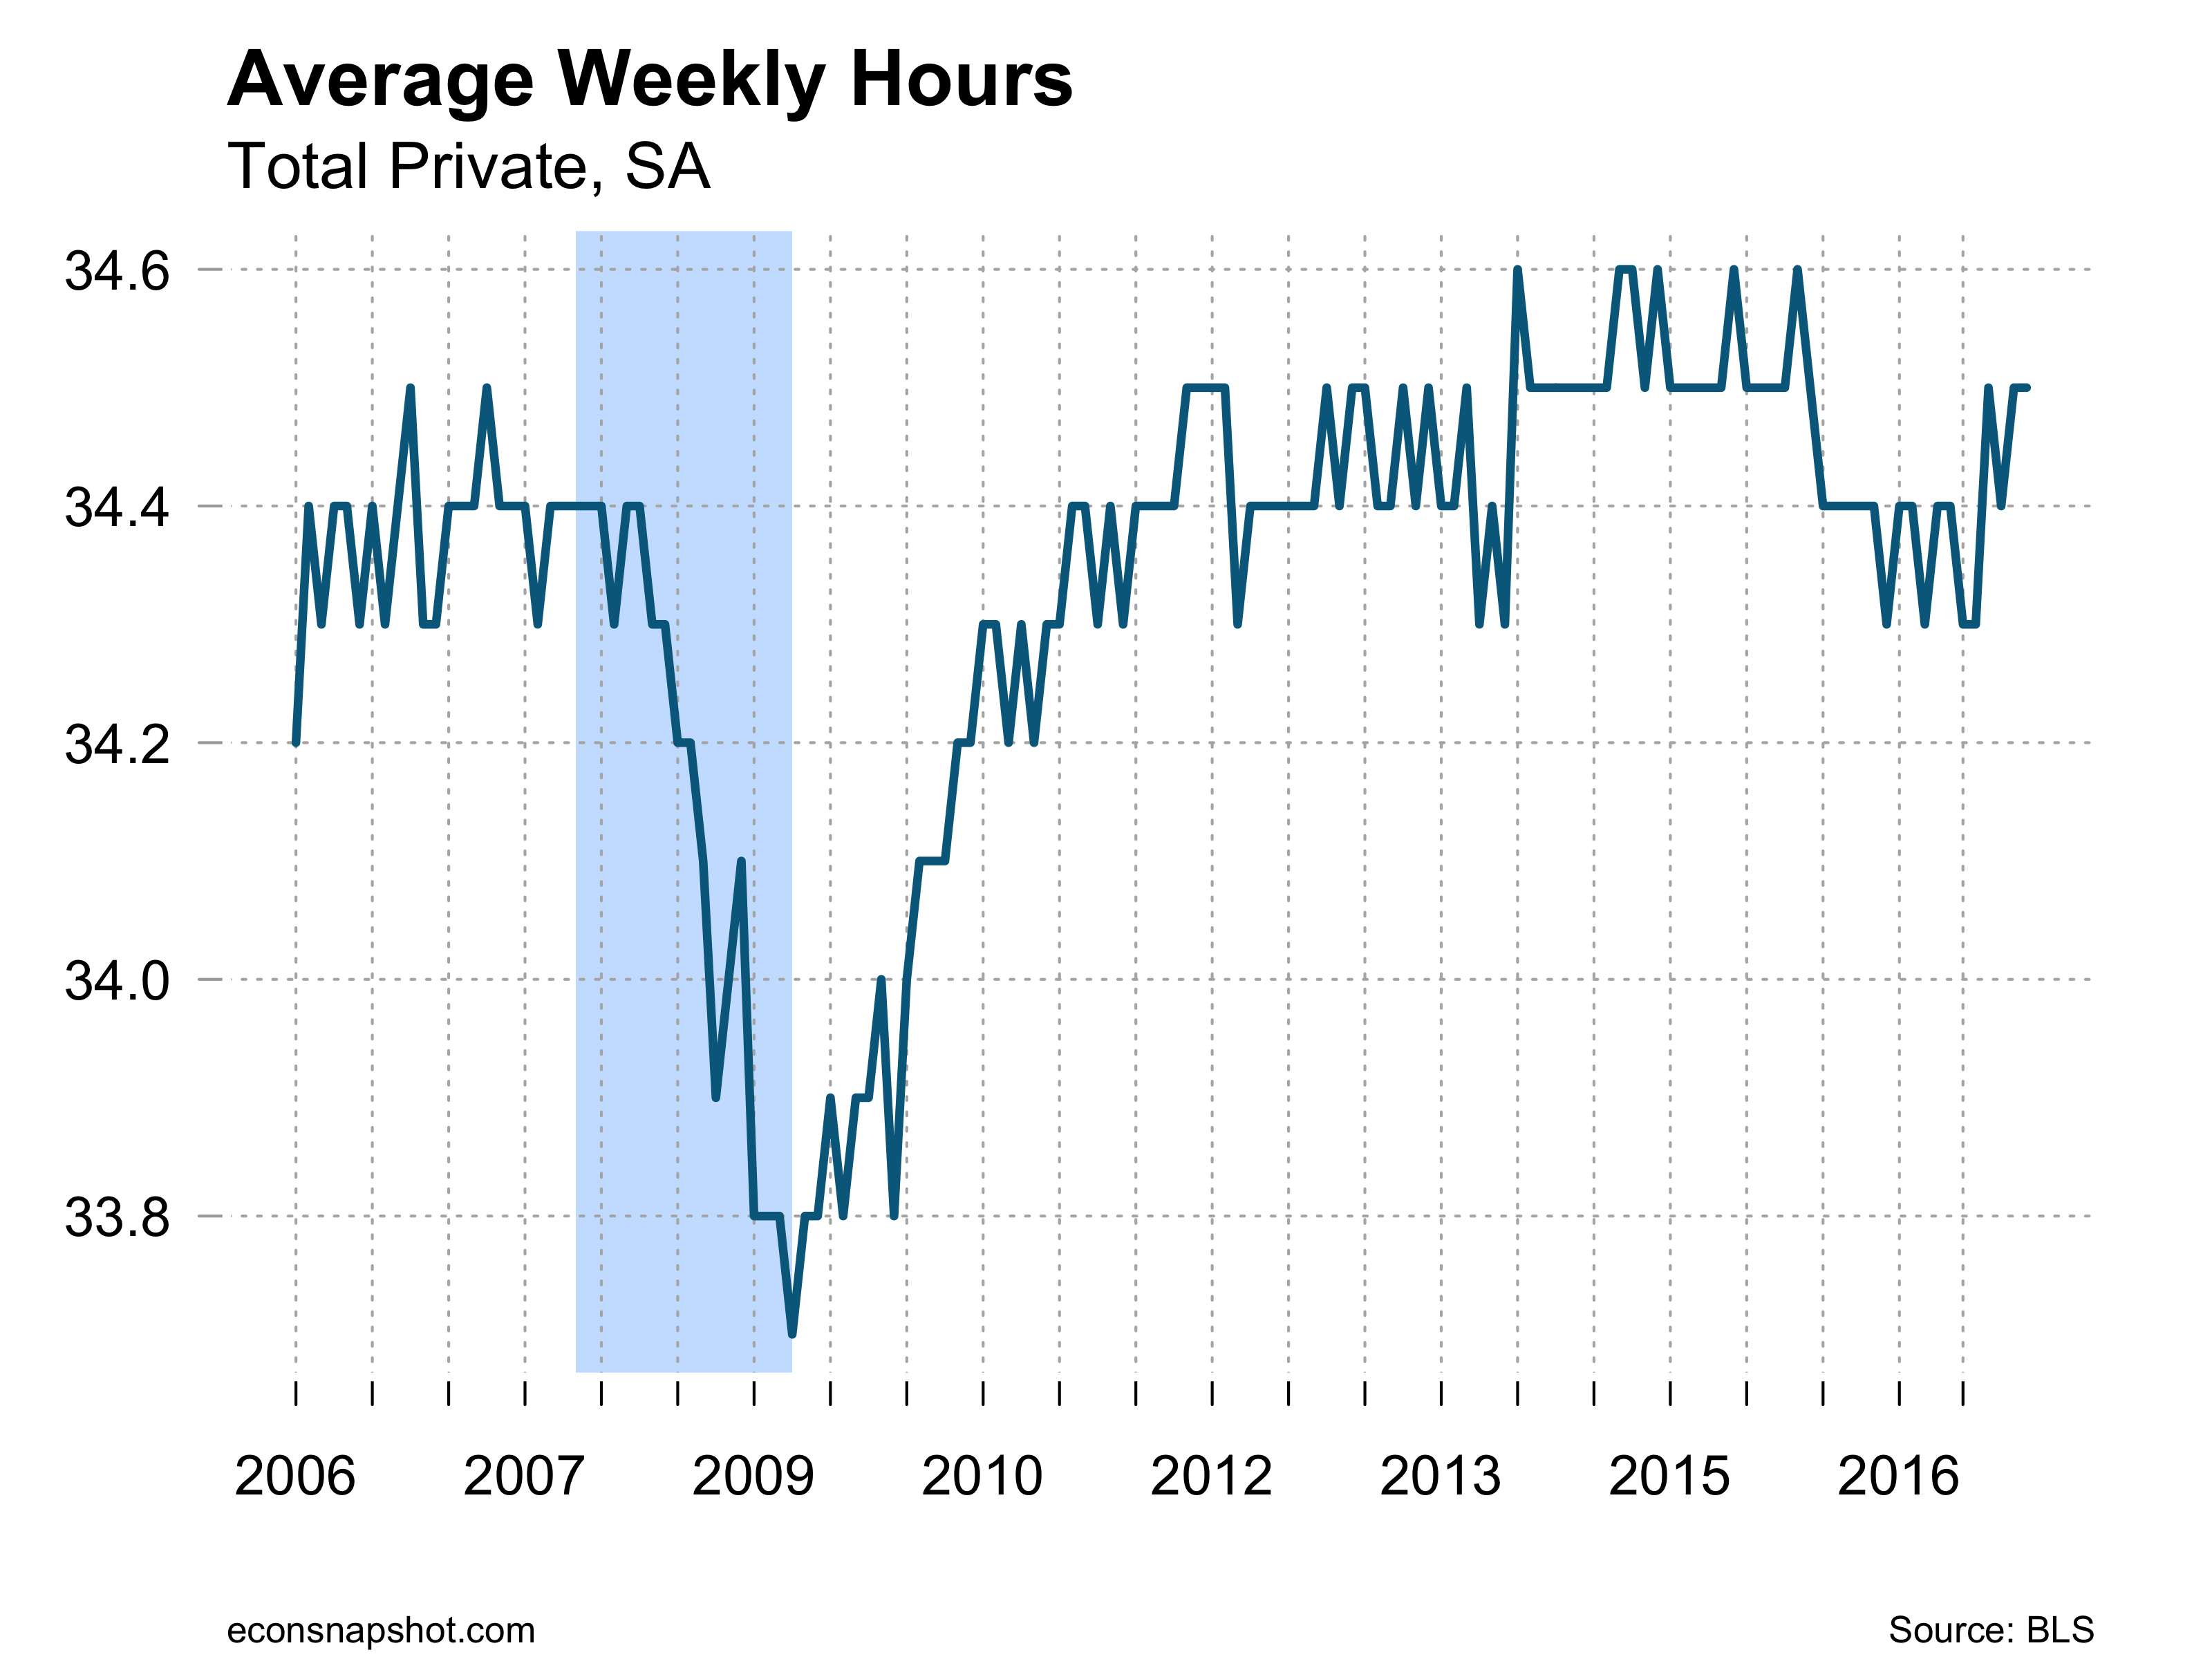
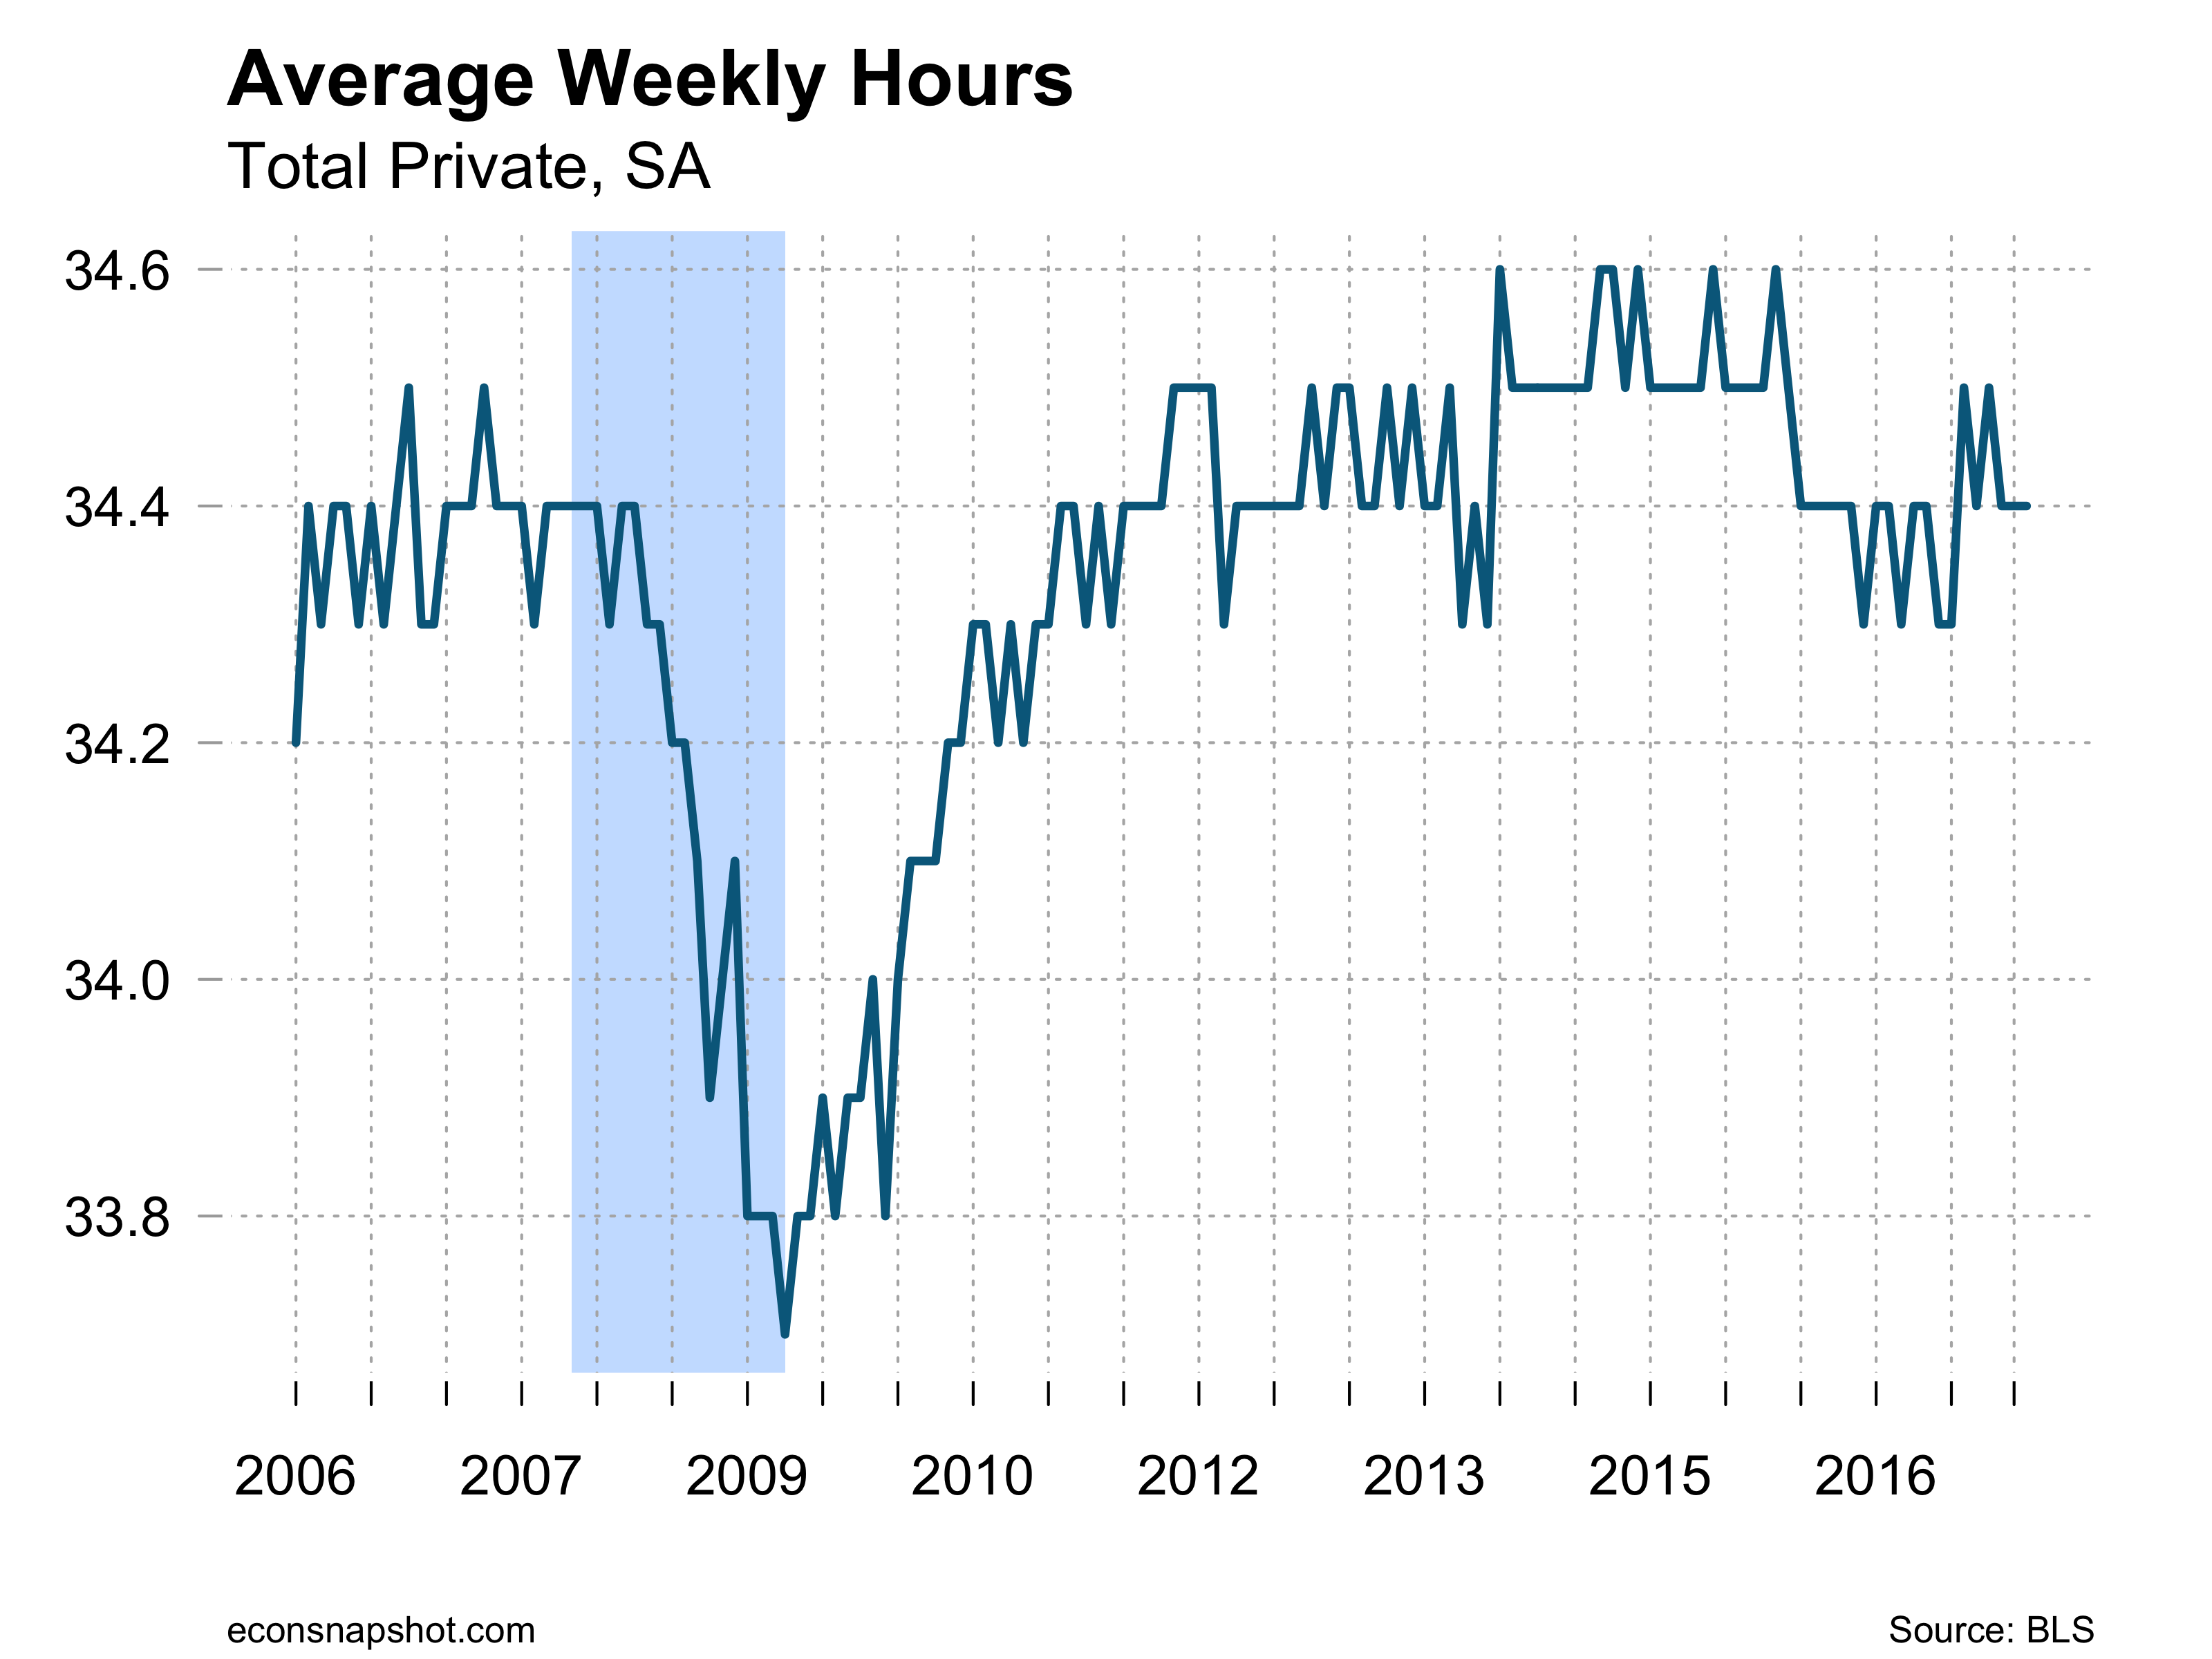
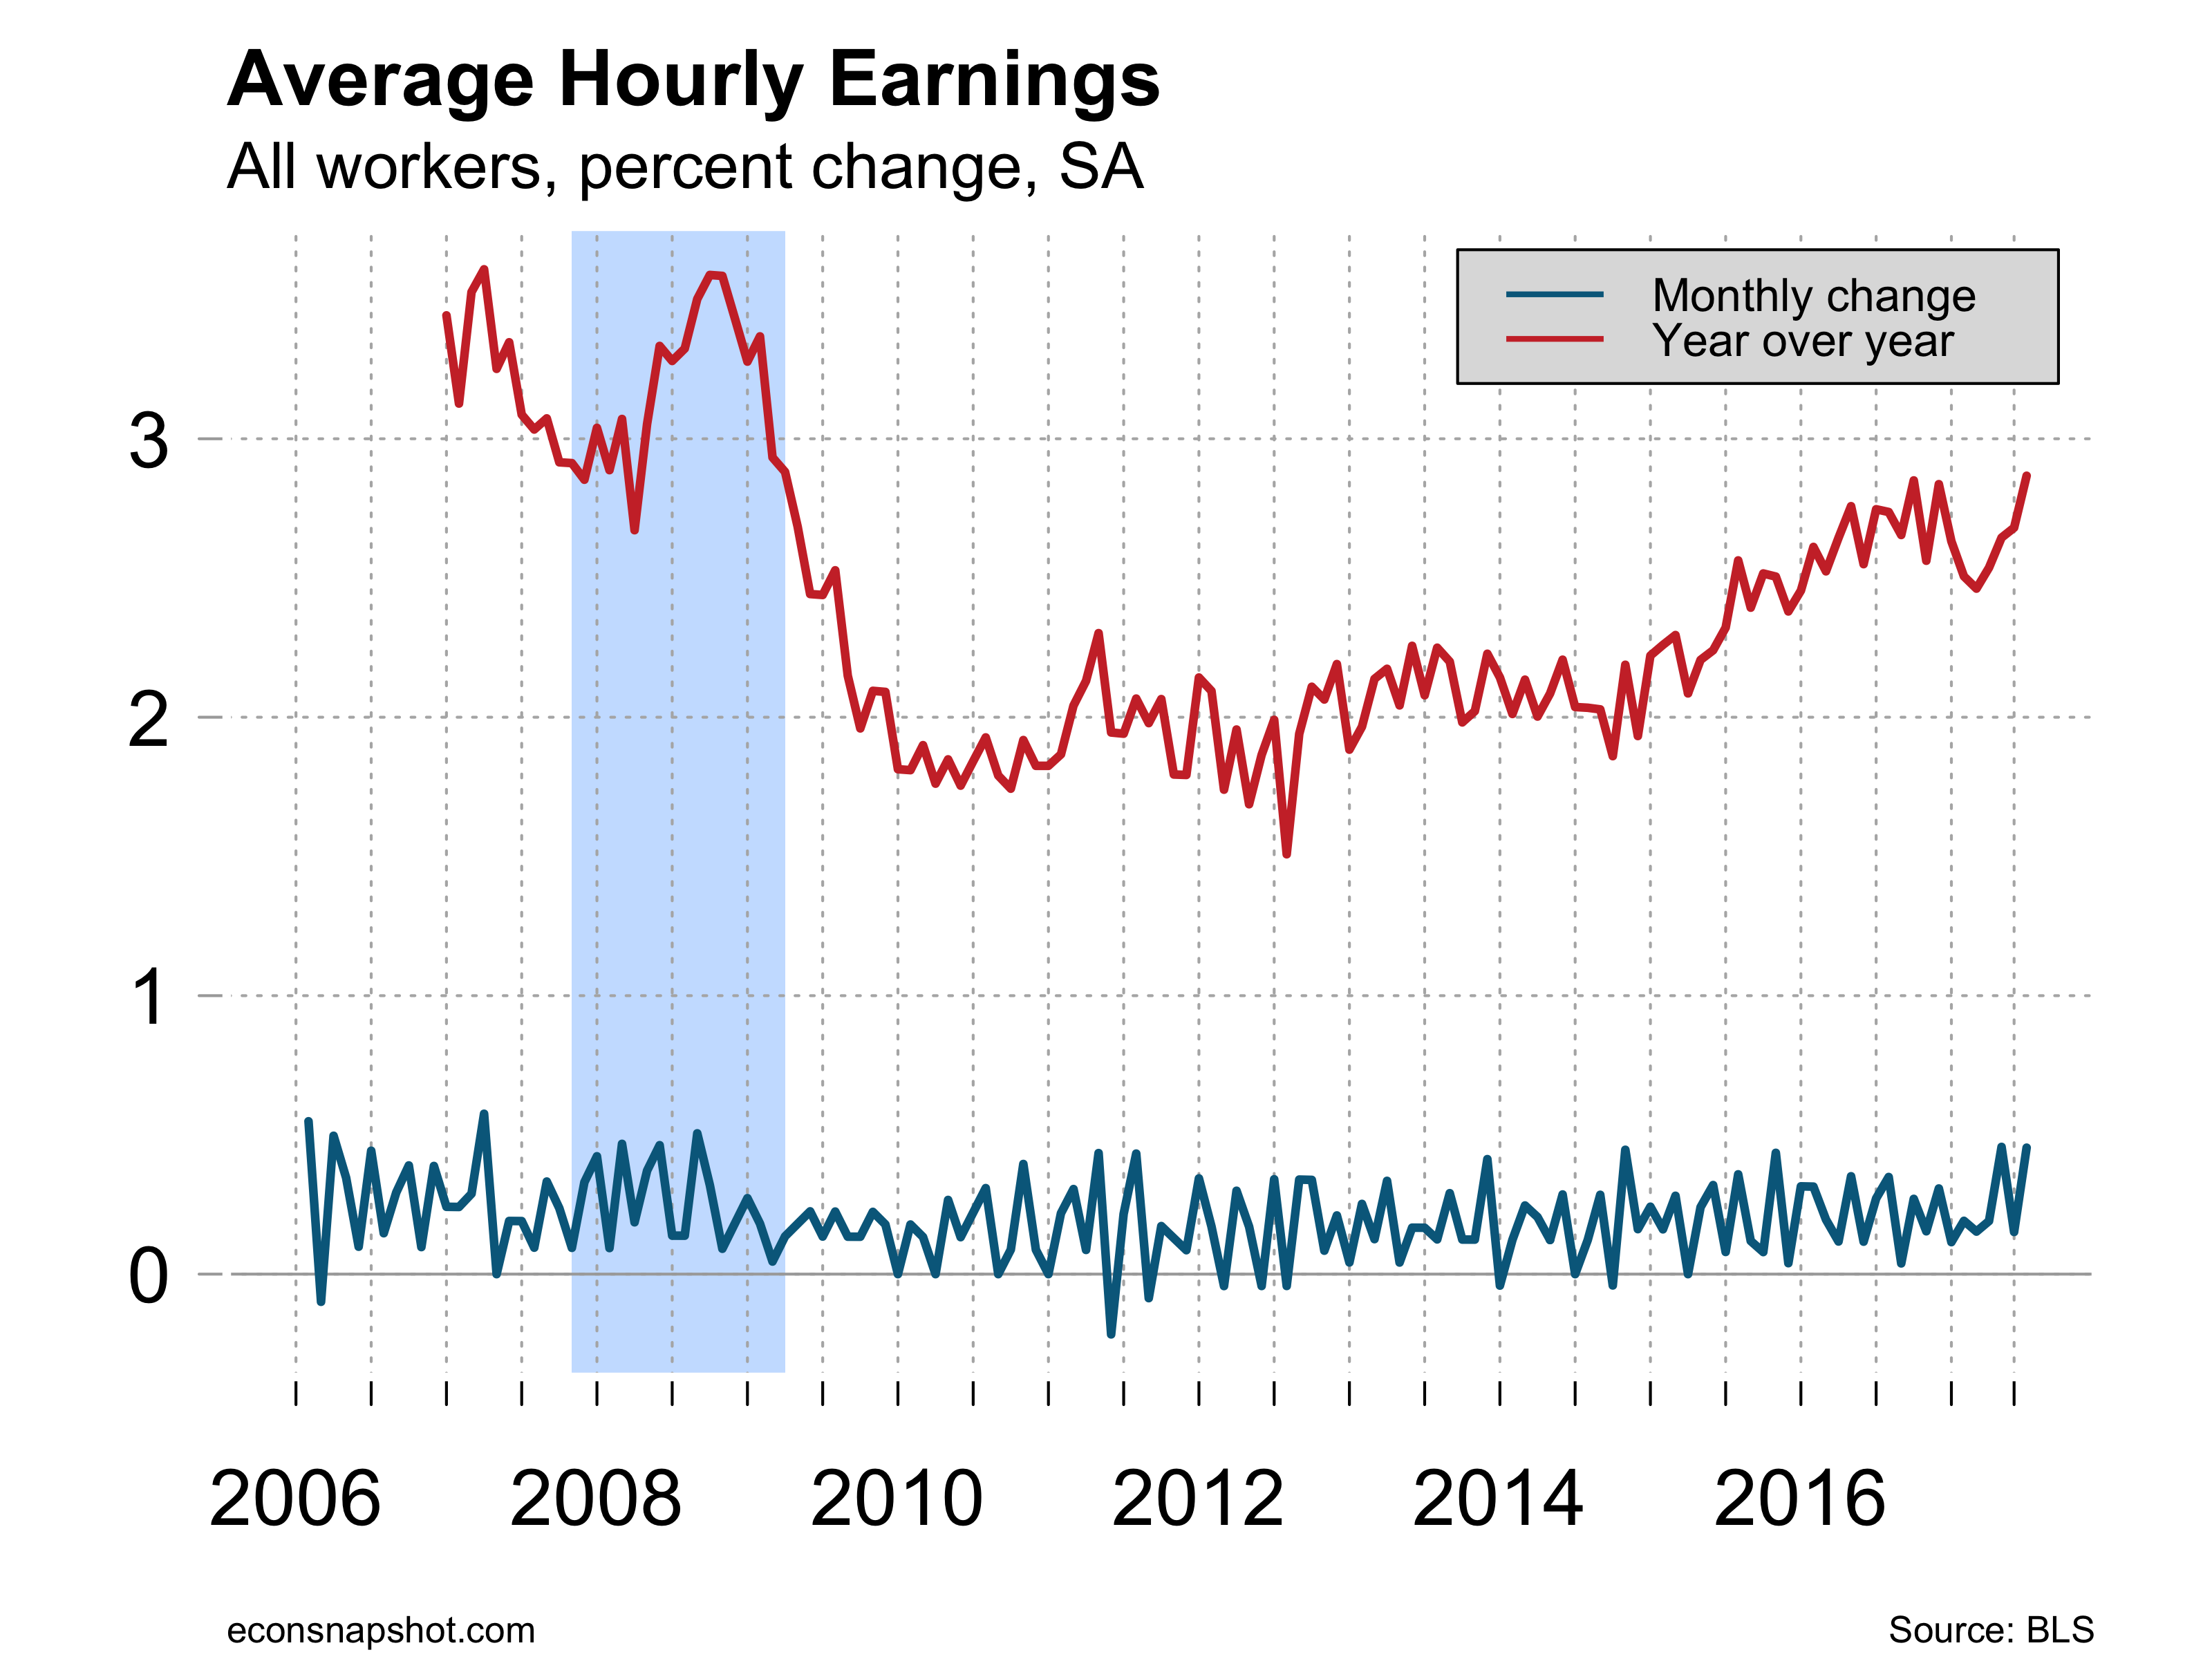
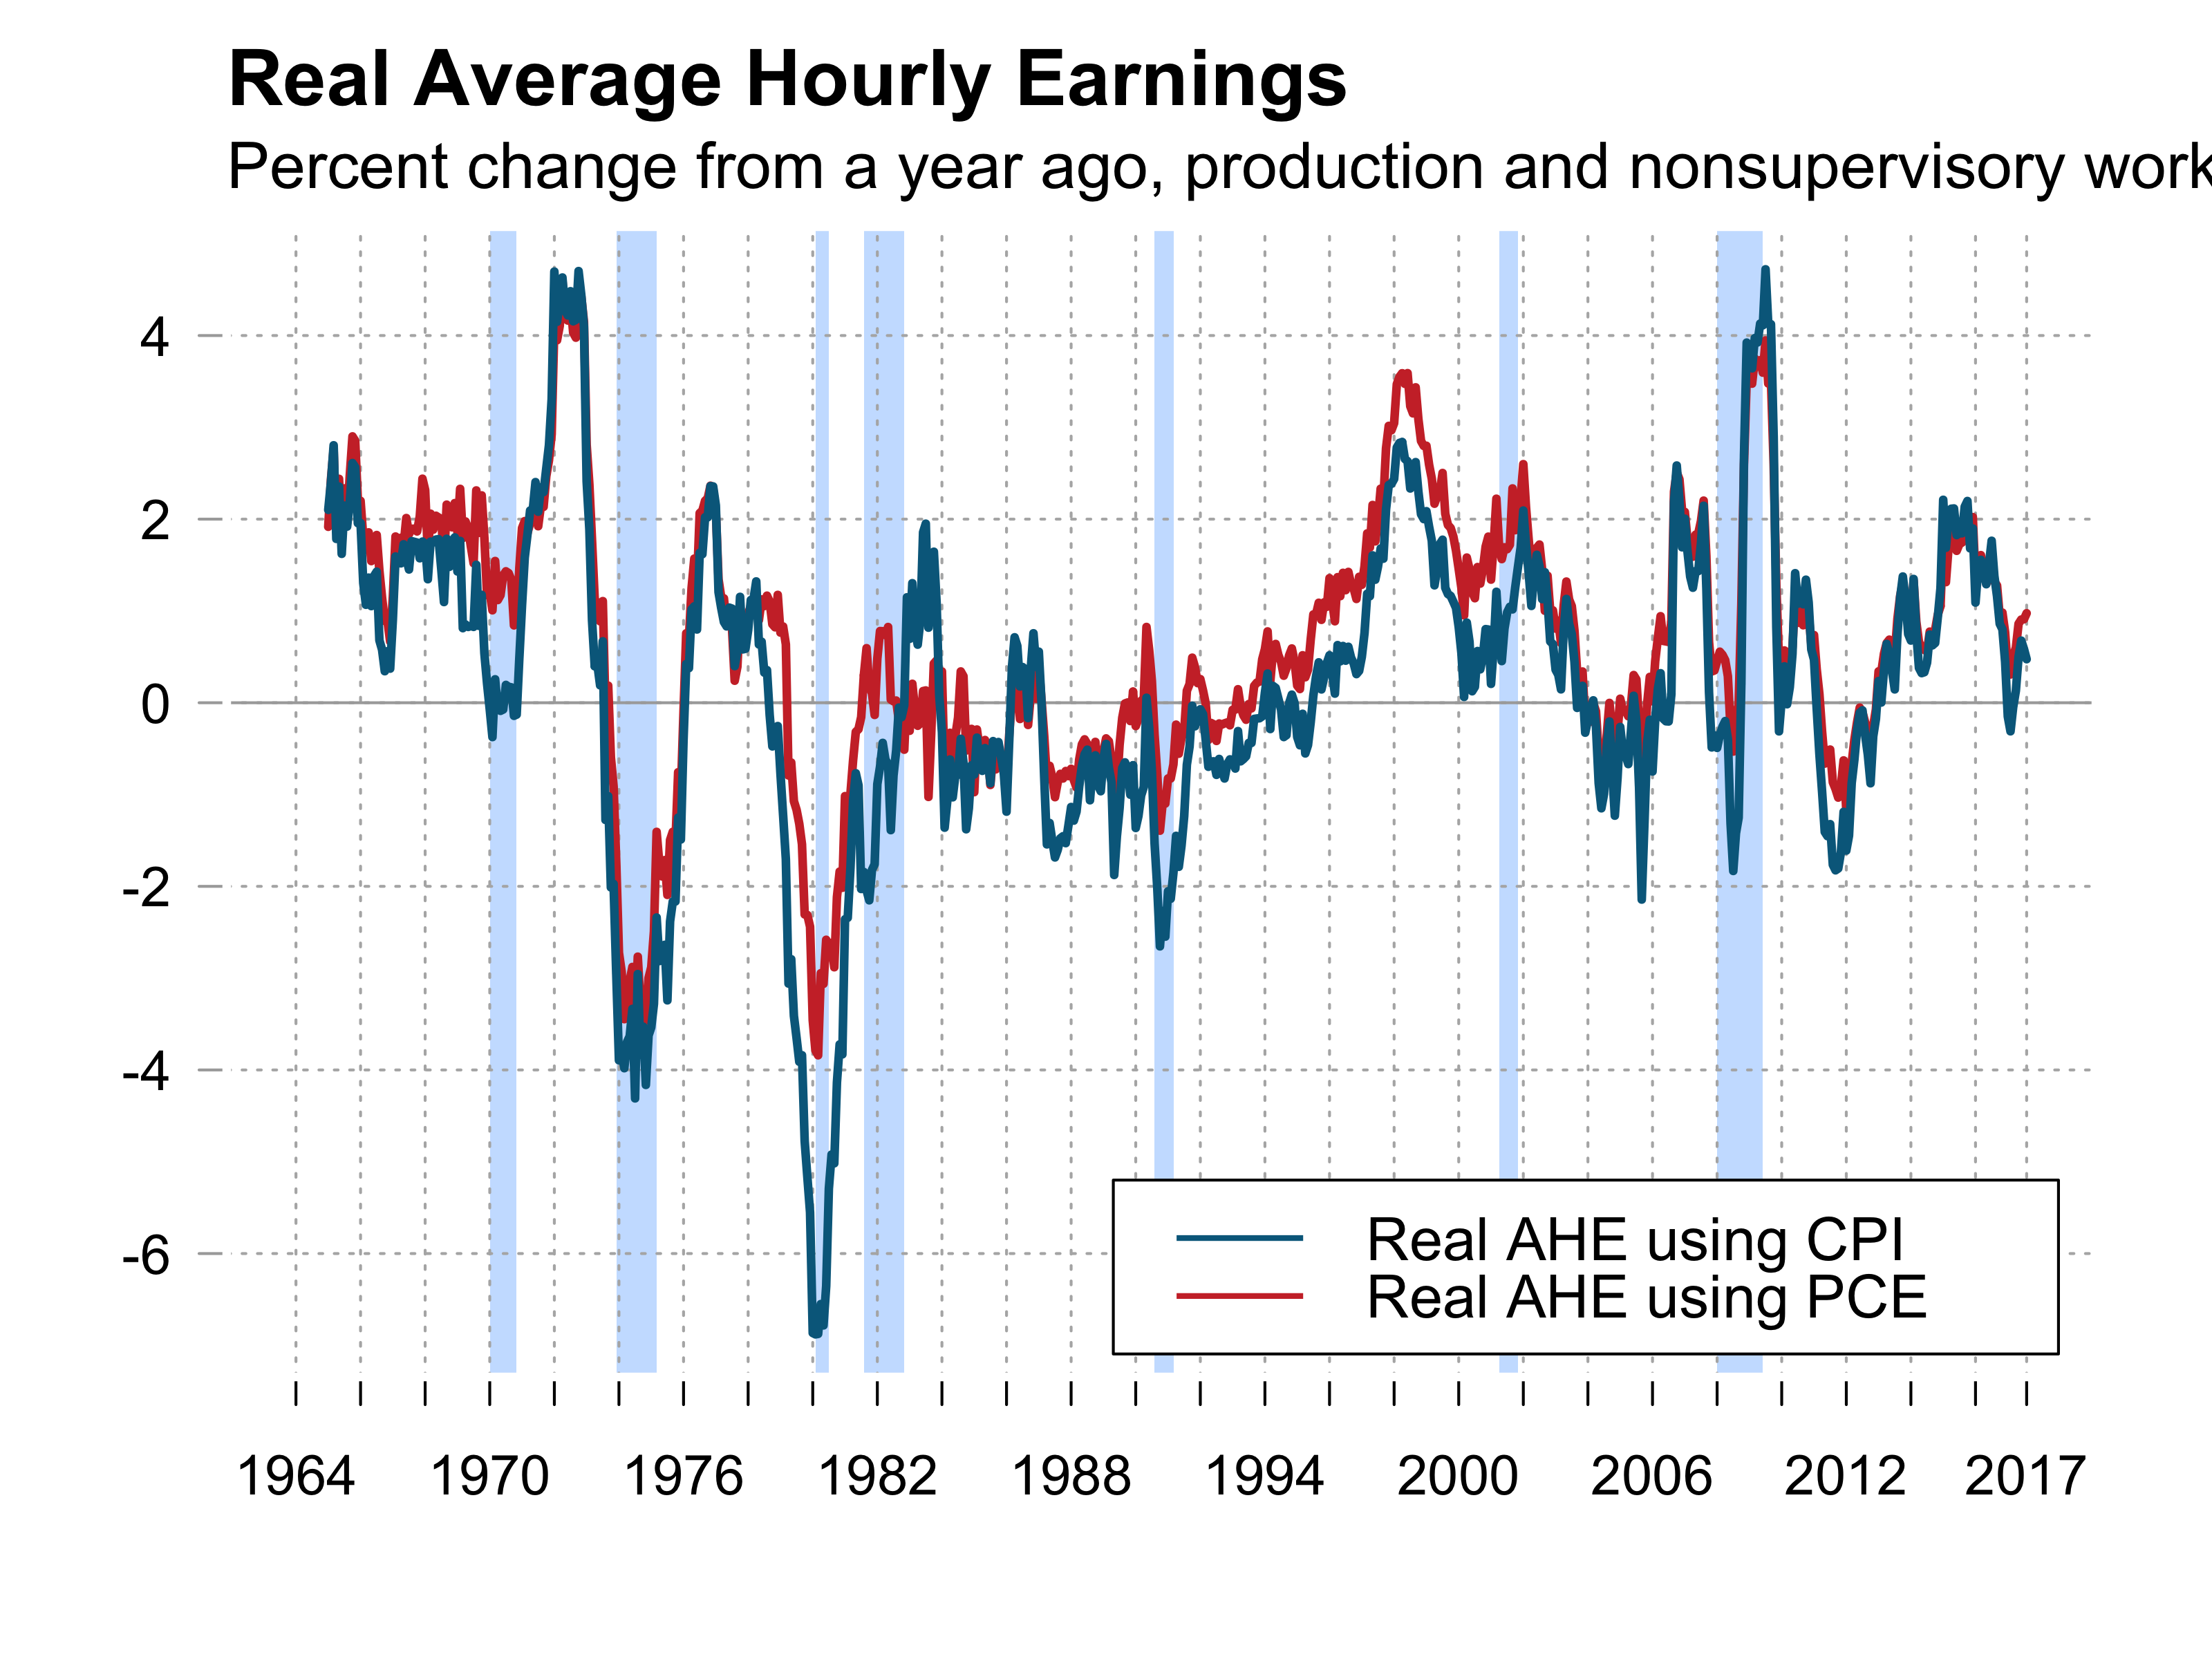
Average hours worked remained at 34.4 for the third straight month. Average hourly earnings rose 0.5% over the month and are up 2.9% year over year. Given the changes in the CPI and PCE, real earnings have grown between .5% and 1%, respectively.
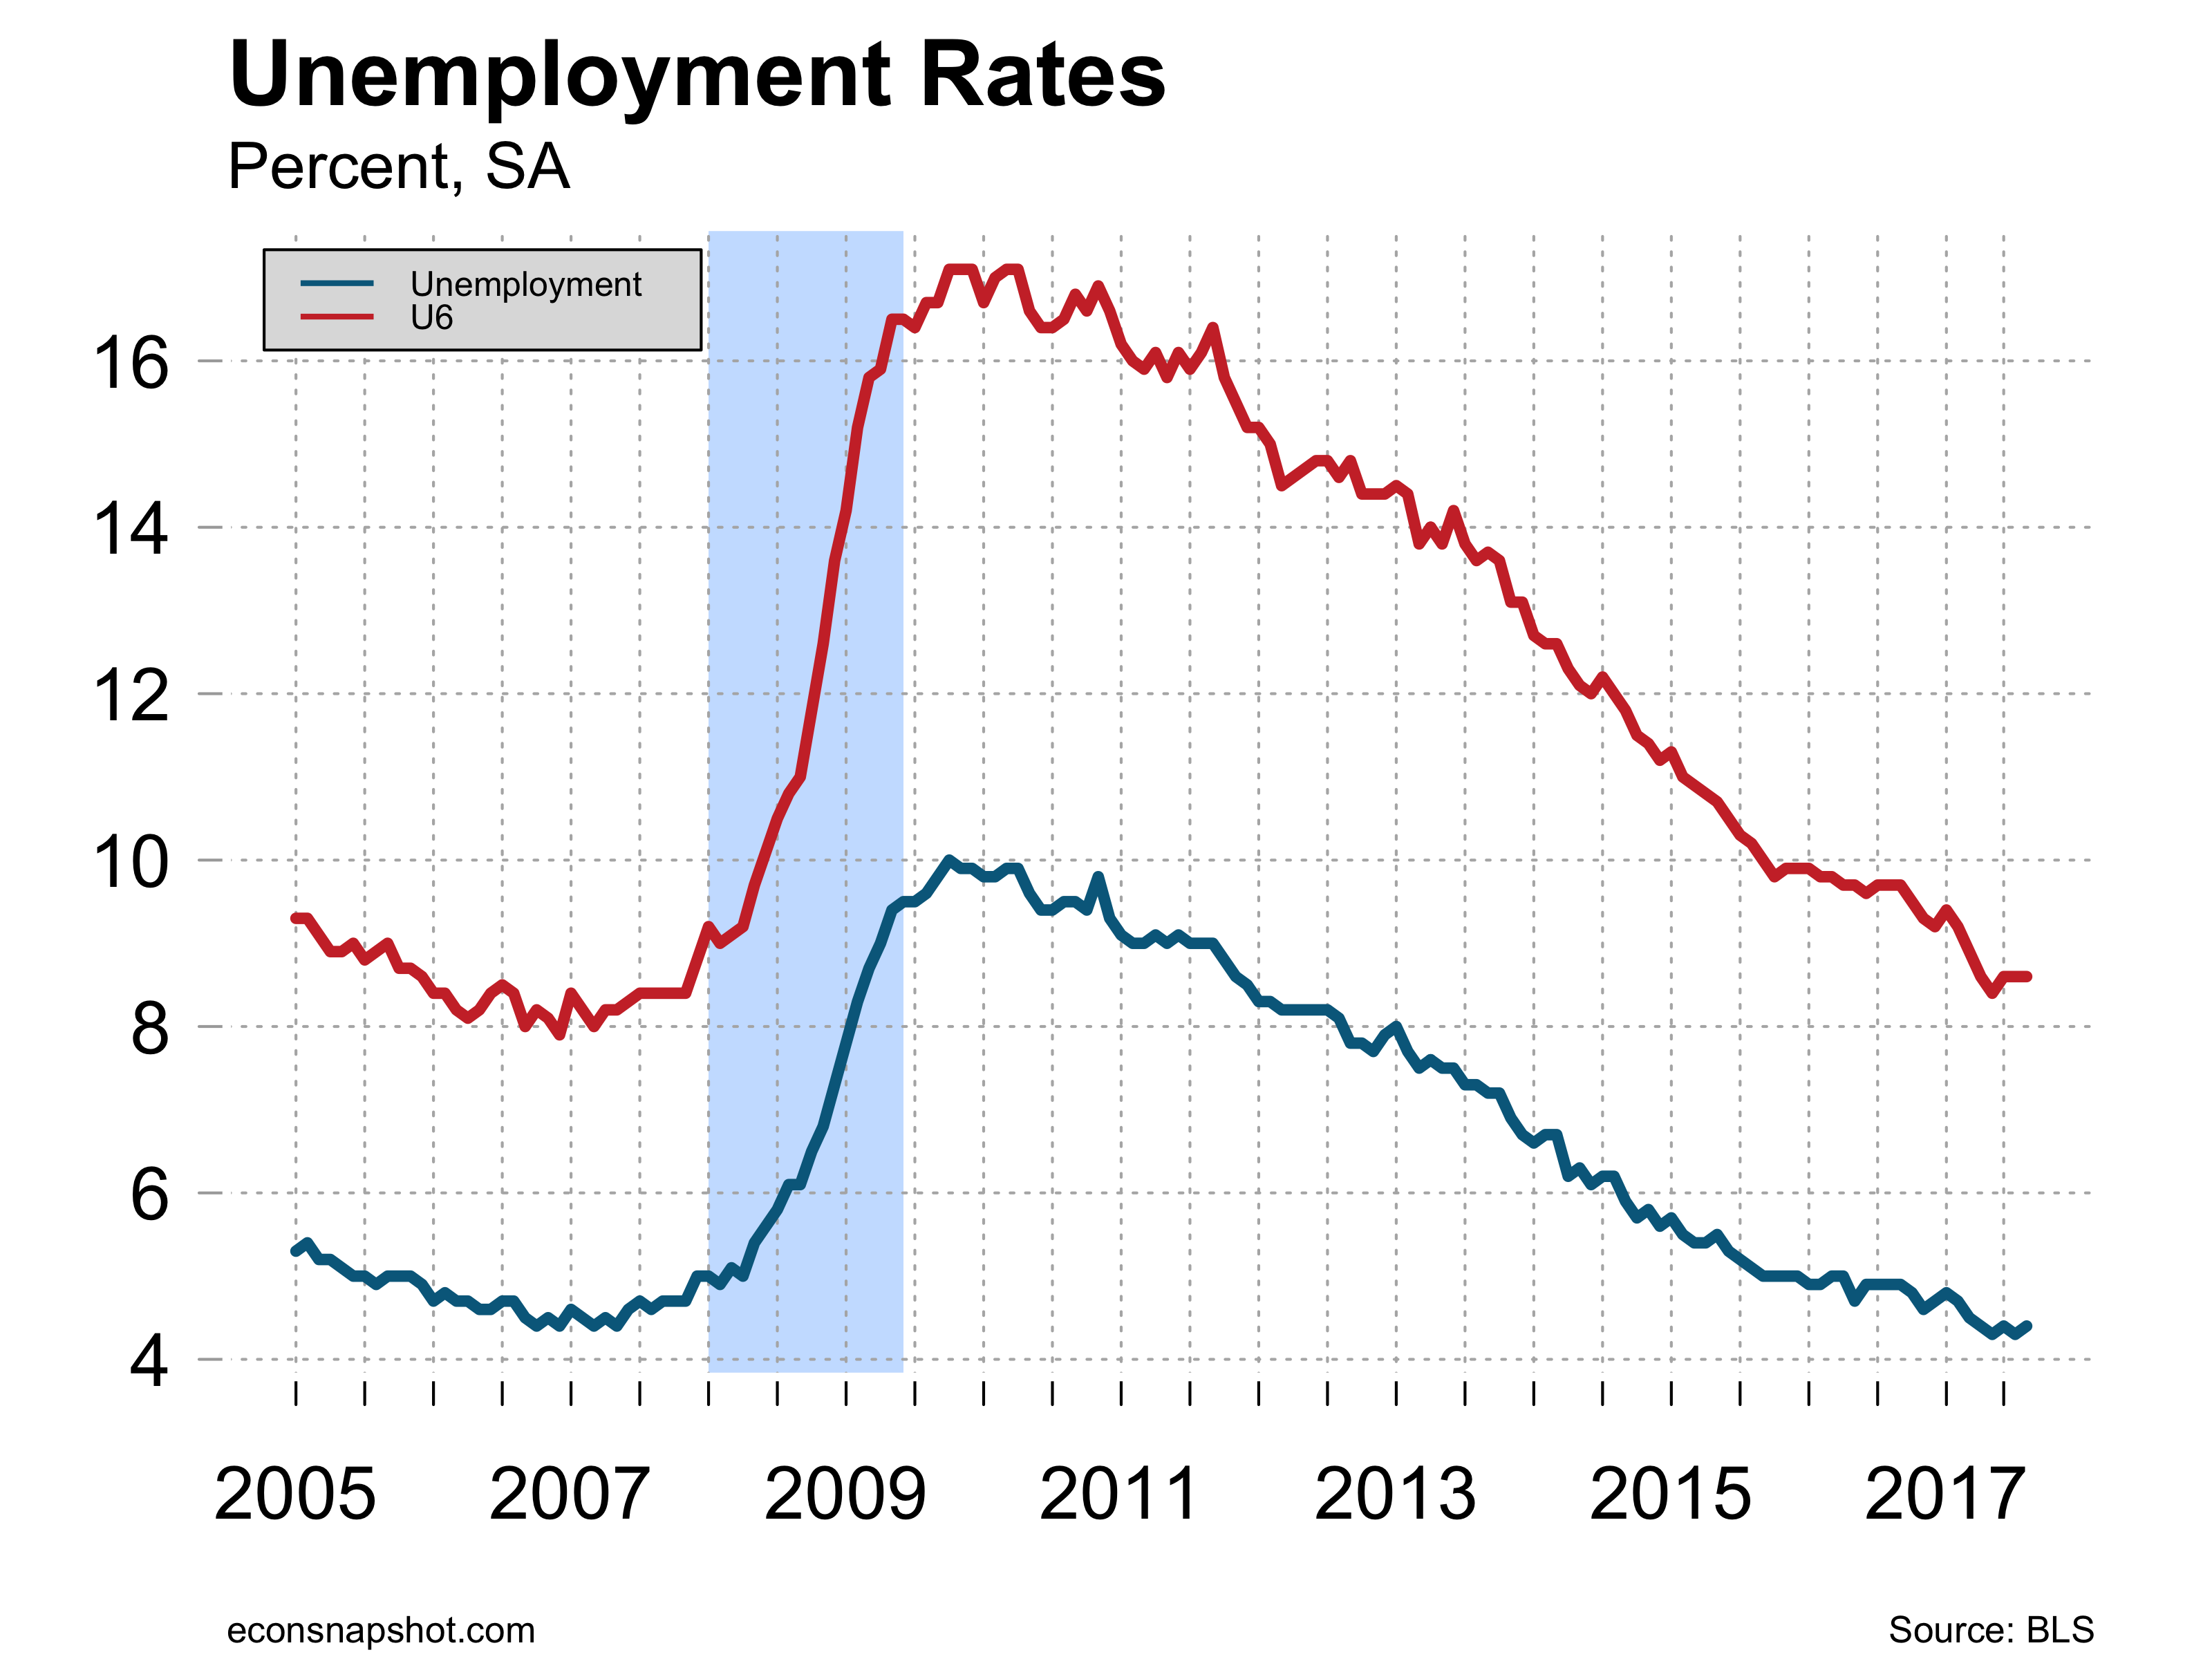
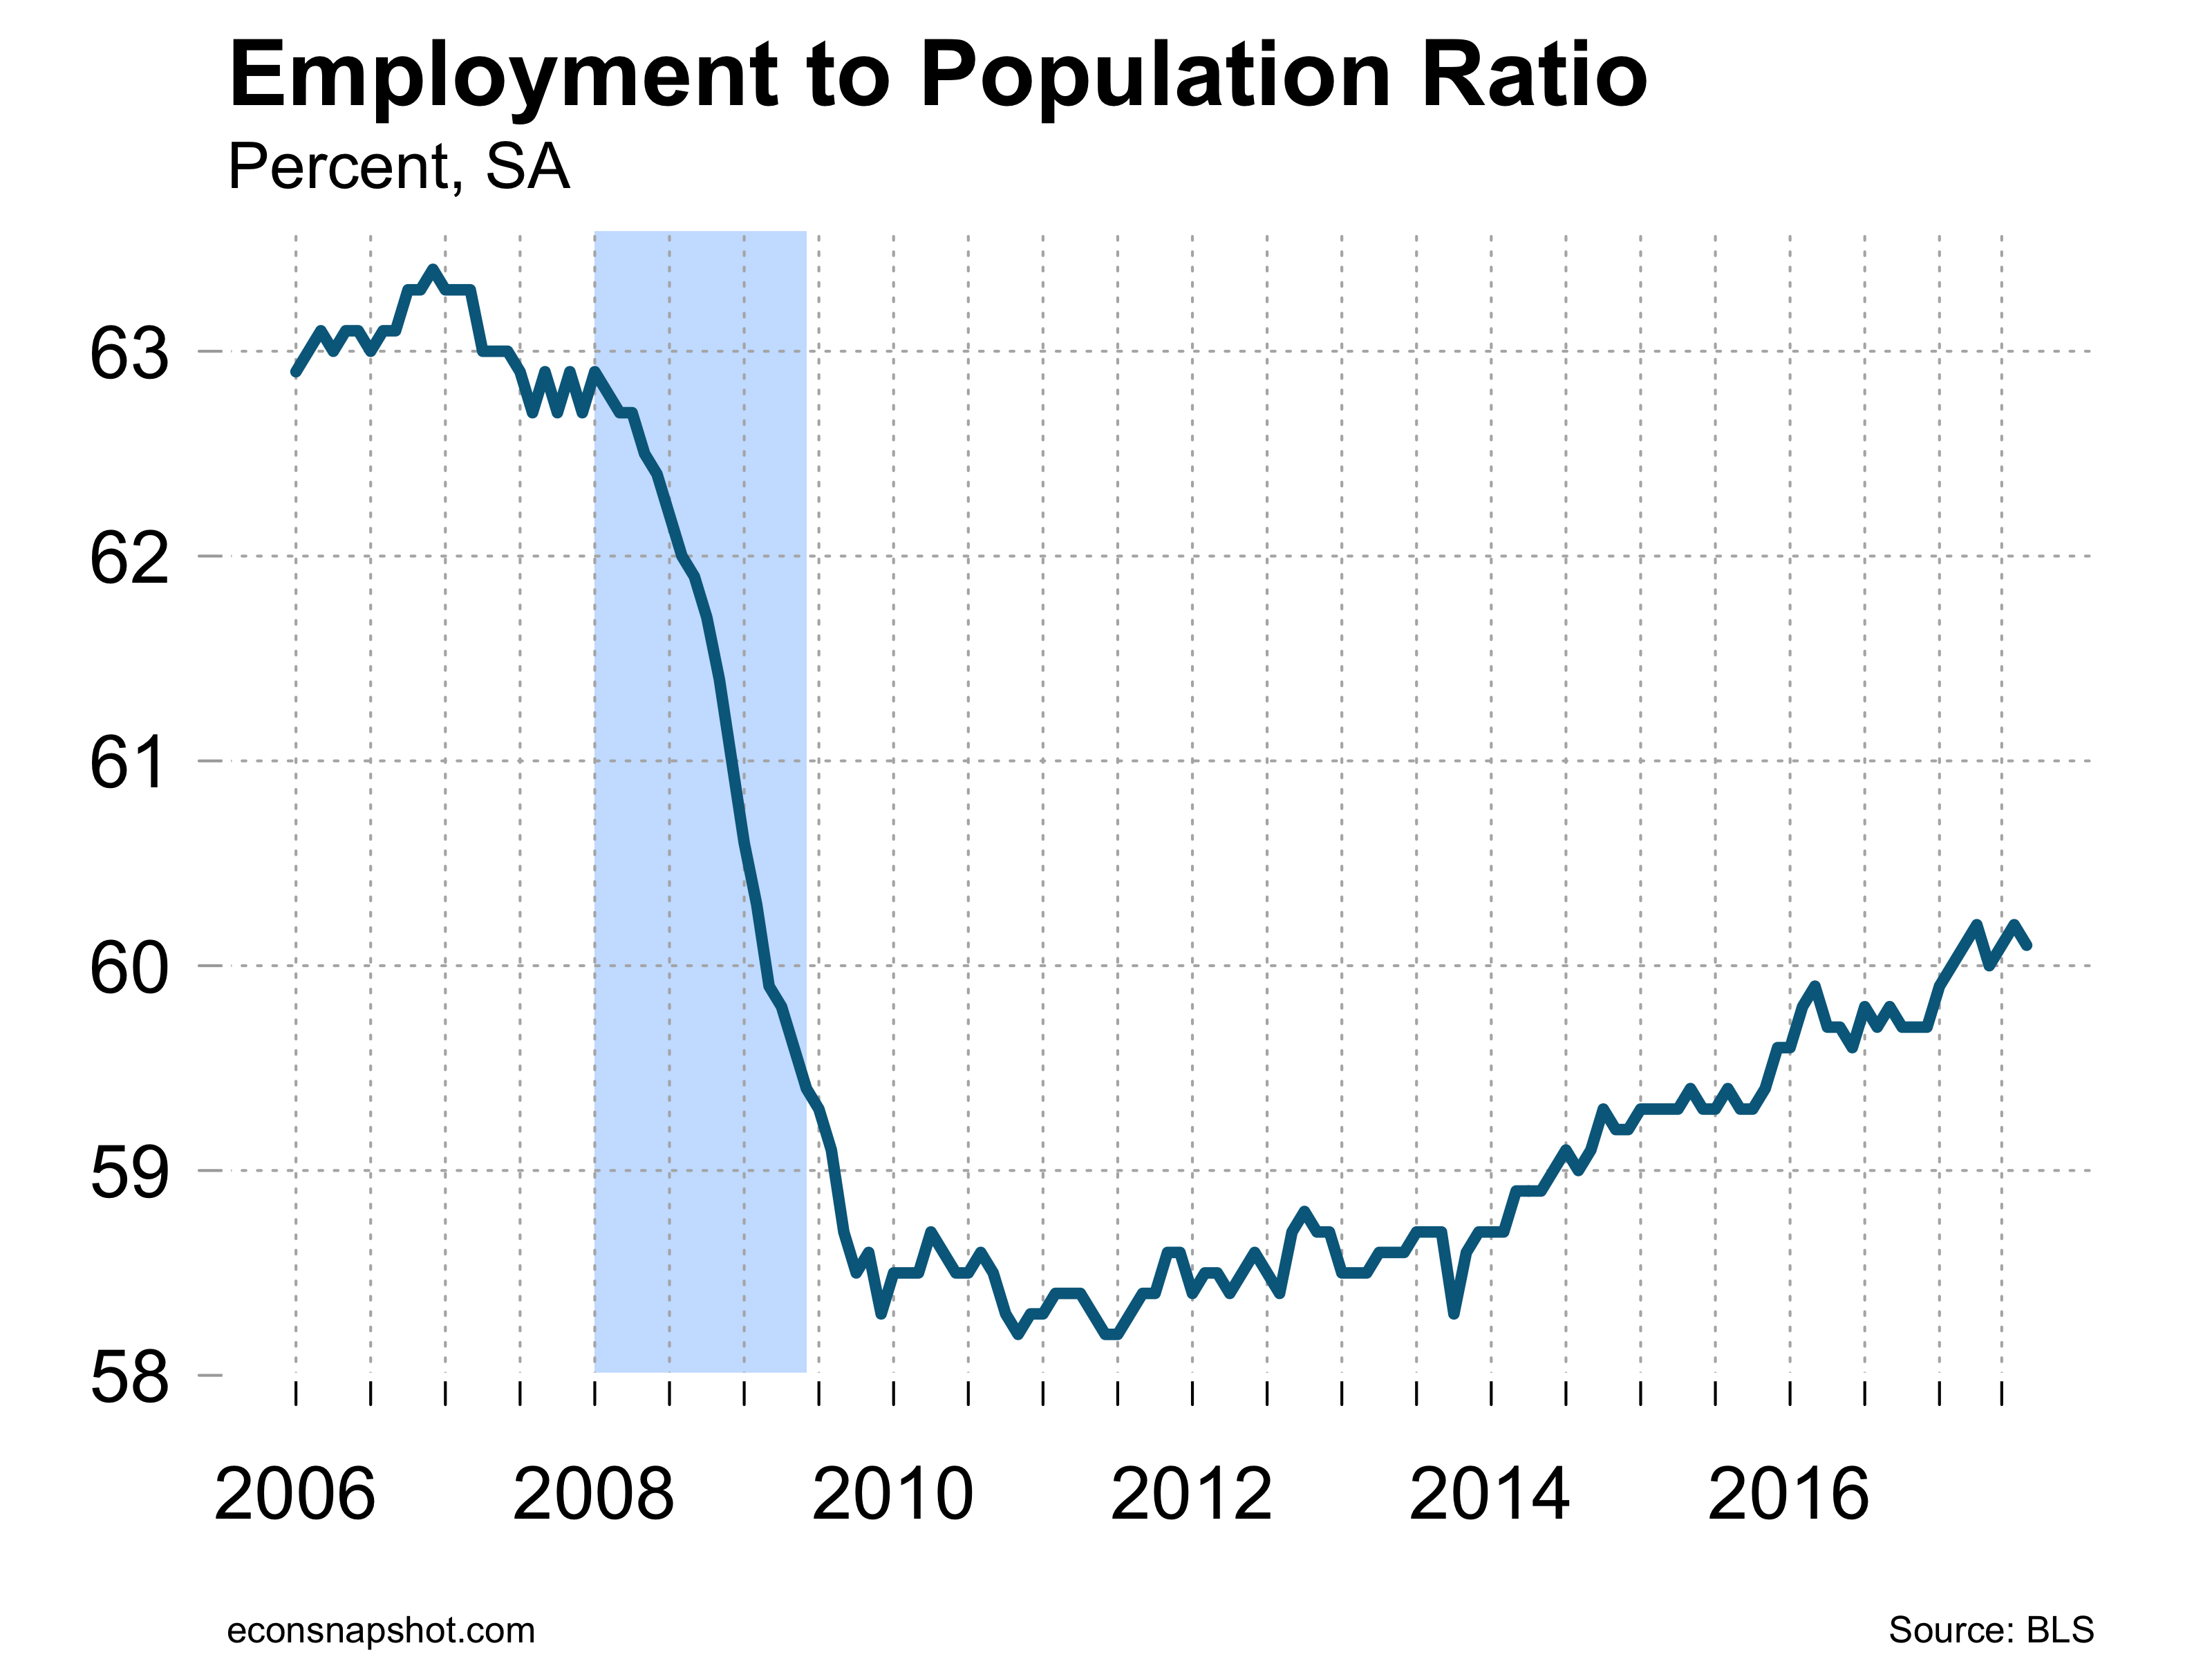
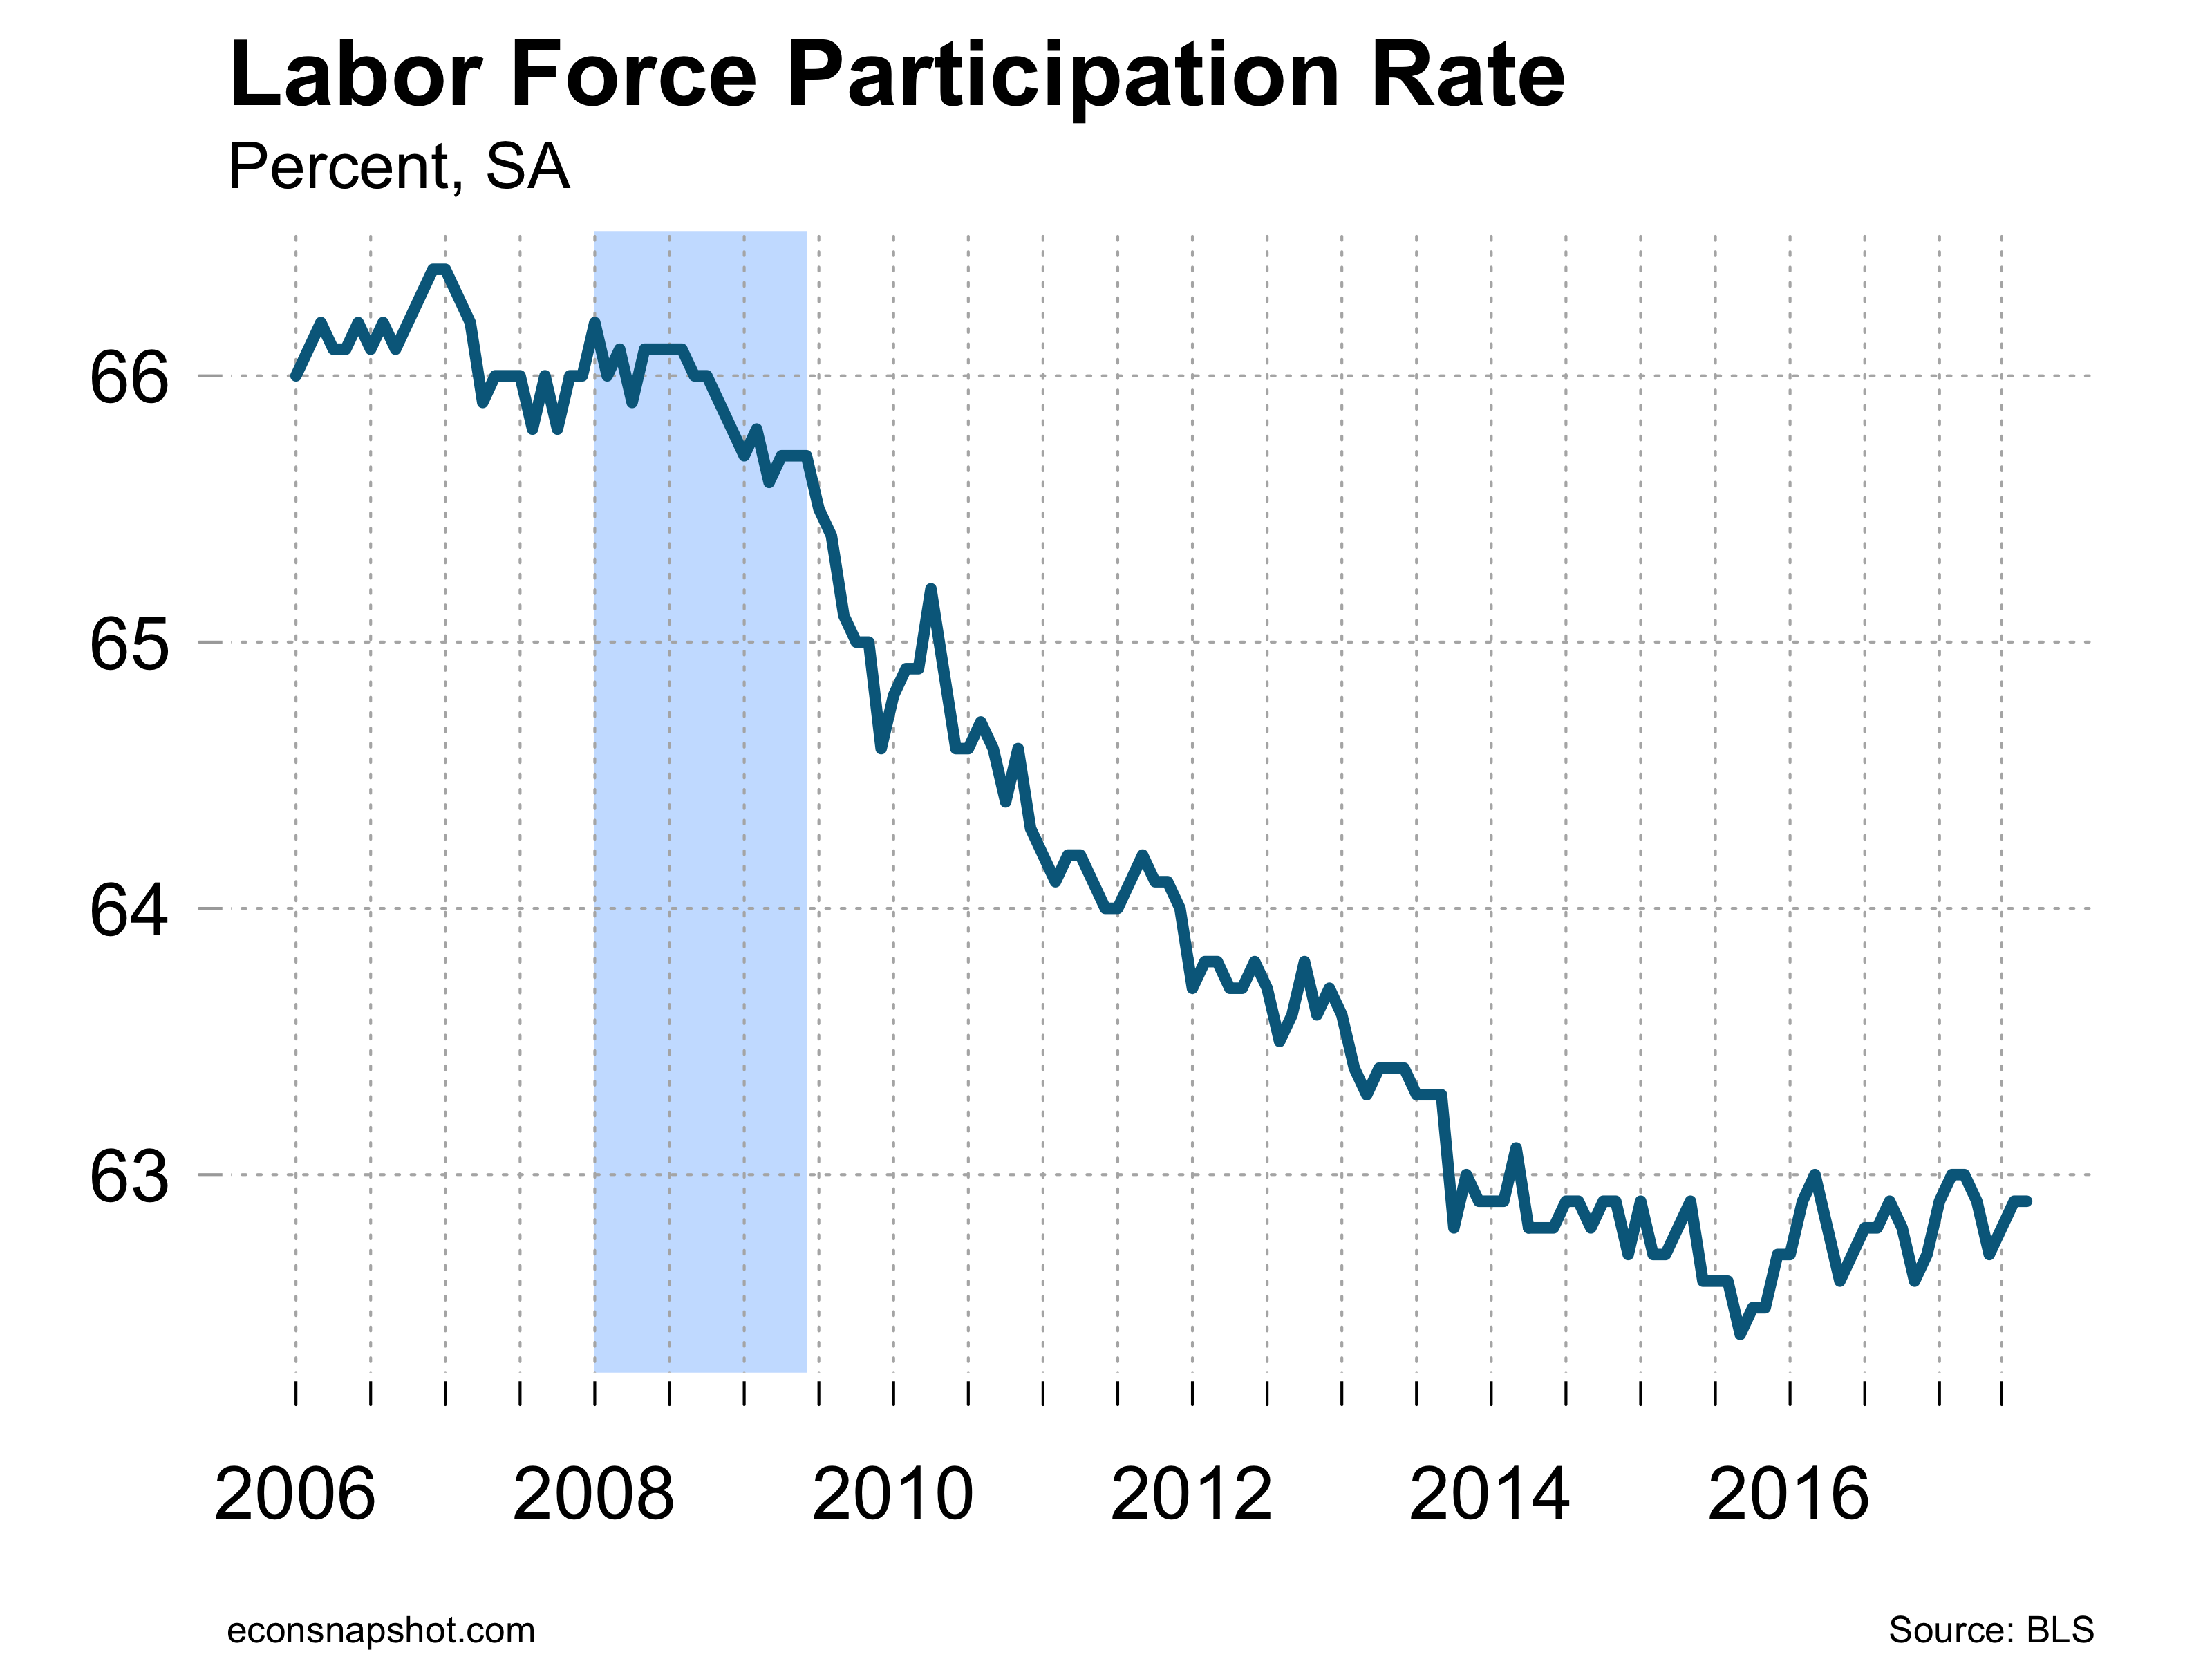
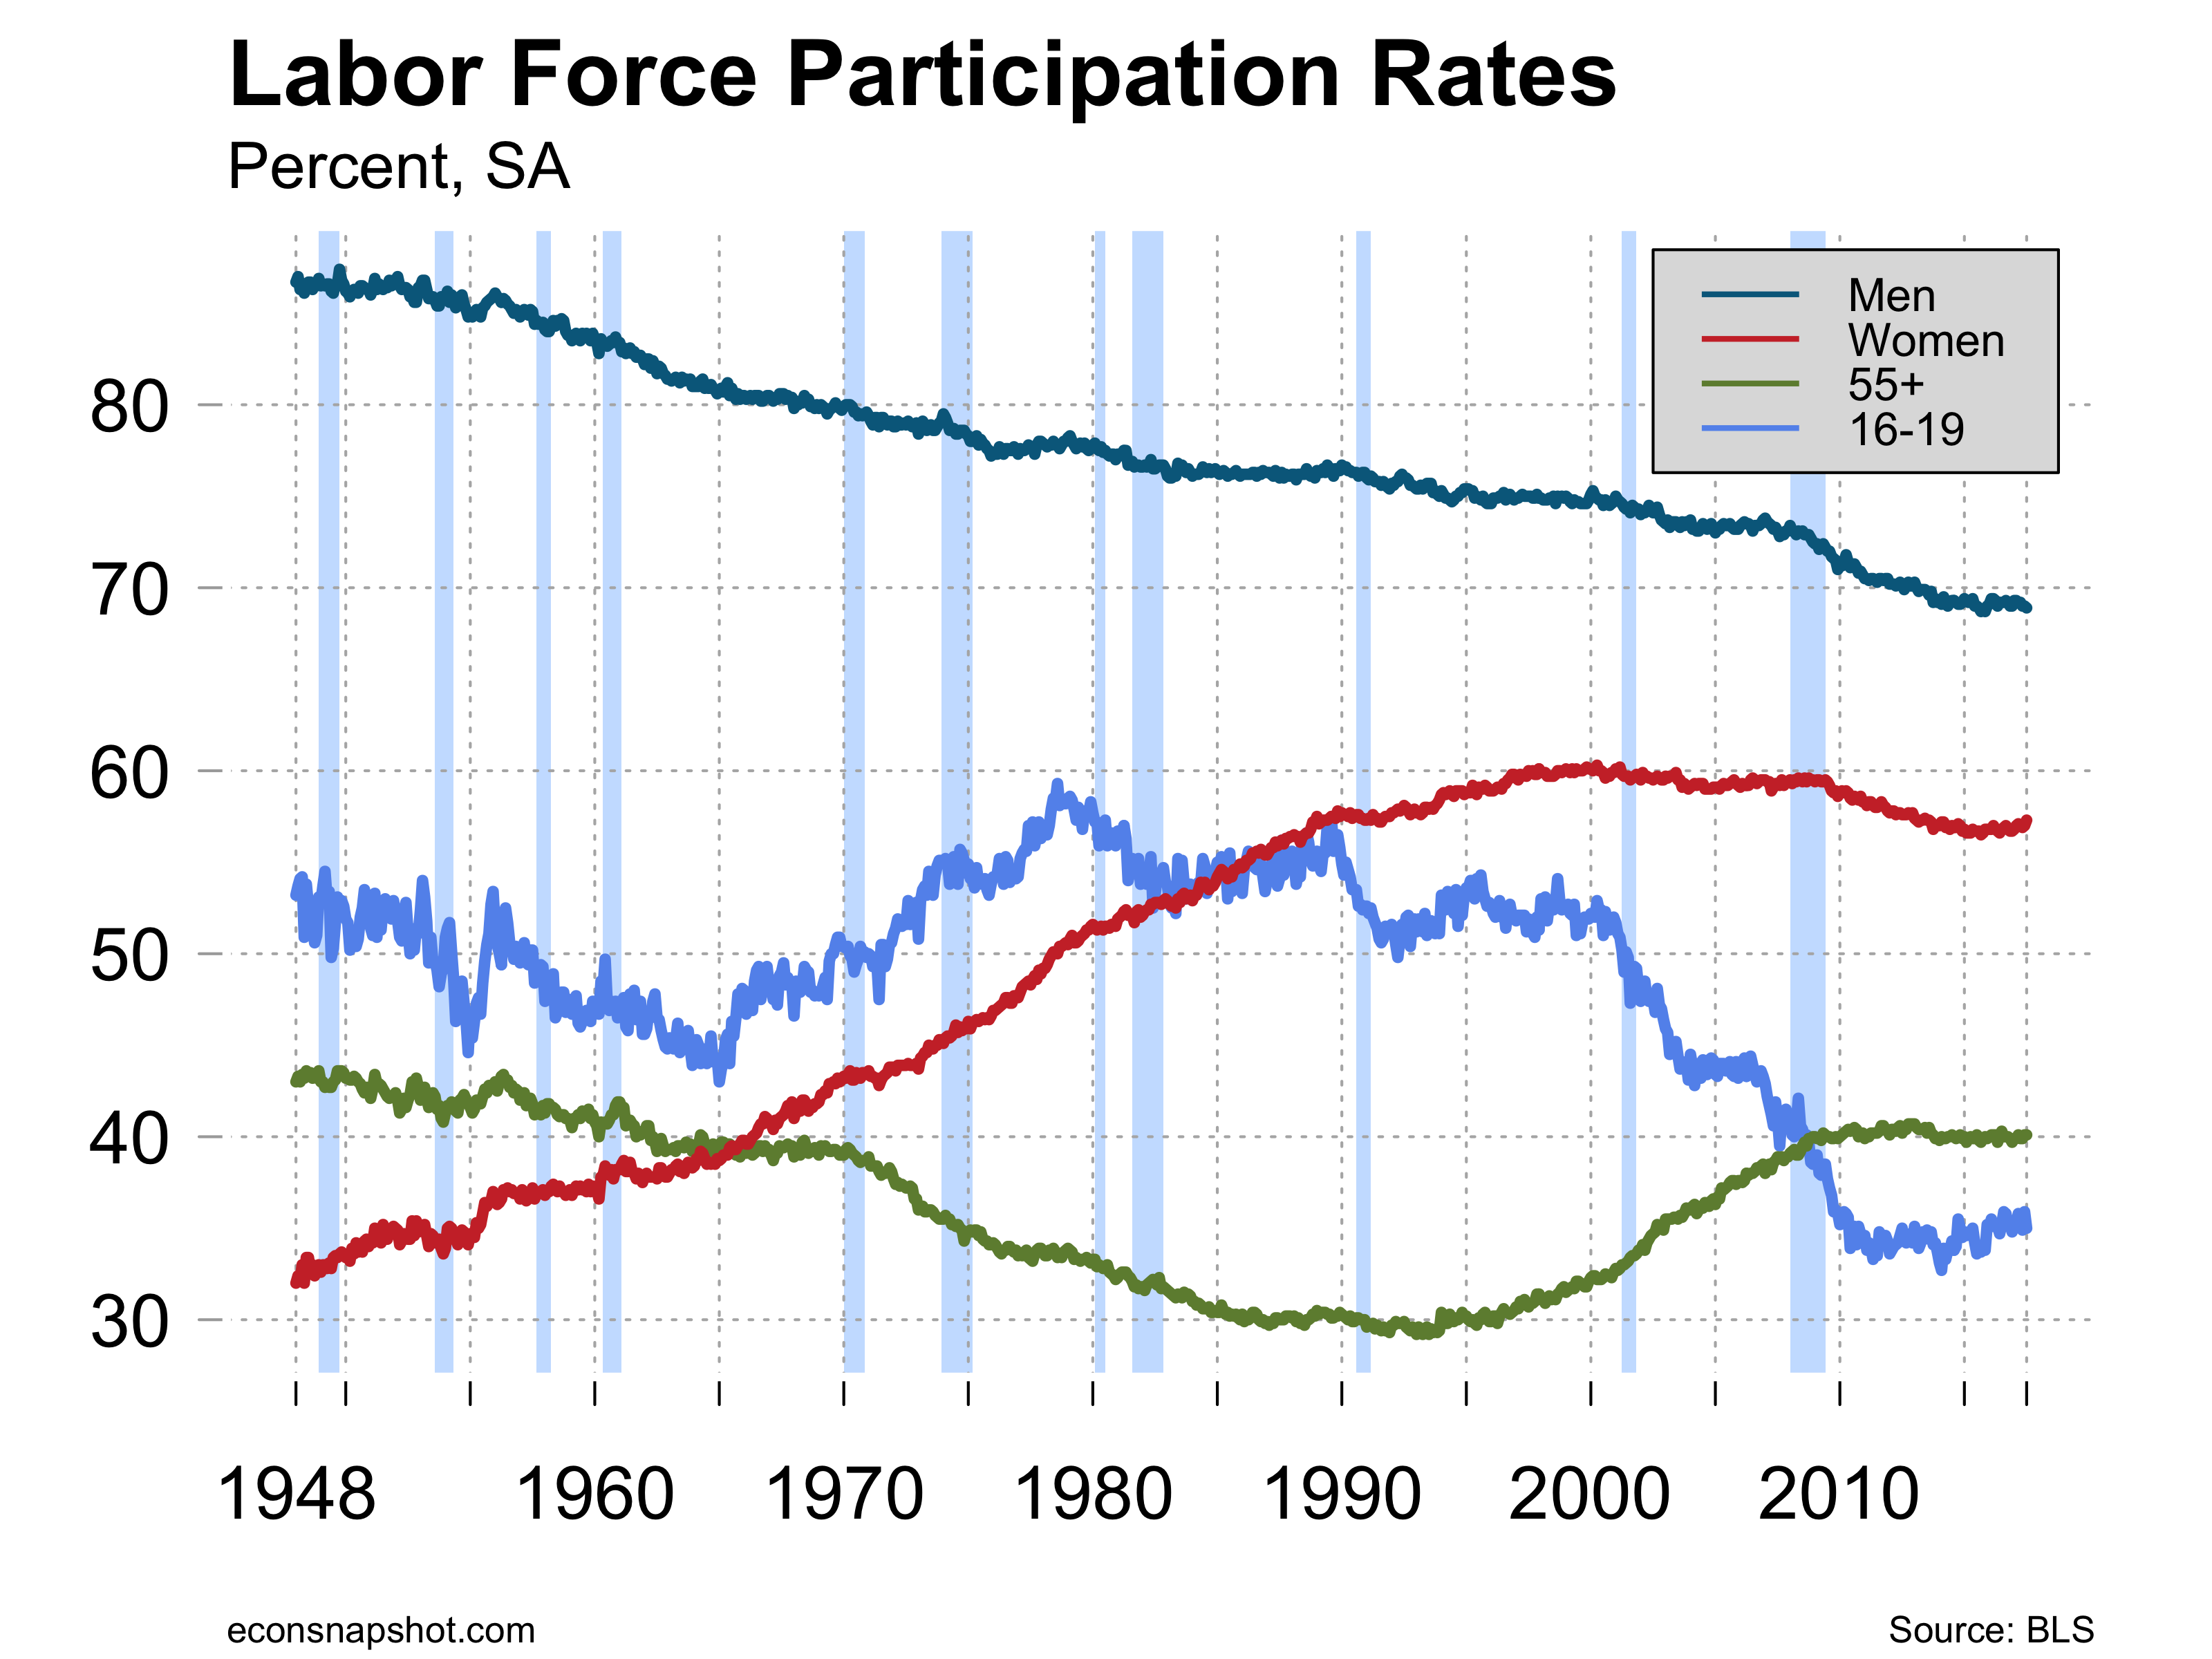
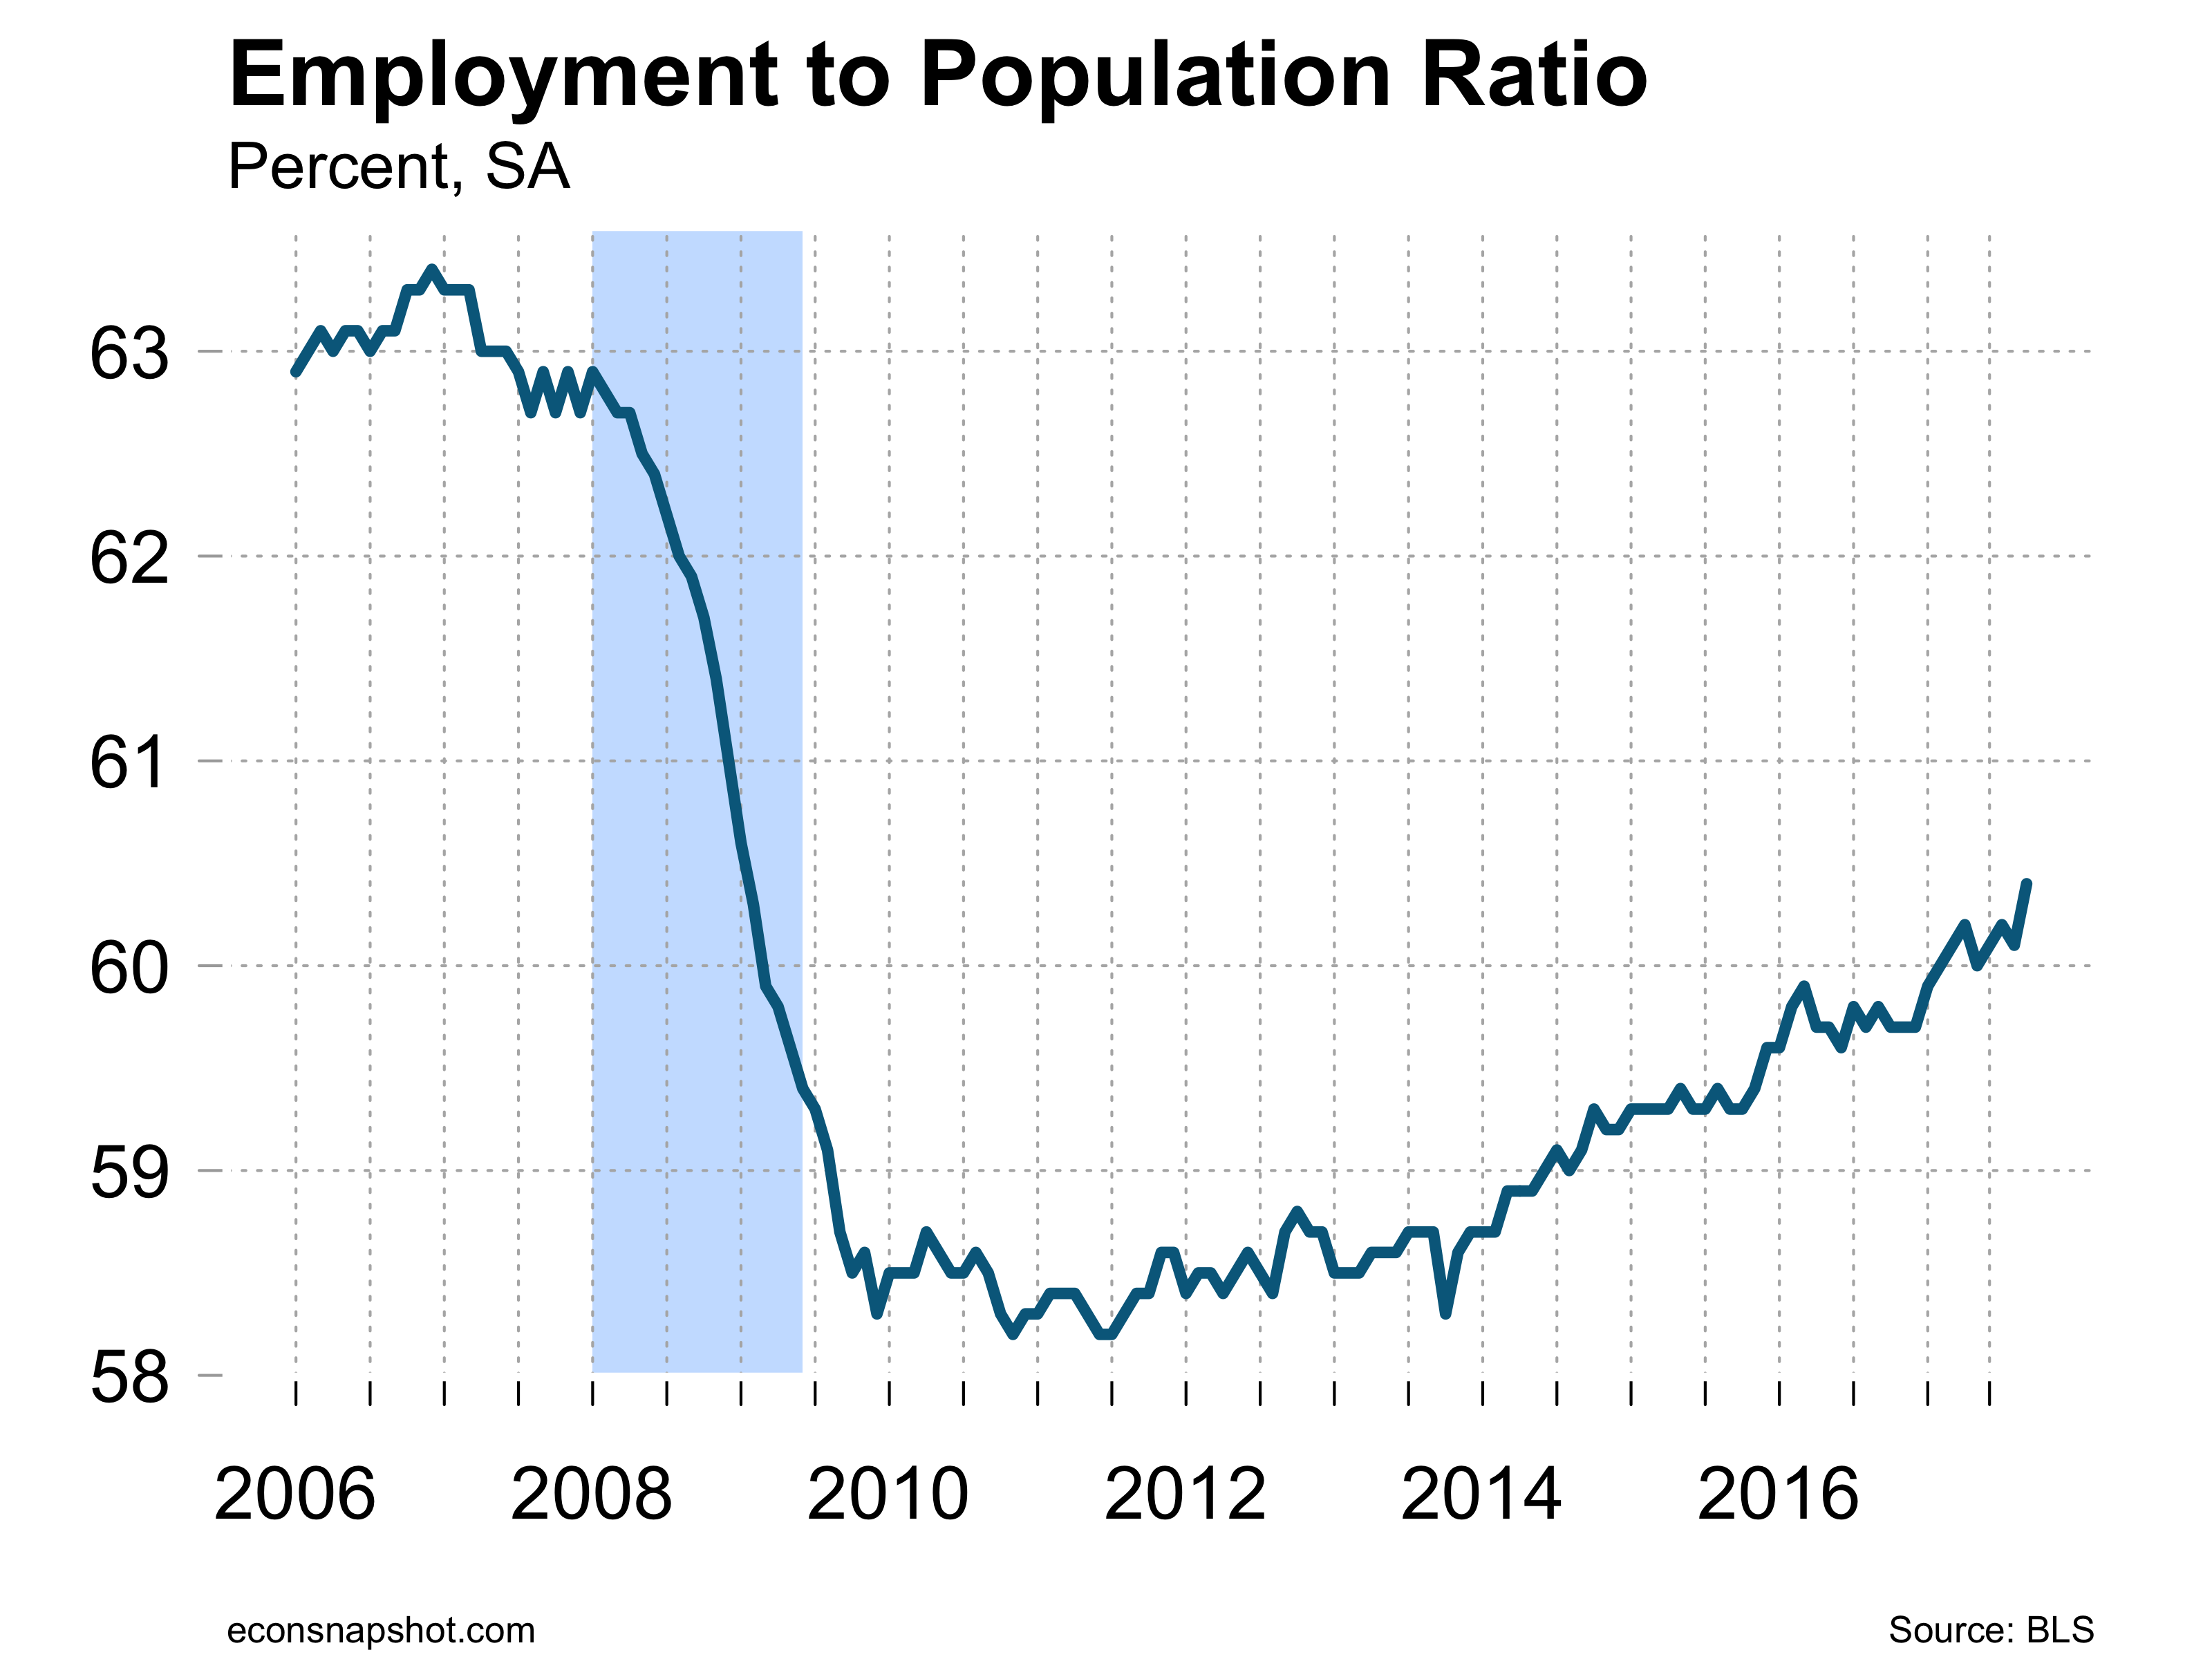
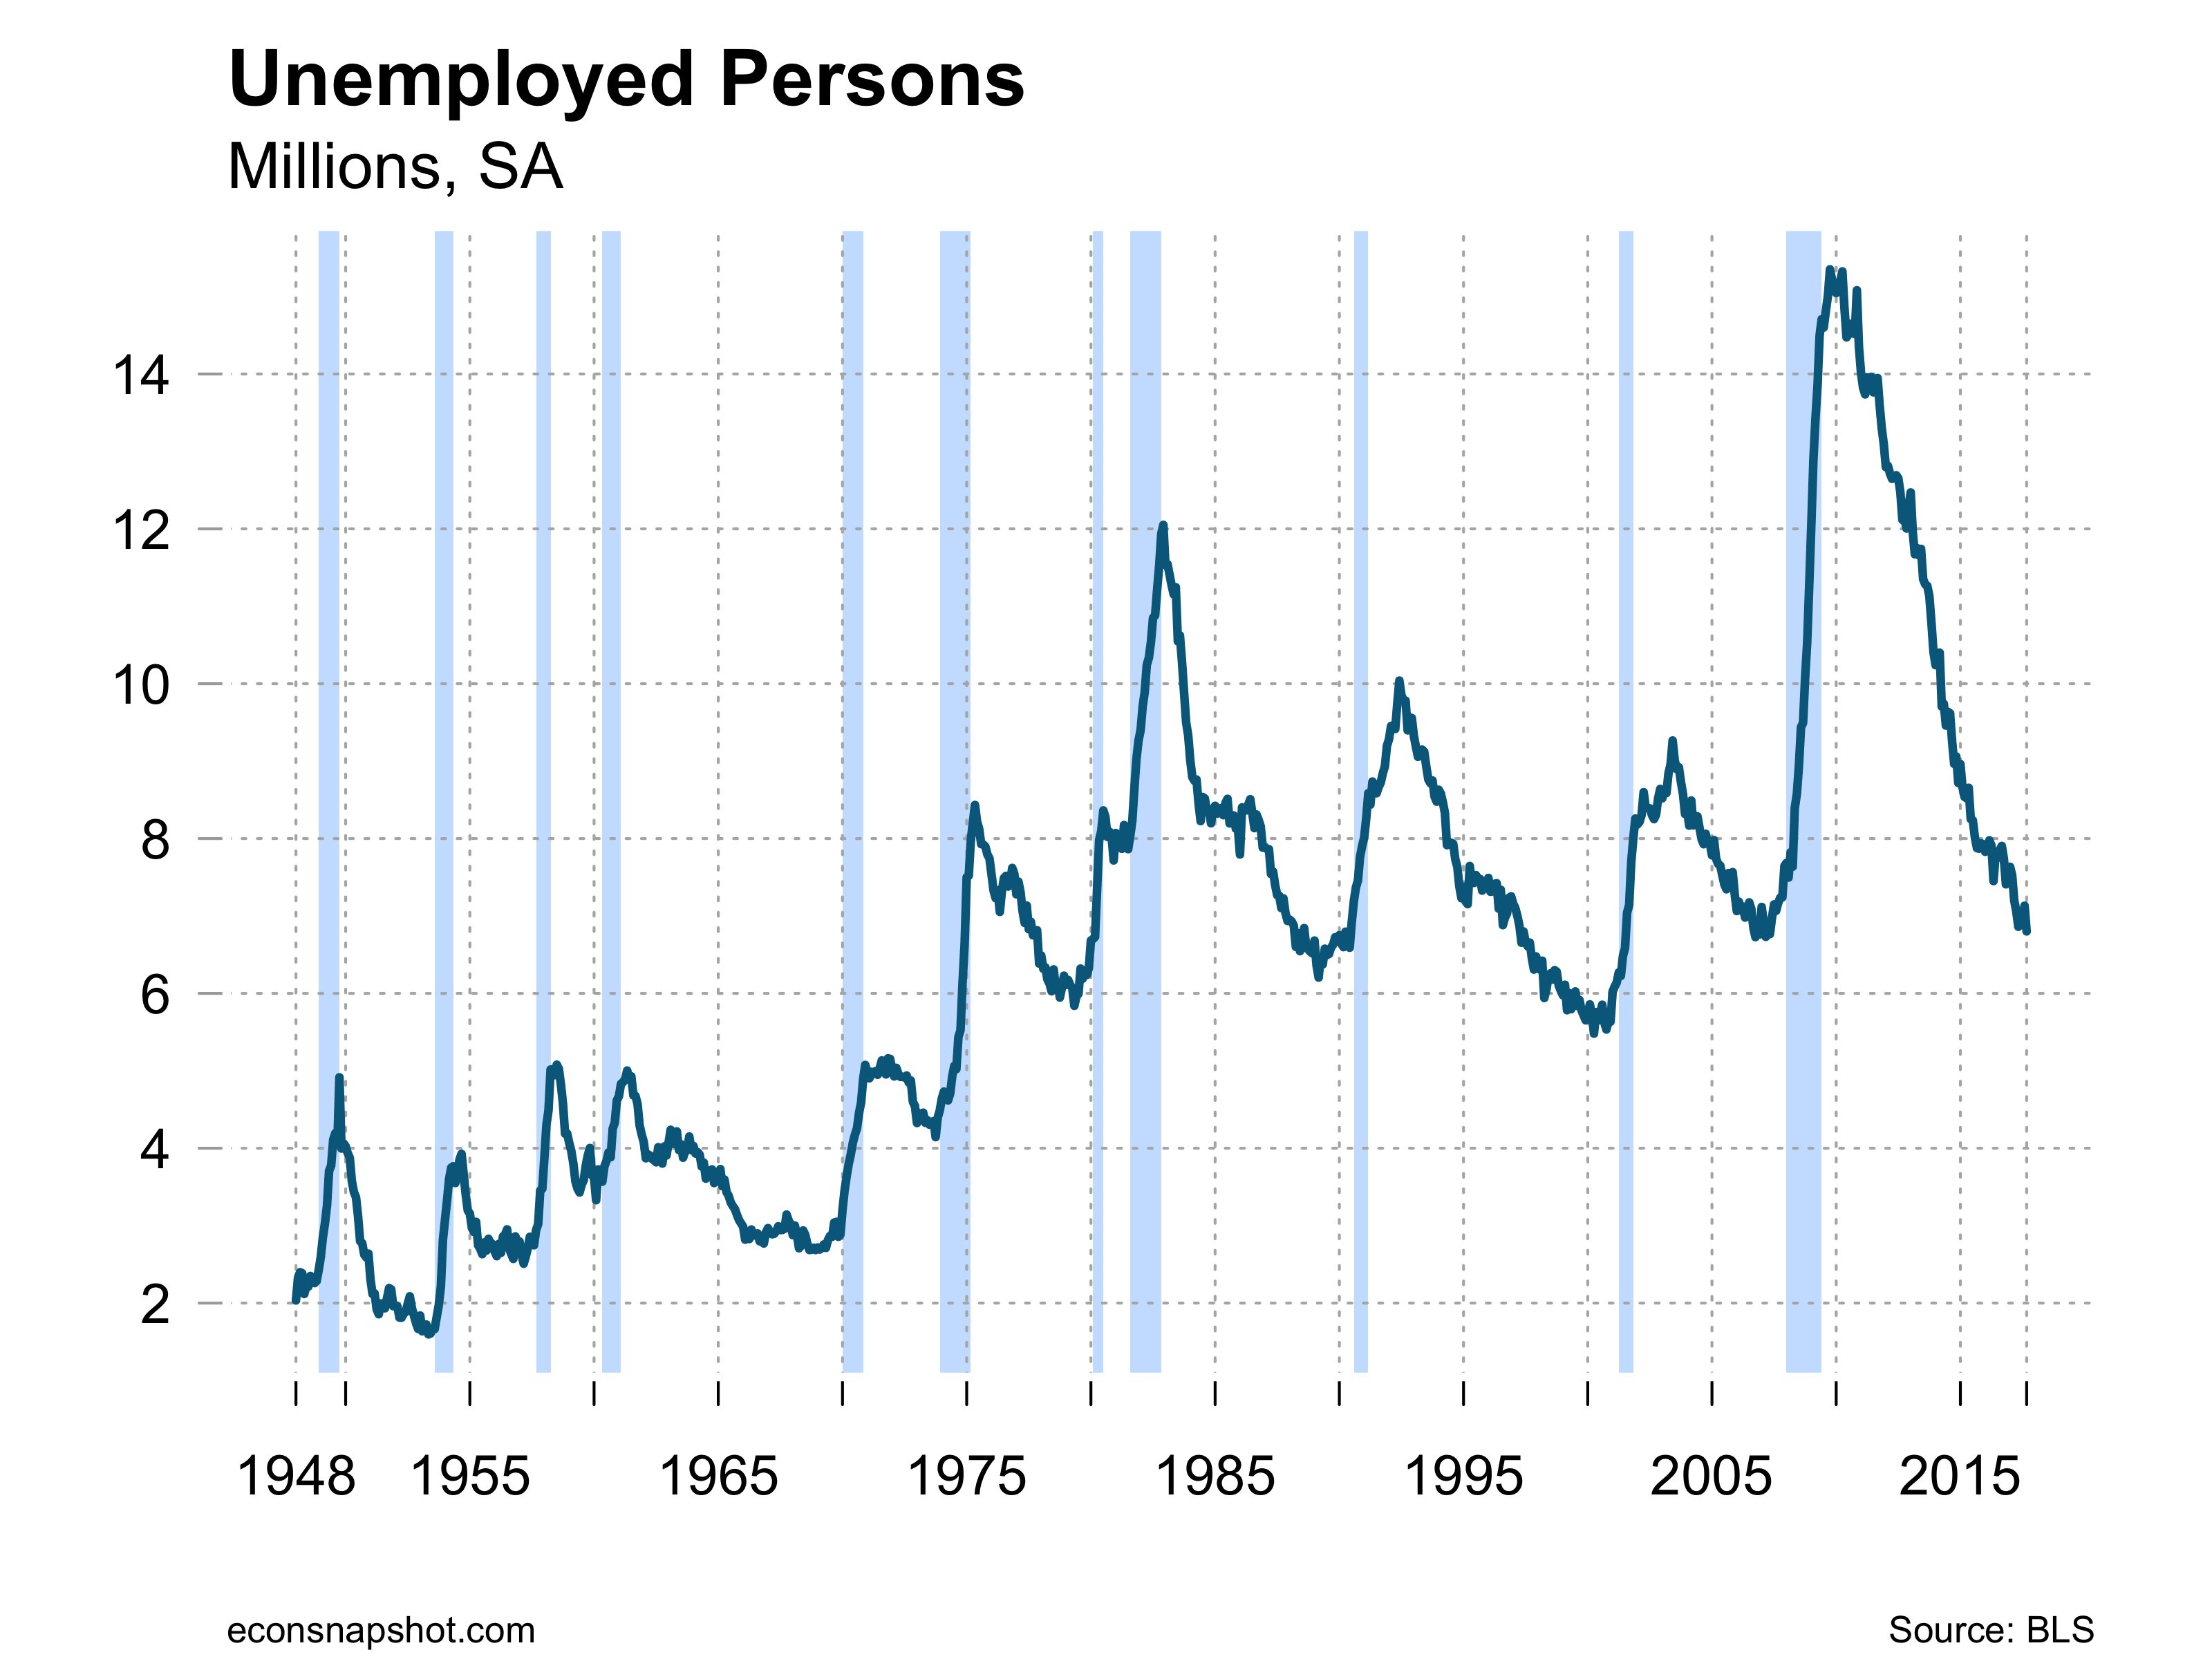
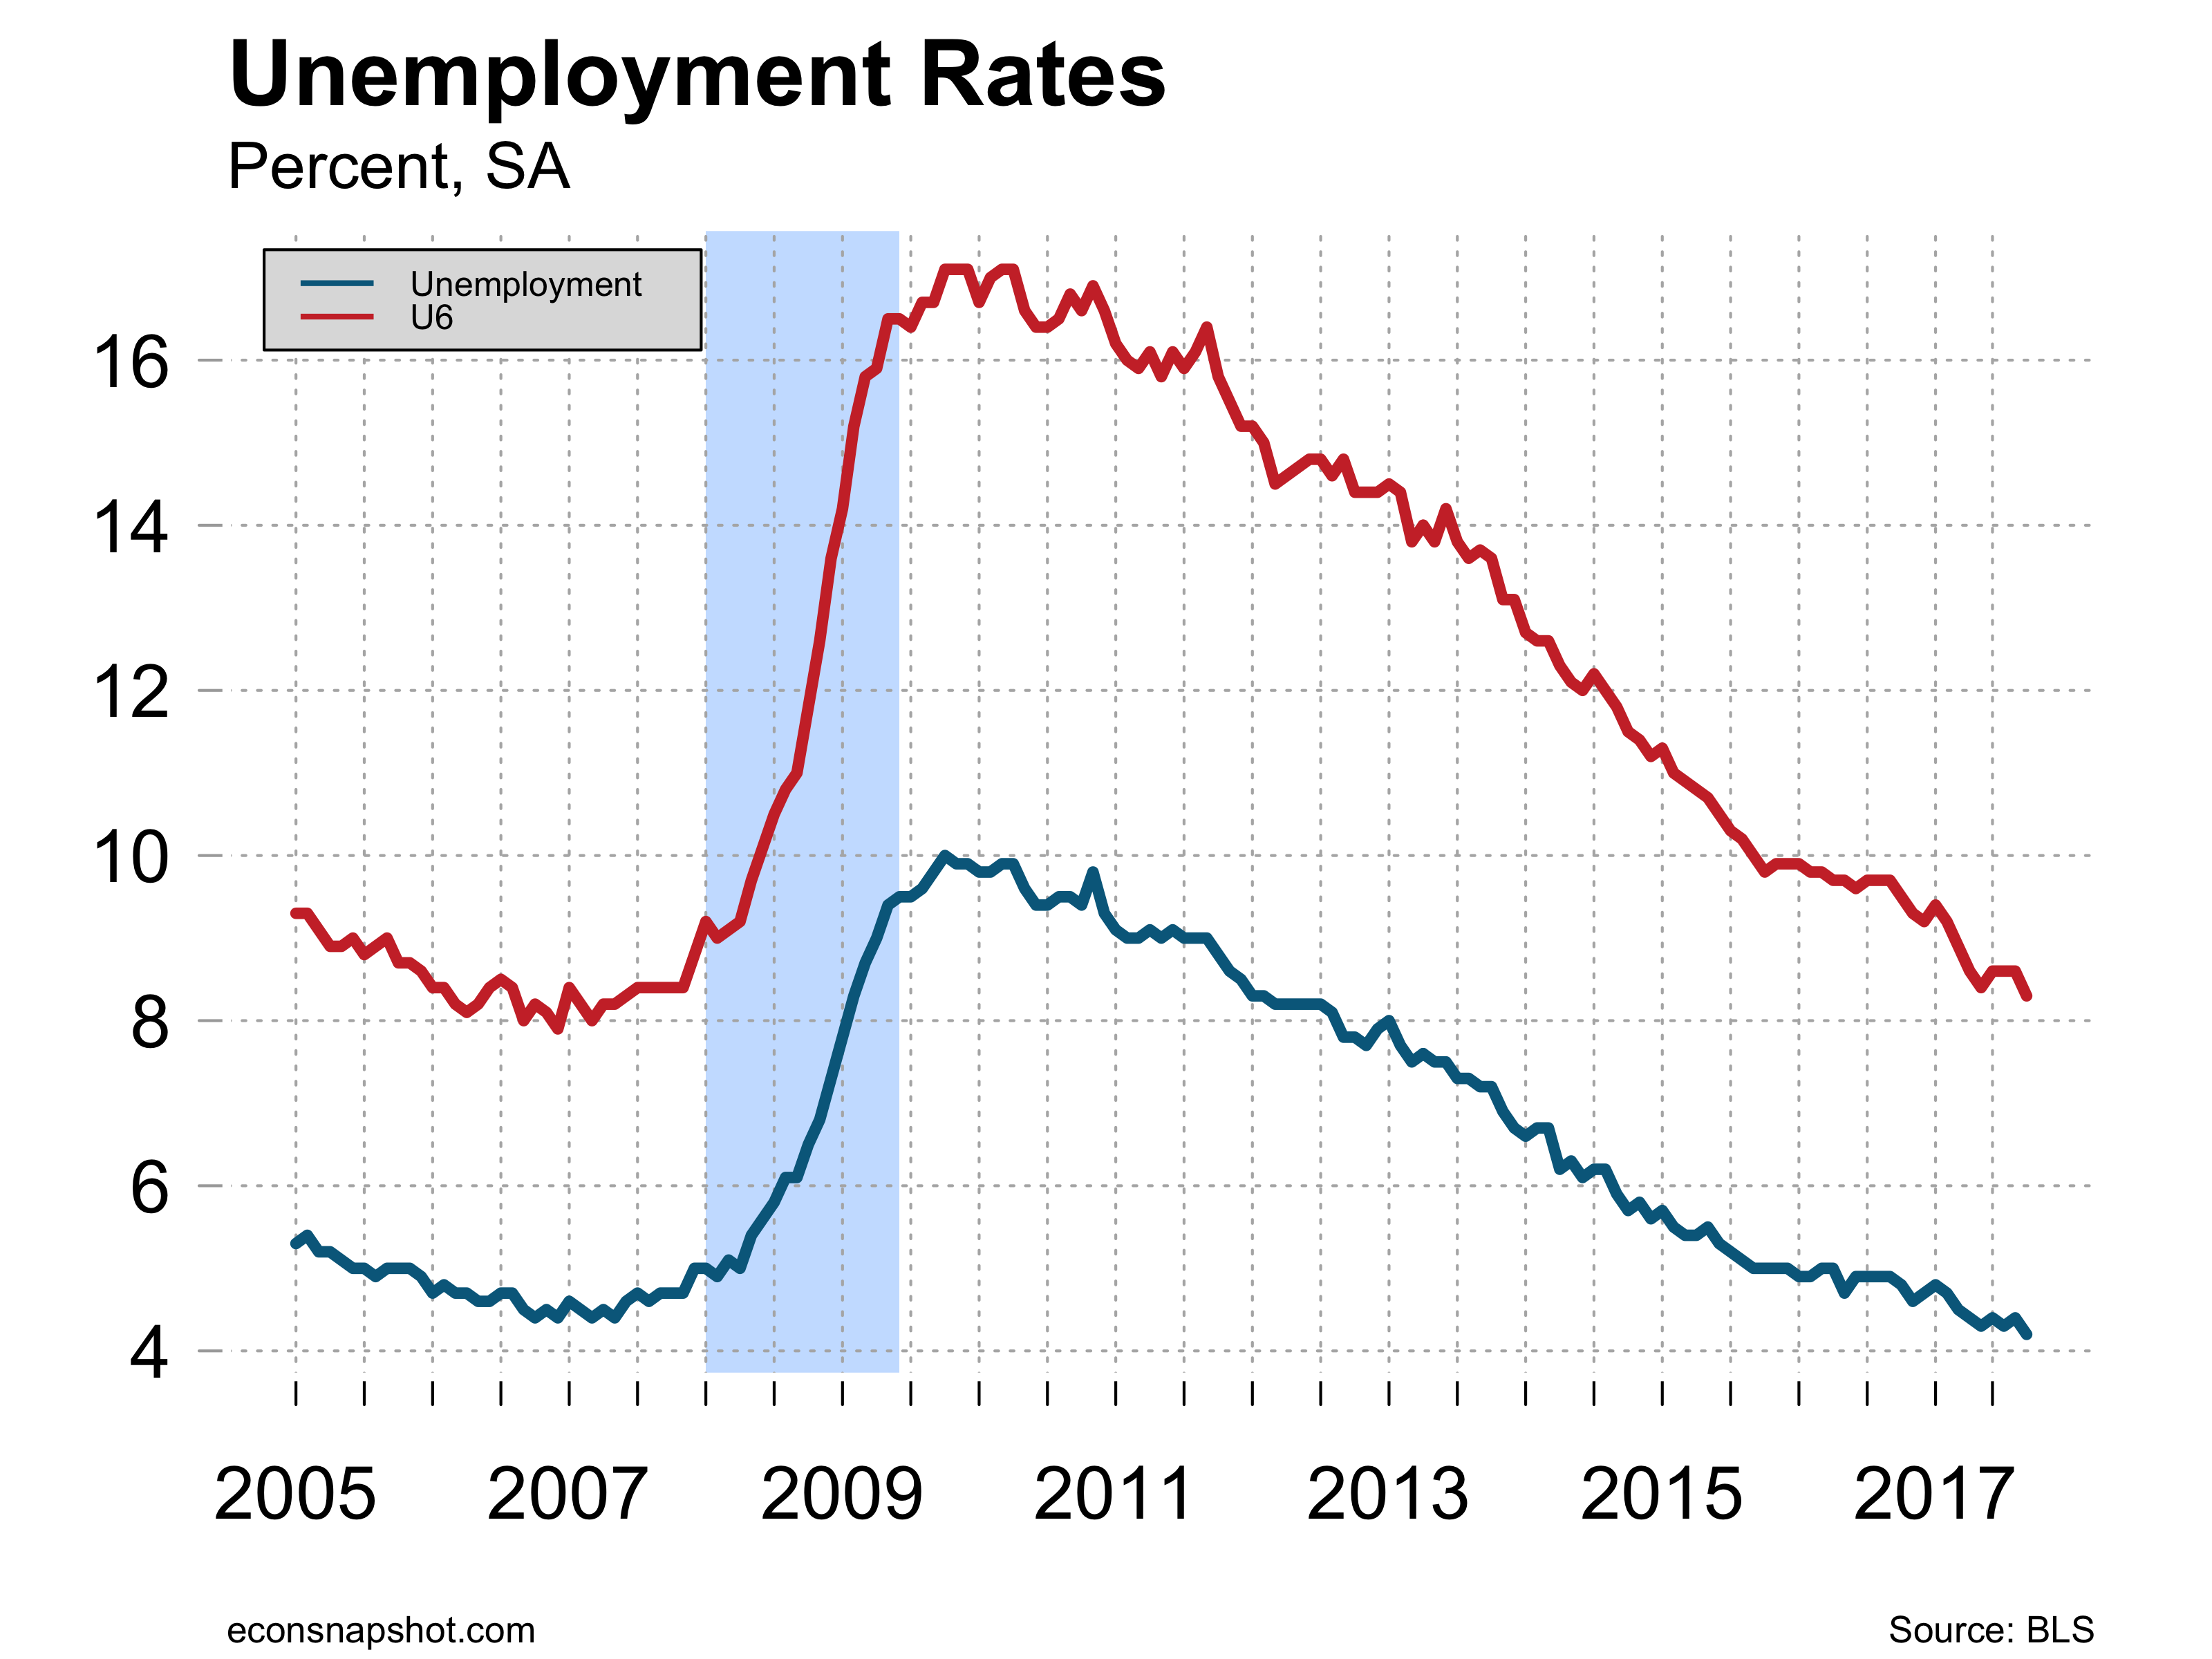
The decline in payroll employment seems to be a little misleading due to the disruptions from the hurricanes. The household survey looks much more positive. The labor force participation rate was up from 62.9 to 63.1. The employment to population ratio was also up, from 60.1 to 60.4. The number of unemployed fell by 331,000 and the unemployment rate fell from 4.44% to 4.22%.

While the “headline” employment decline shows up first in most reports, a deeper look shows continued strength in the labor market. The coming months are likely to show a bounce back from the hurricane’s effects and a stimulus as rebuilding gets underway.