Q3 GDP: Solid Growth Continues

By Thomas Cooley and Peter Rupert

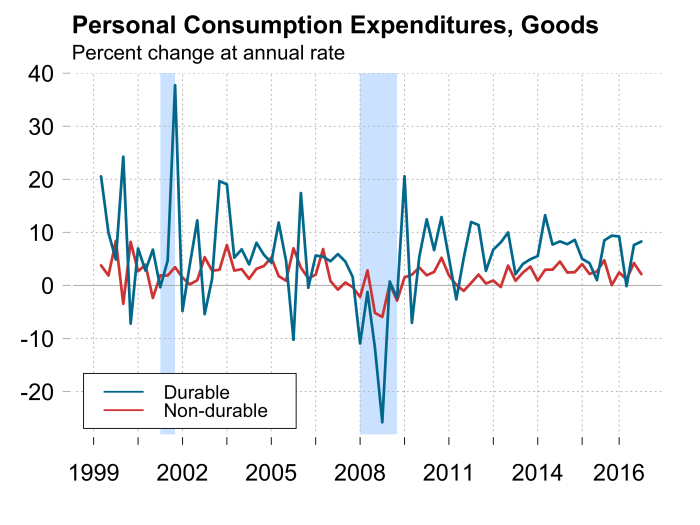
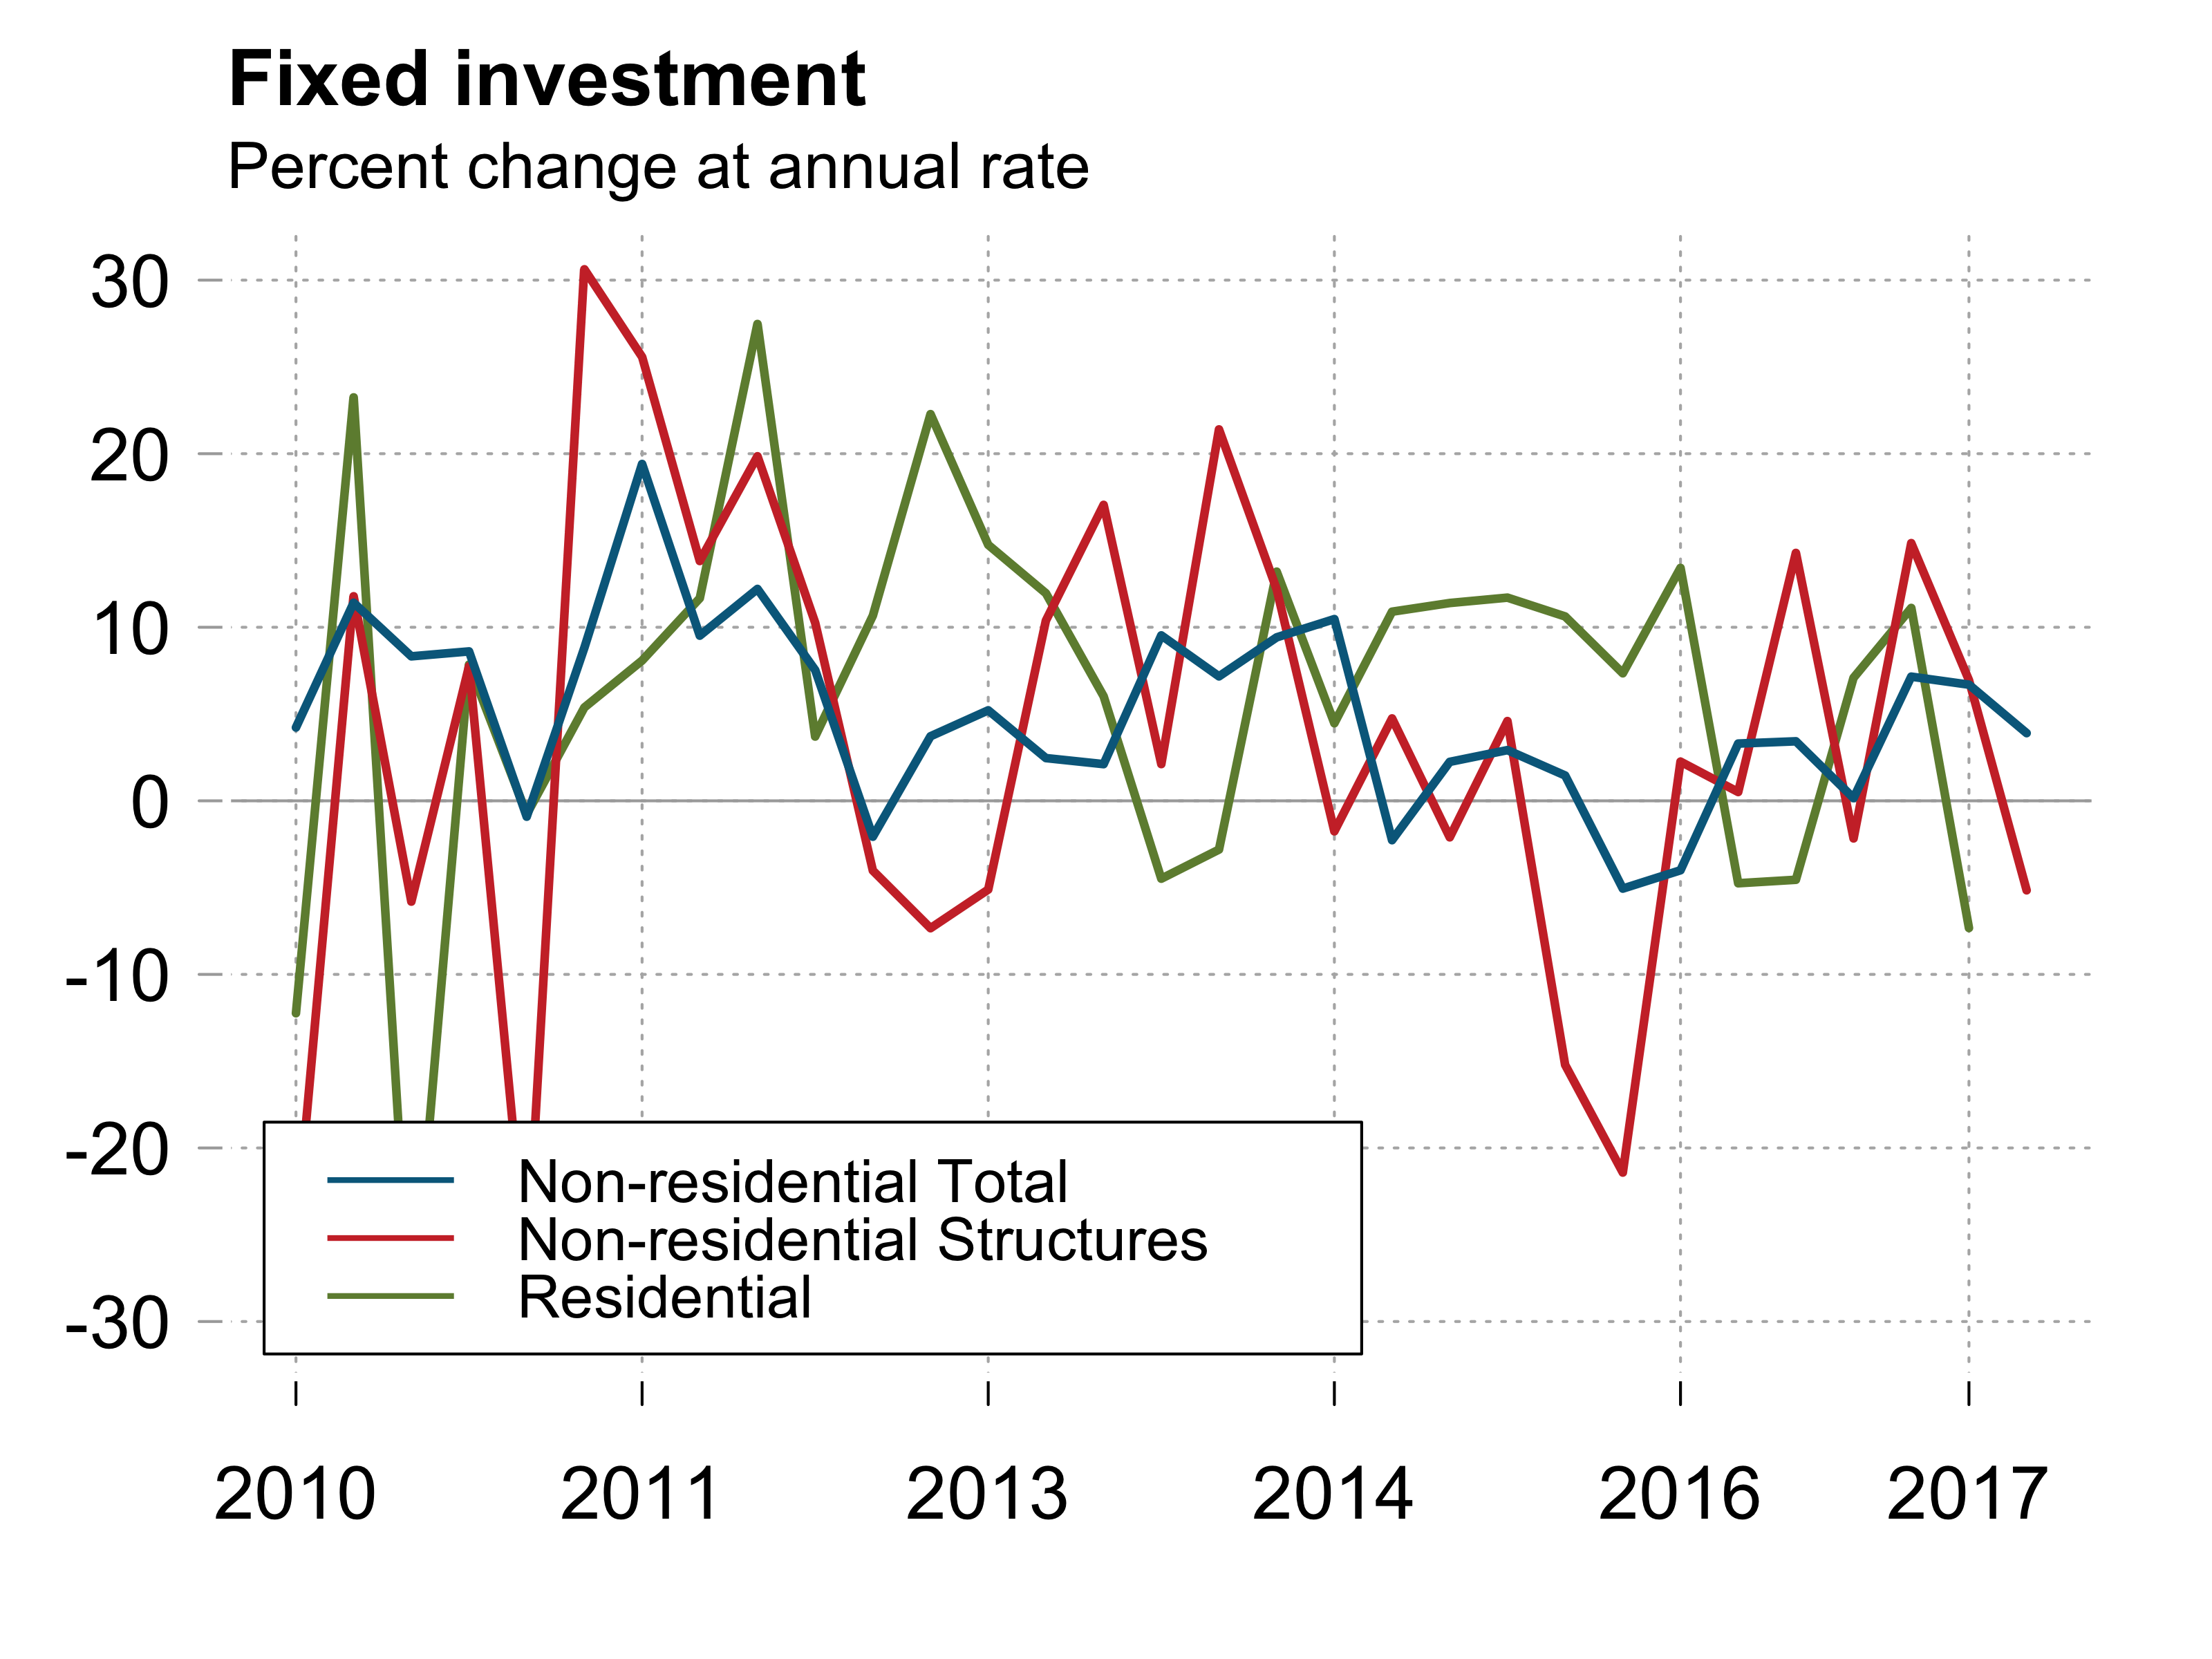
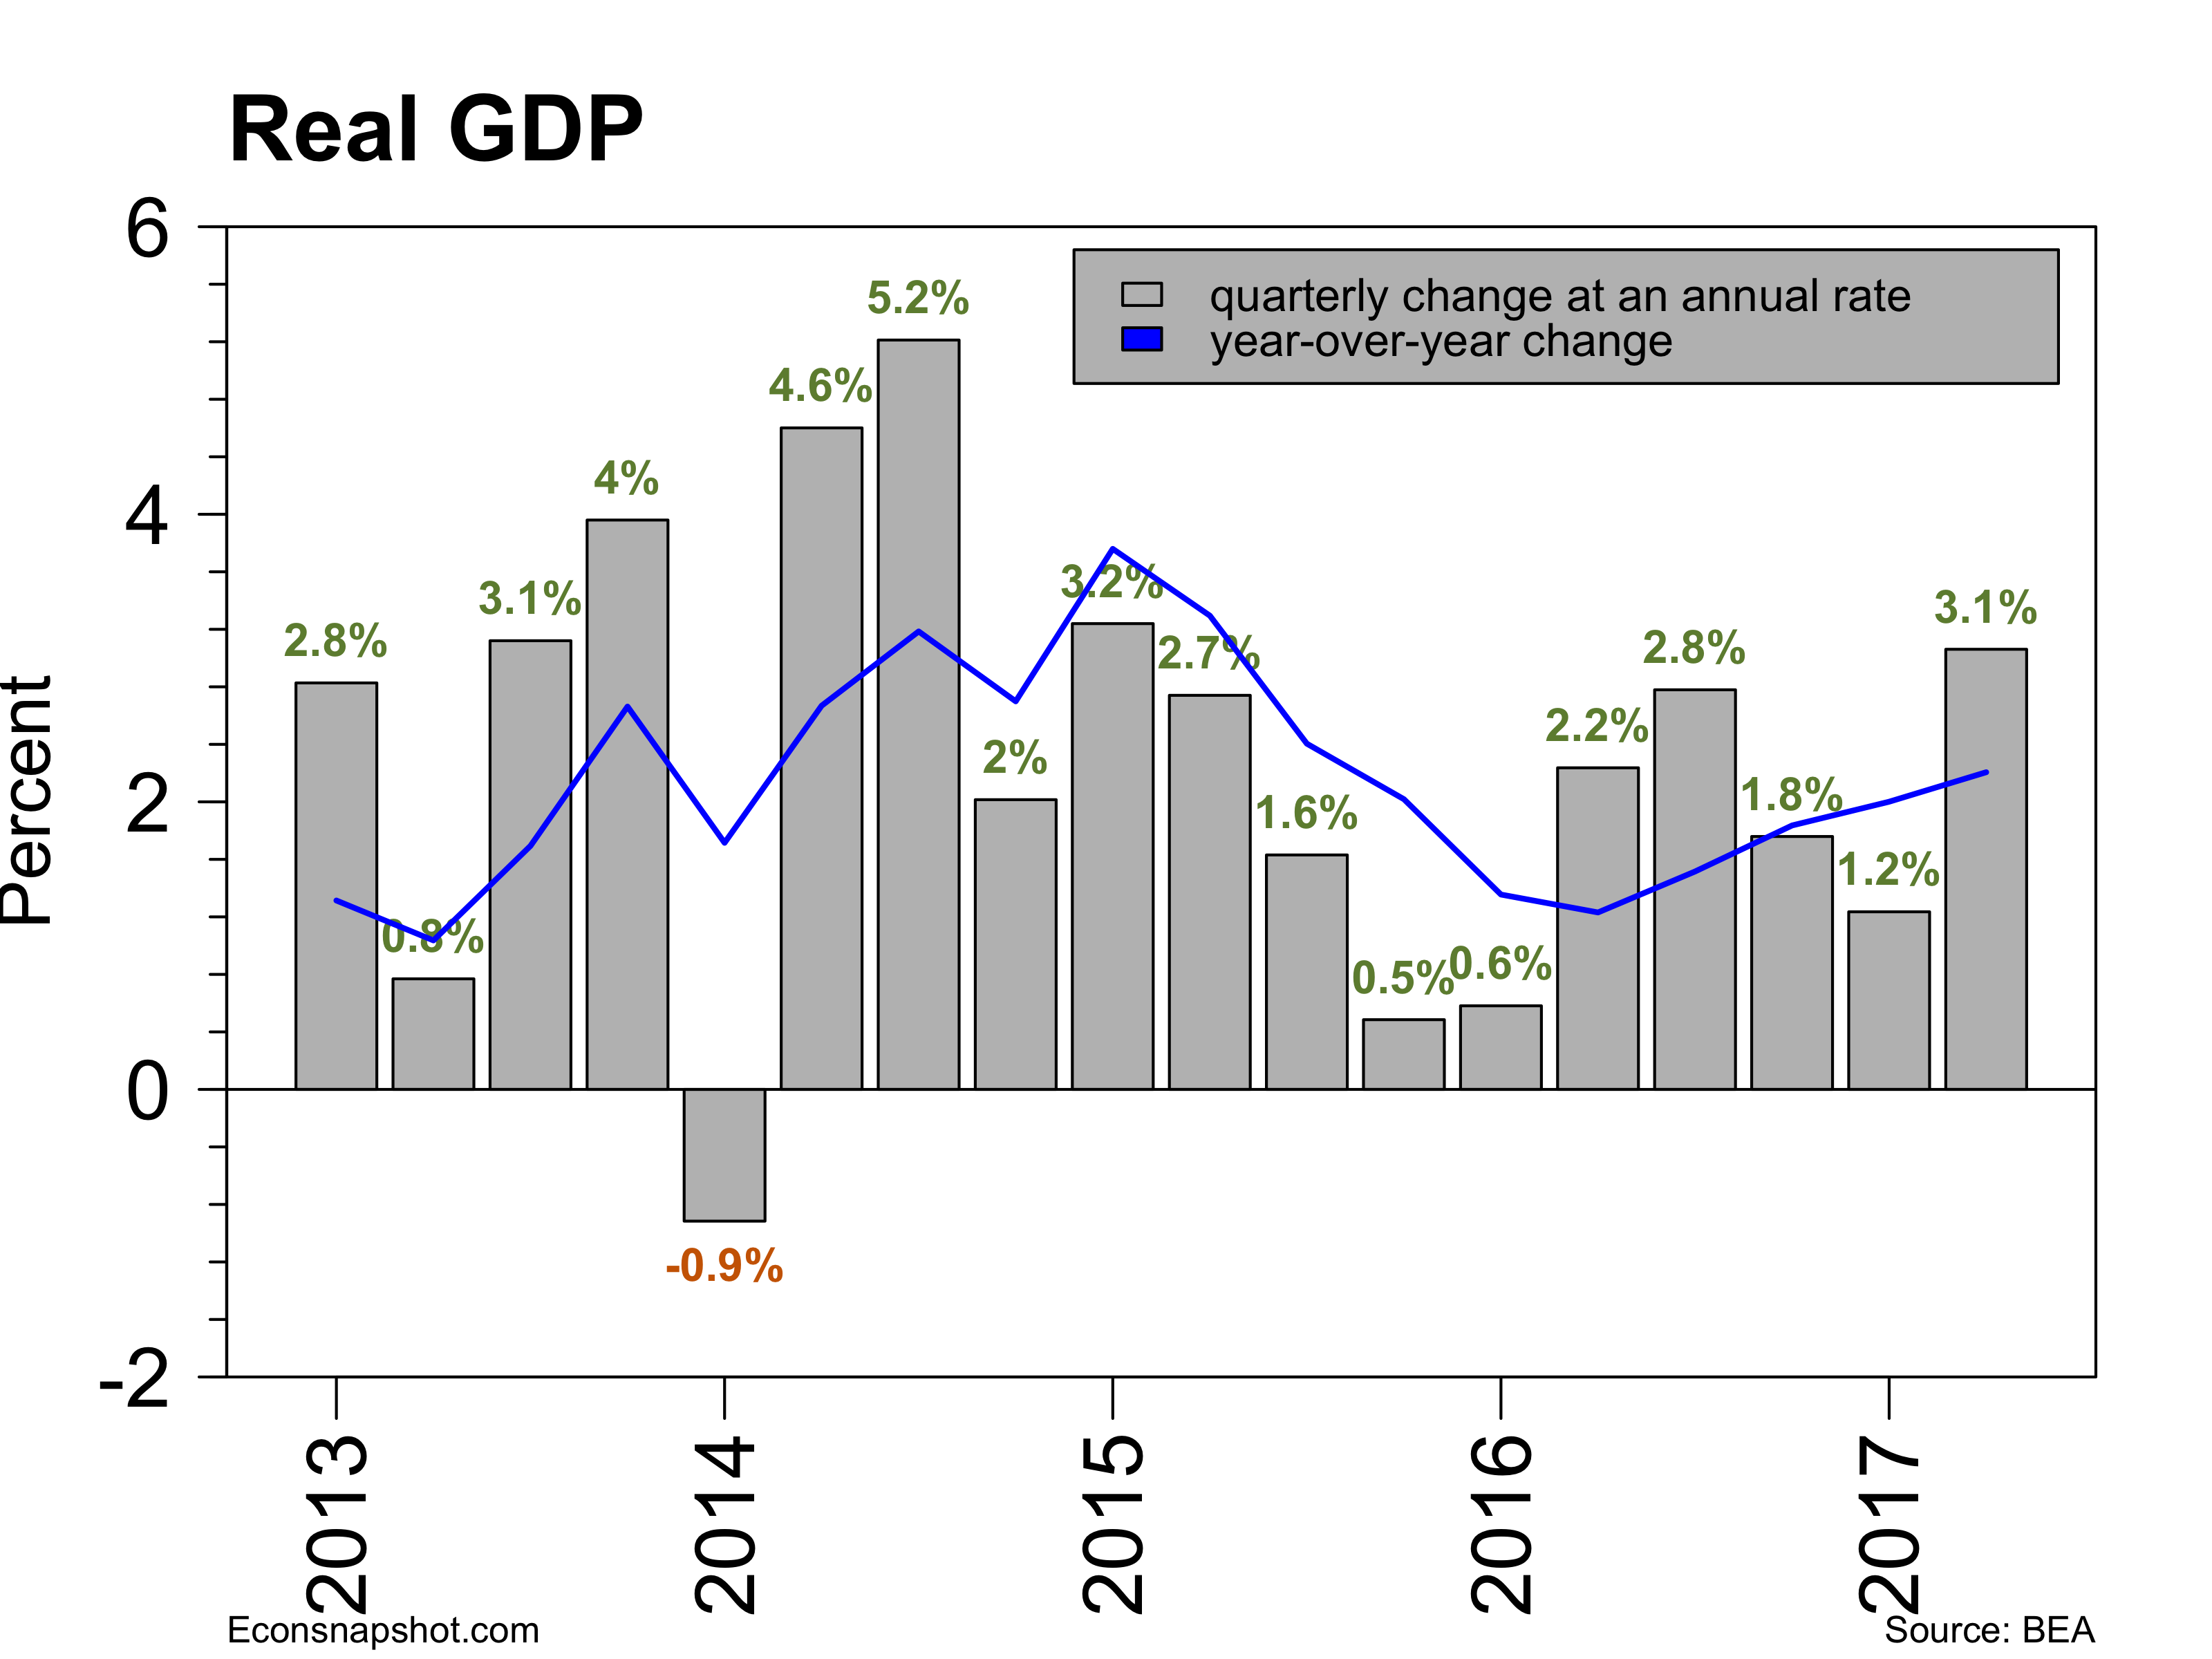
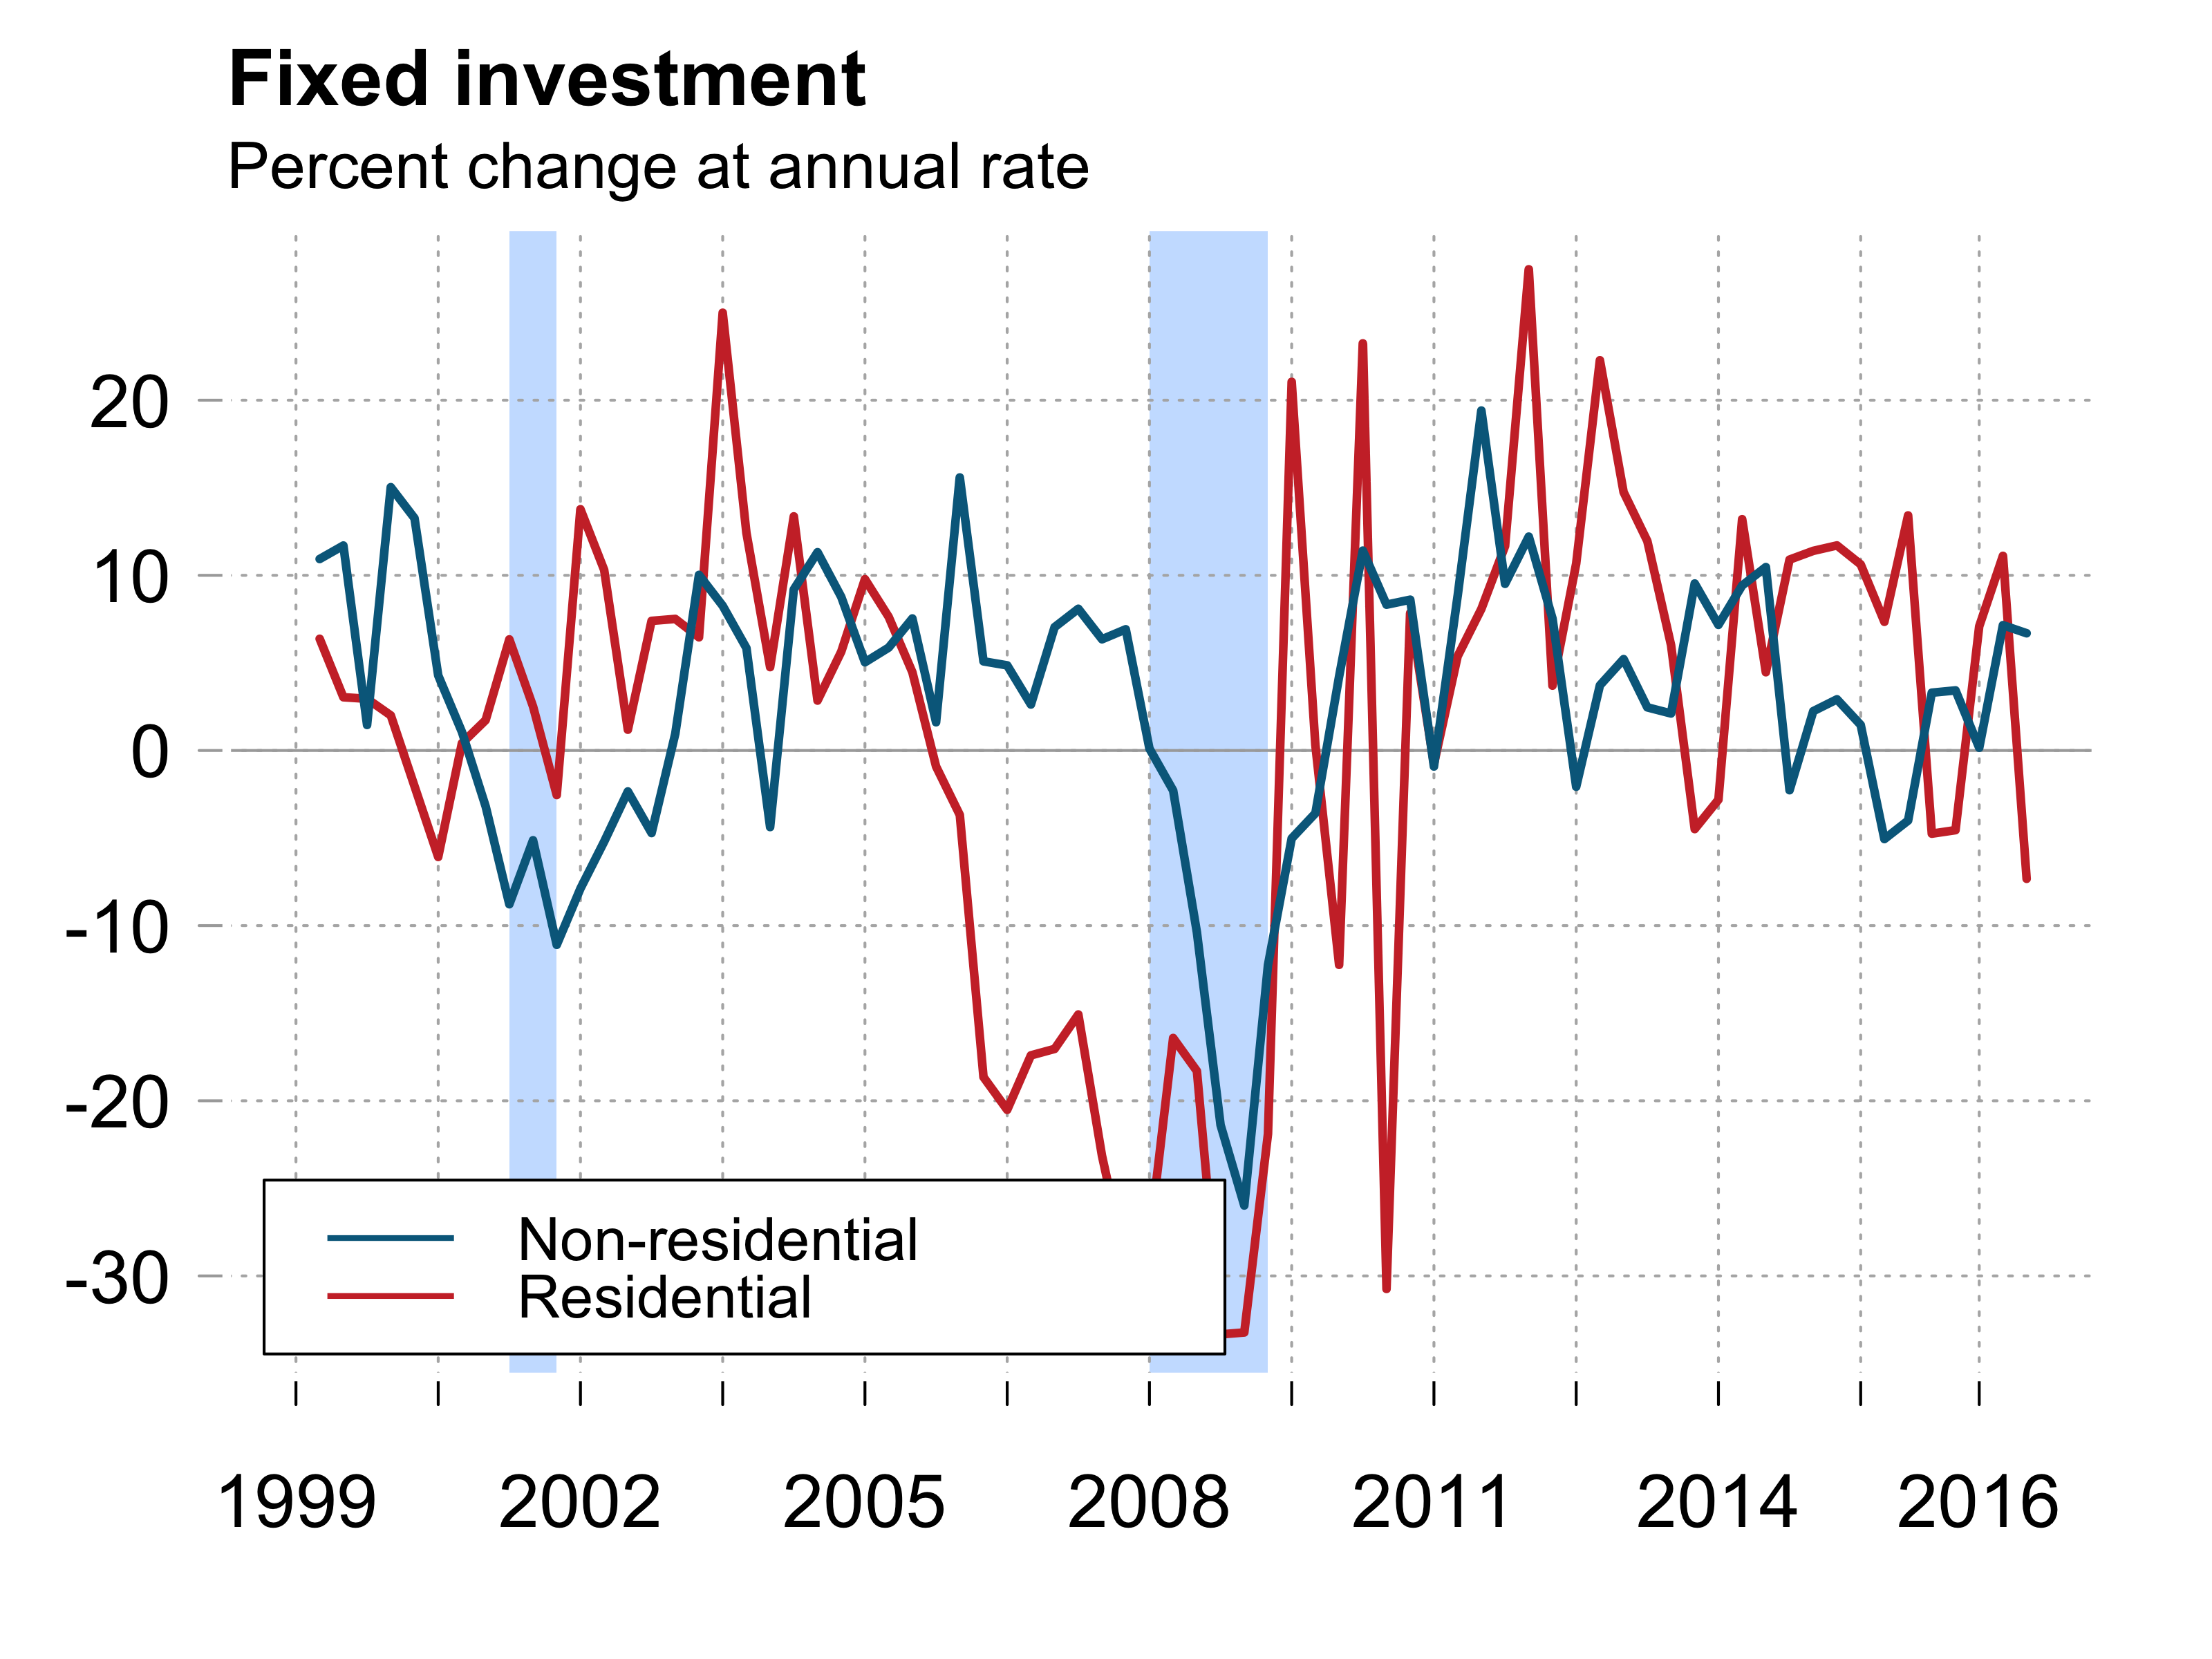
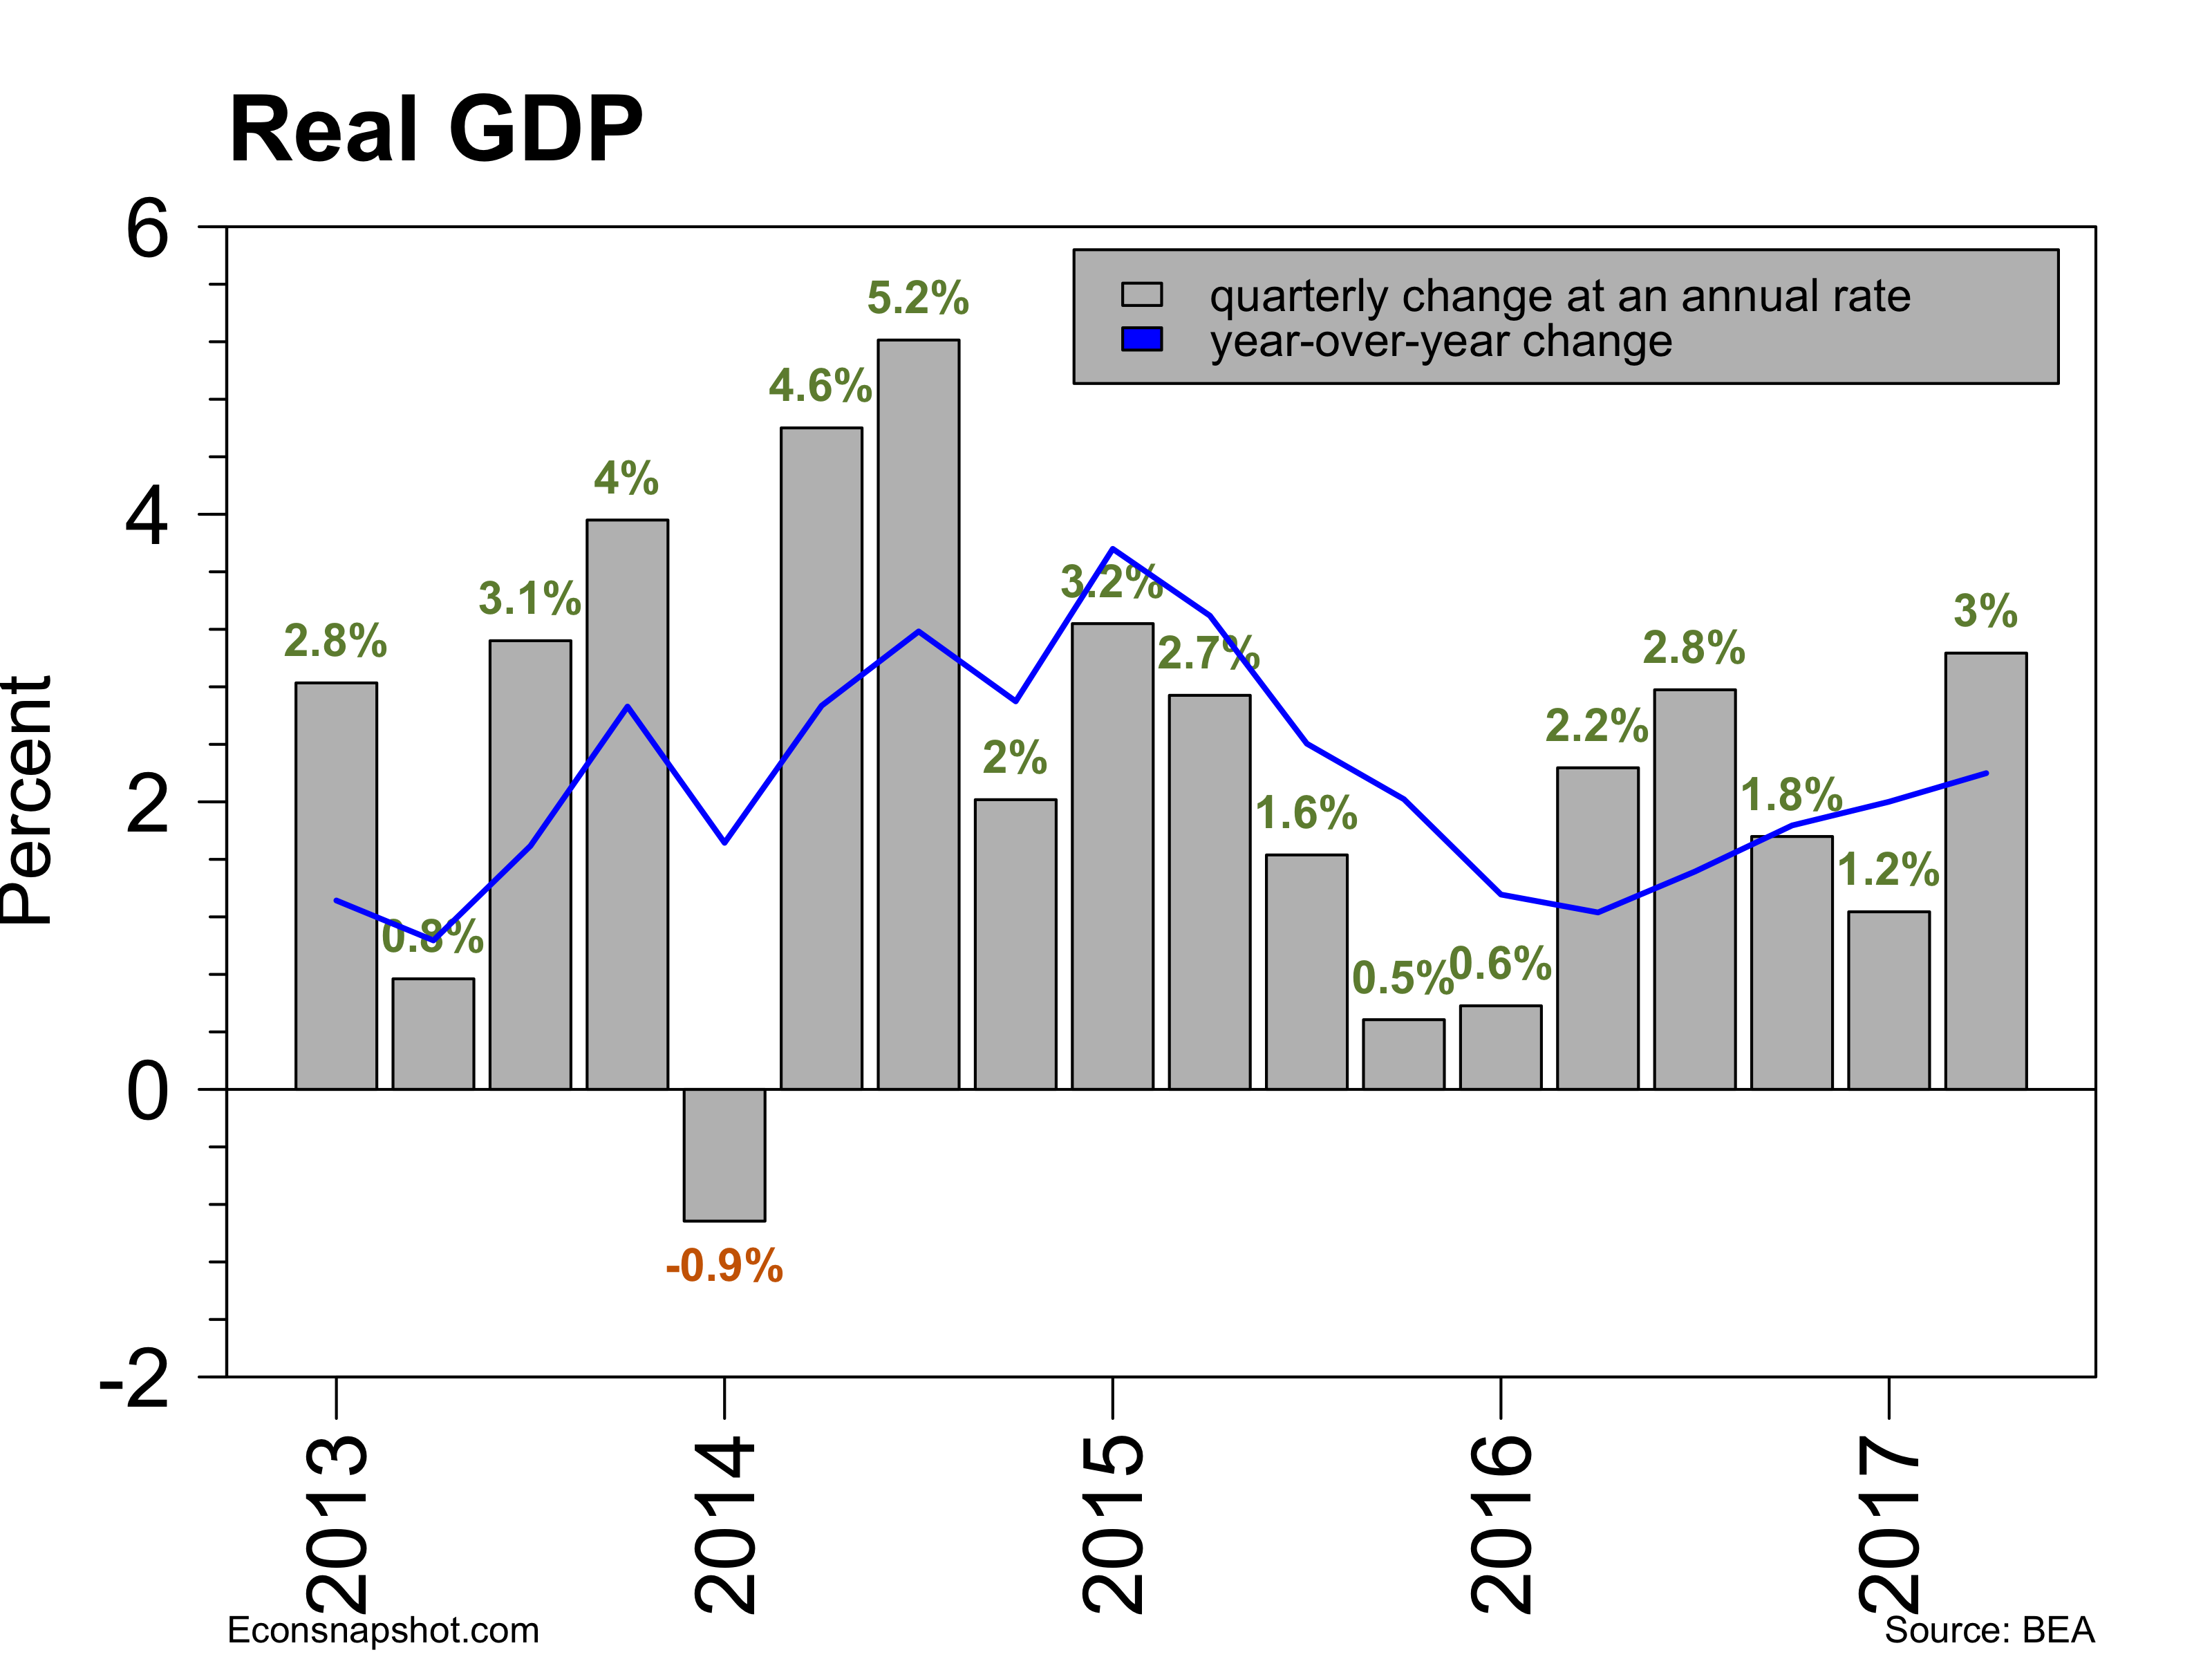
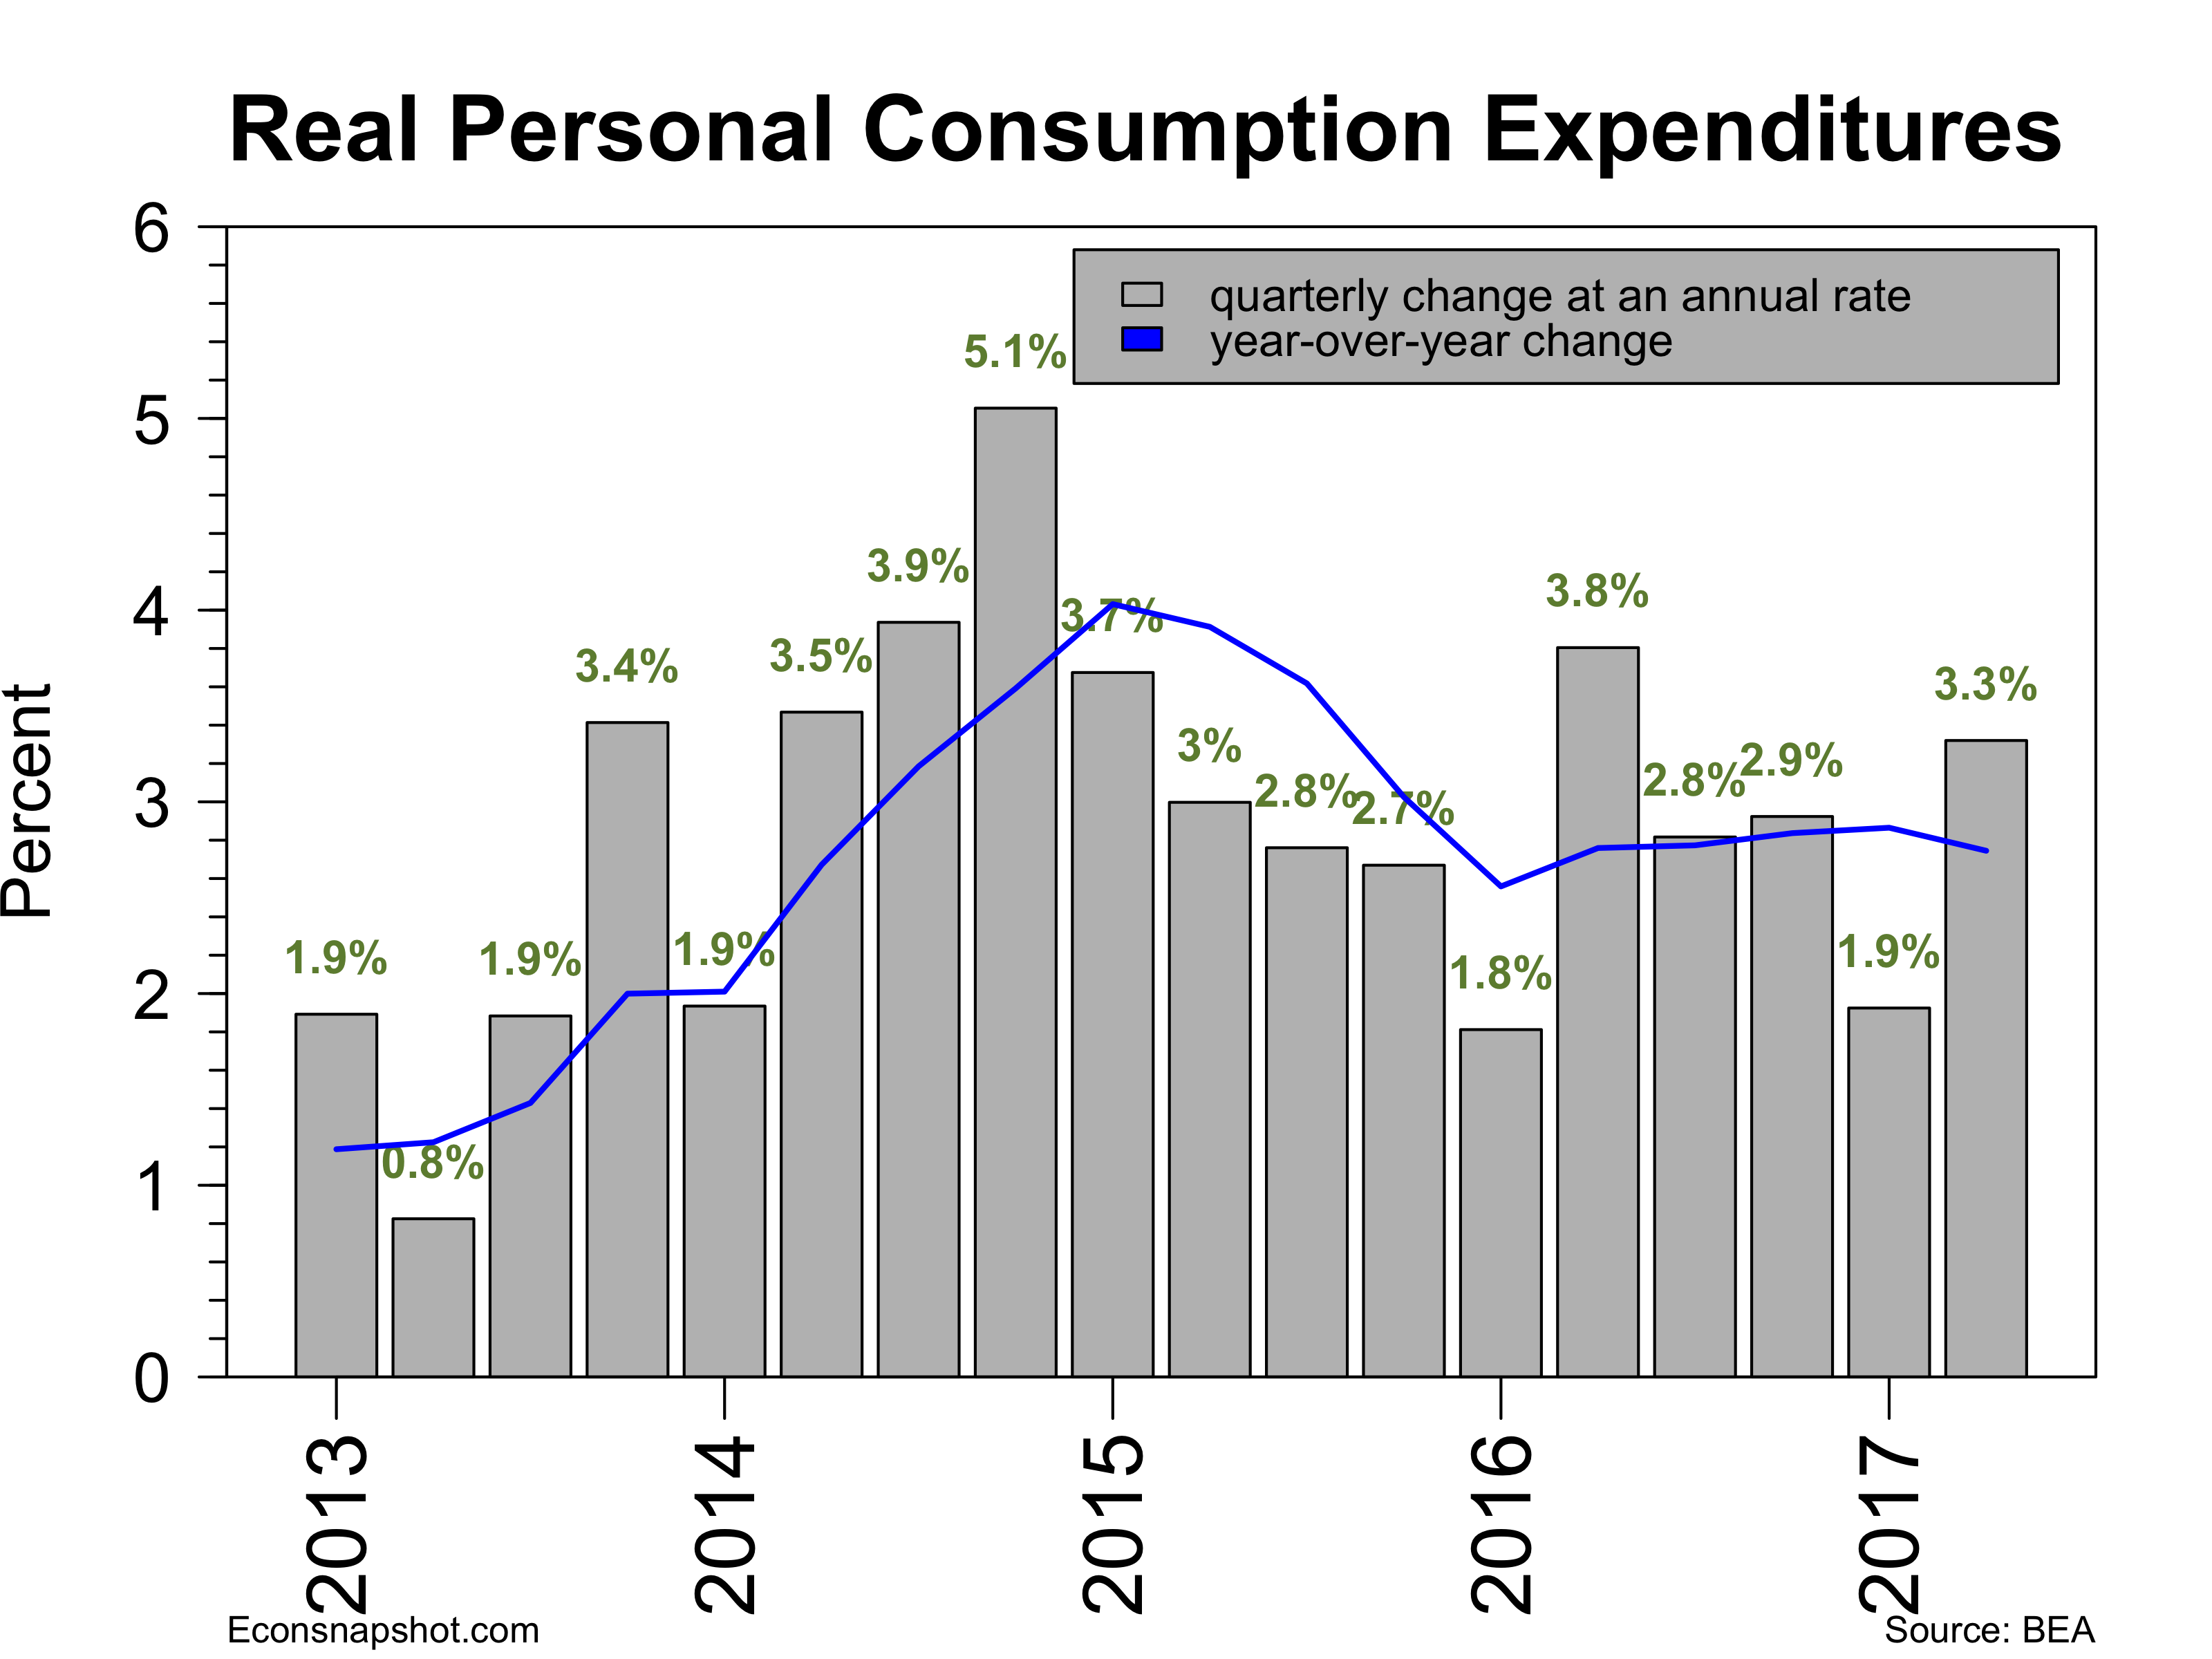
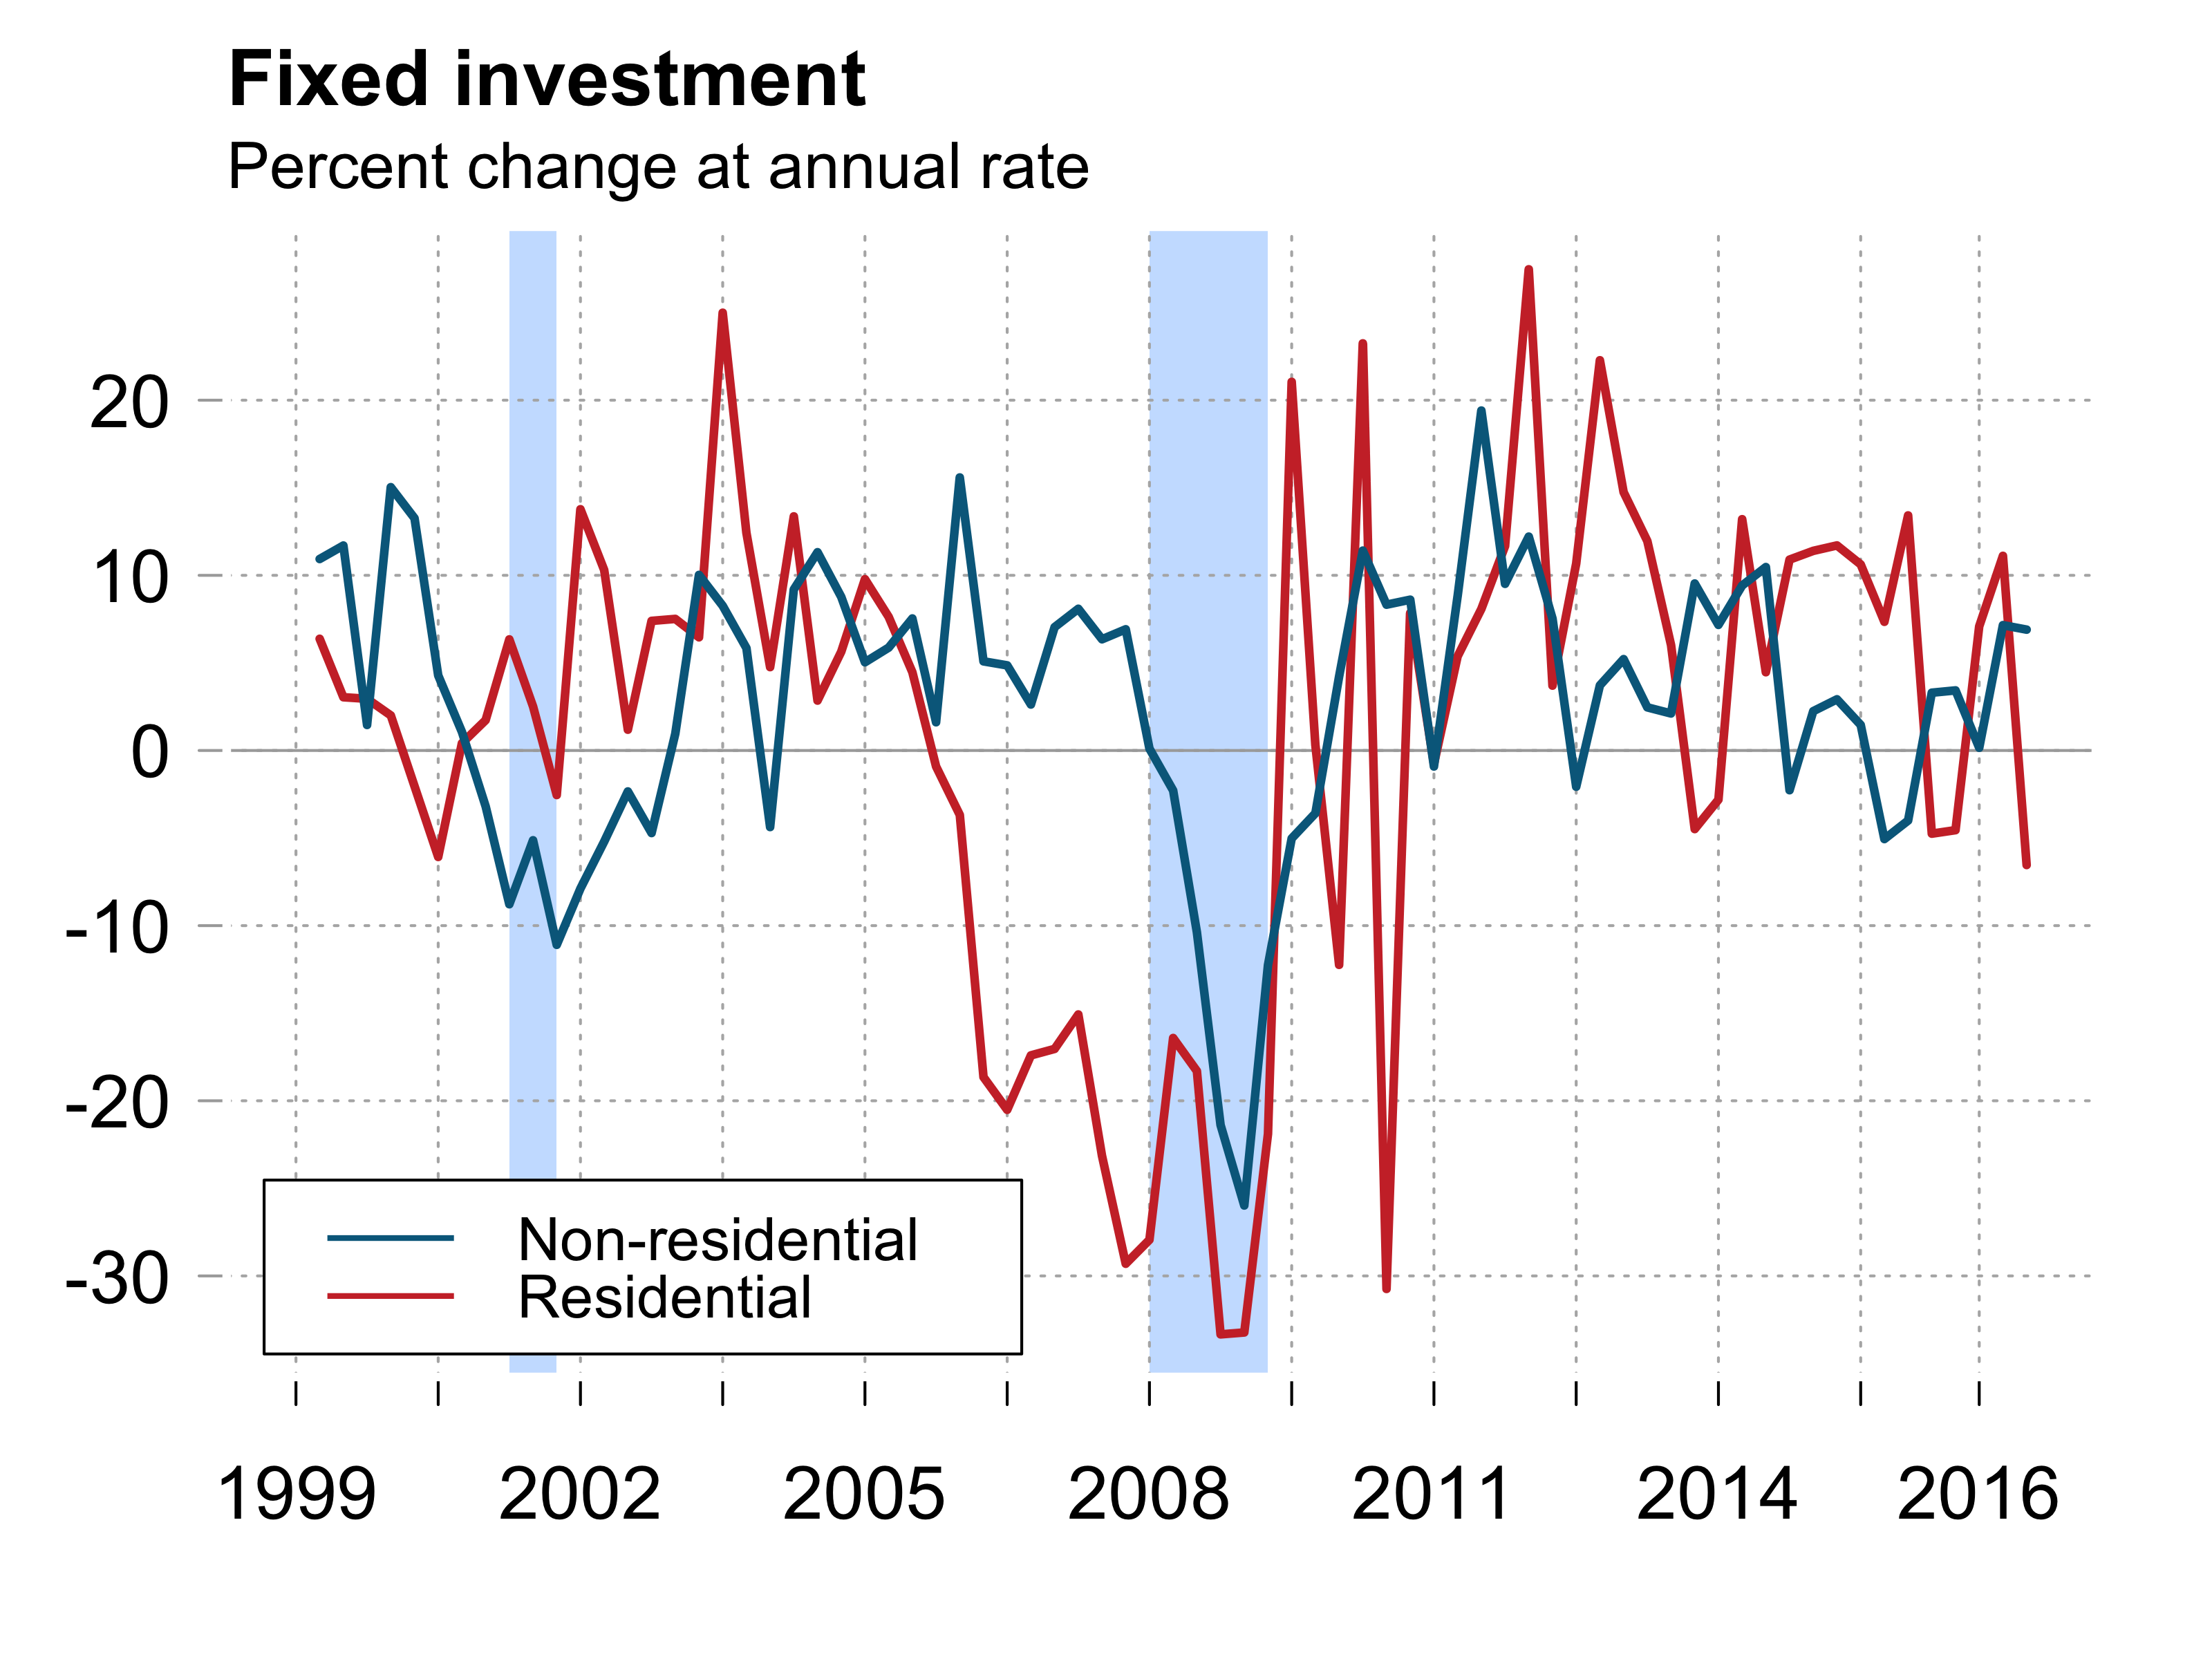
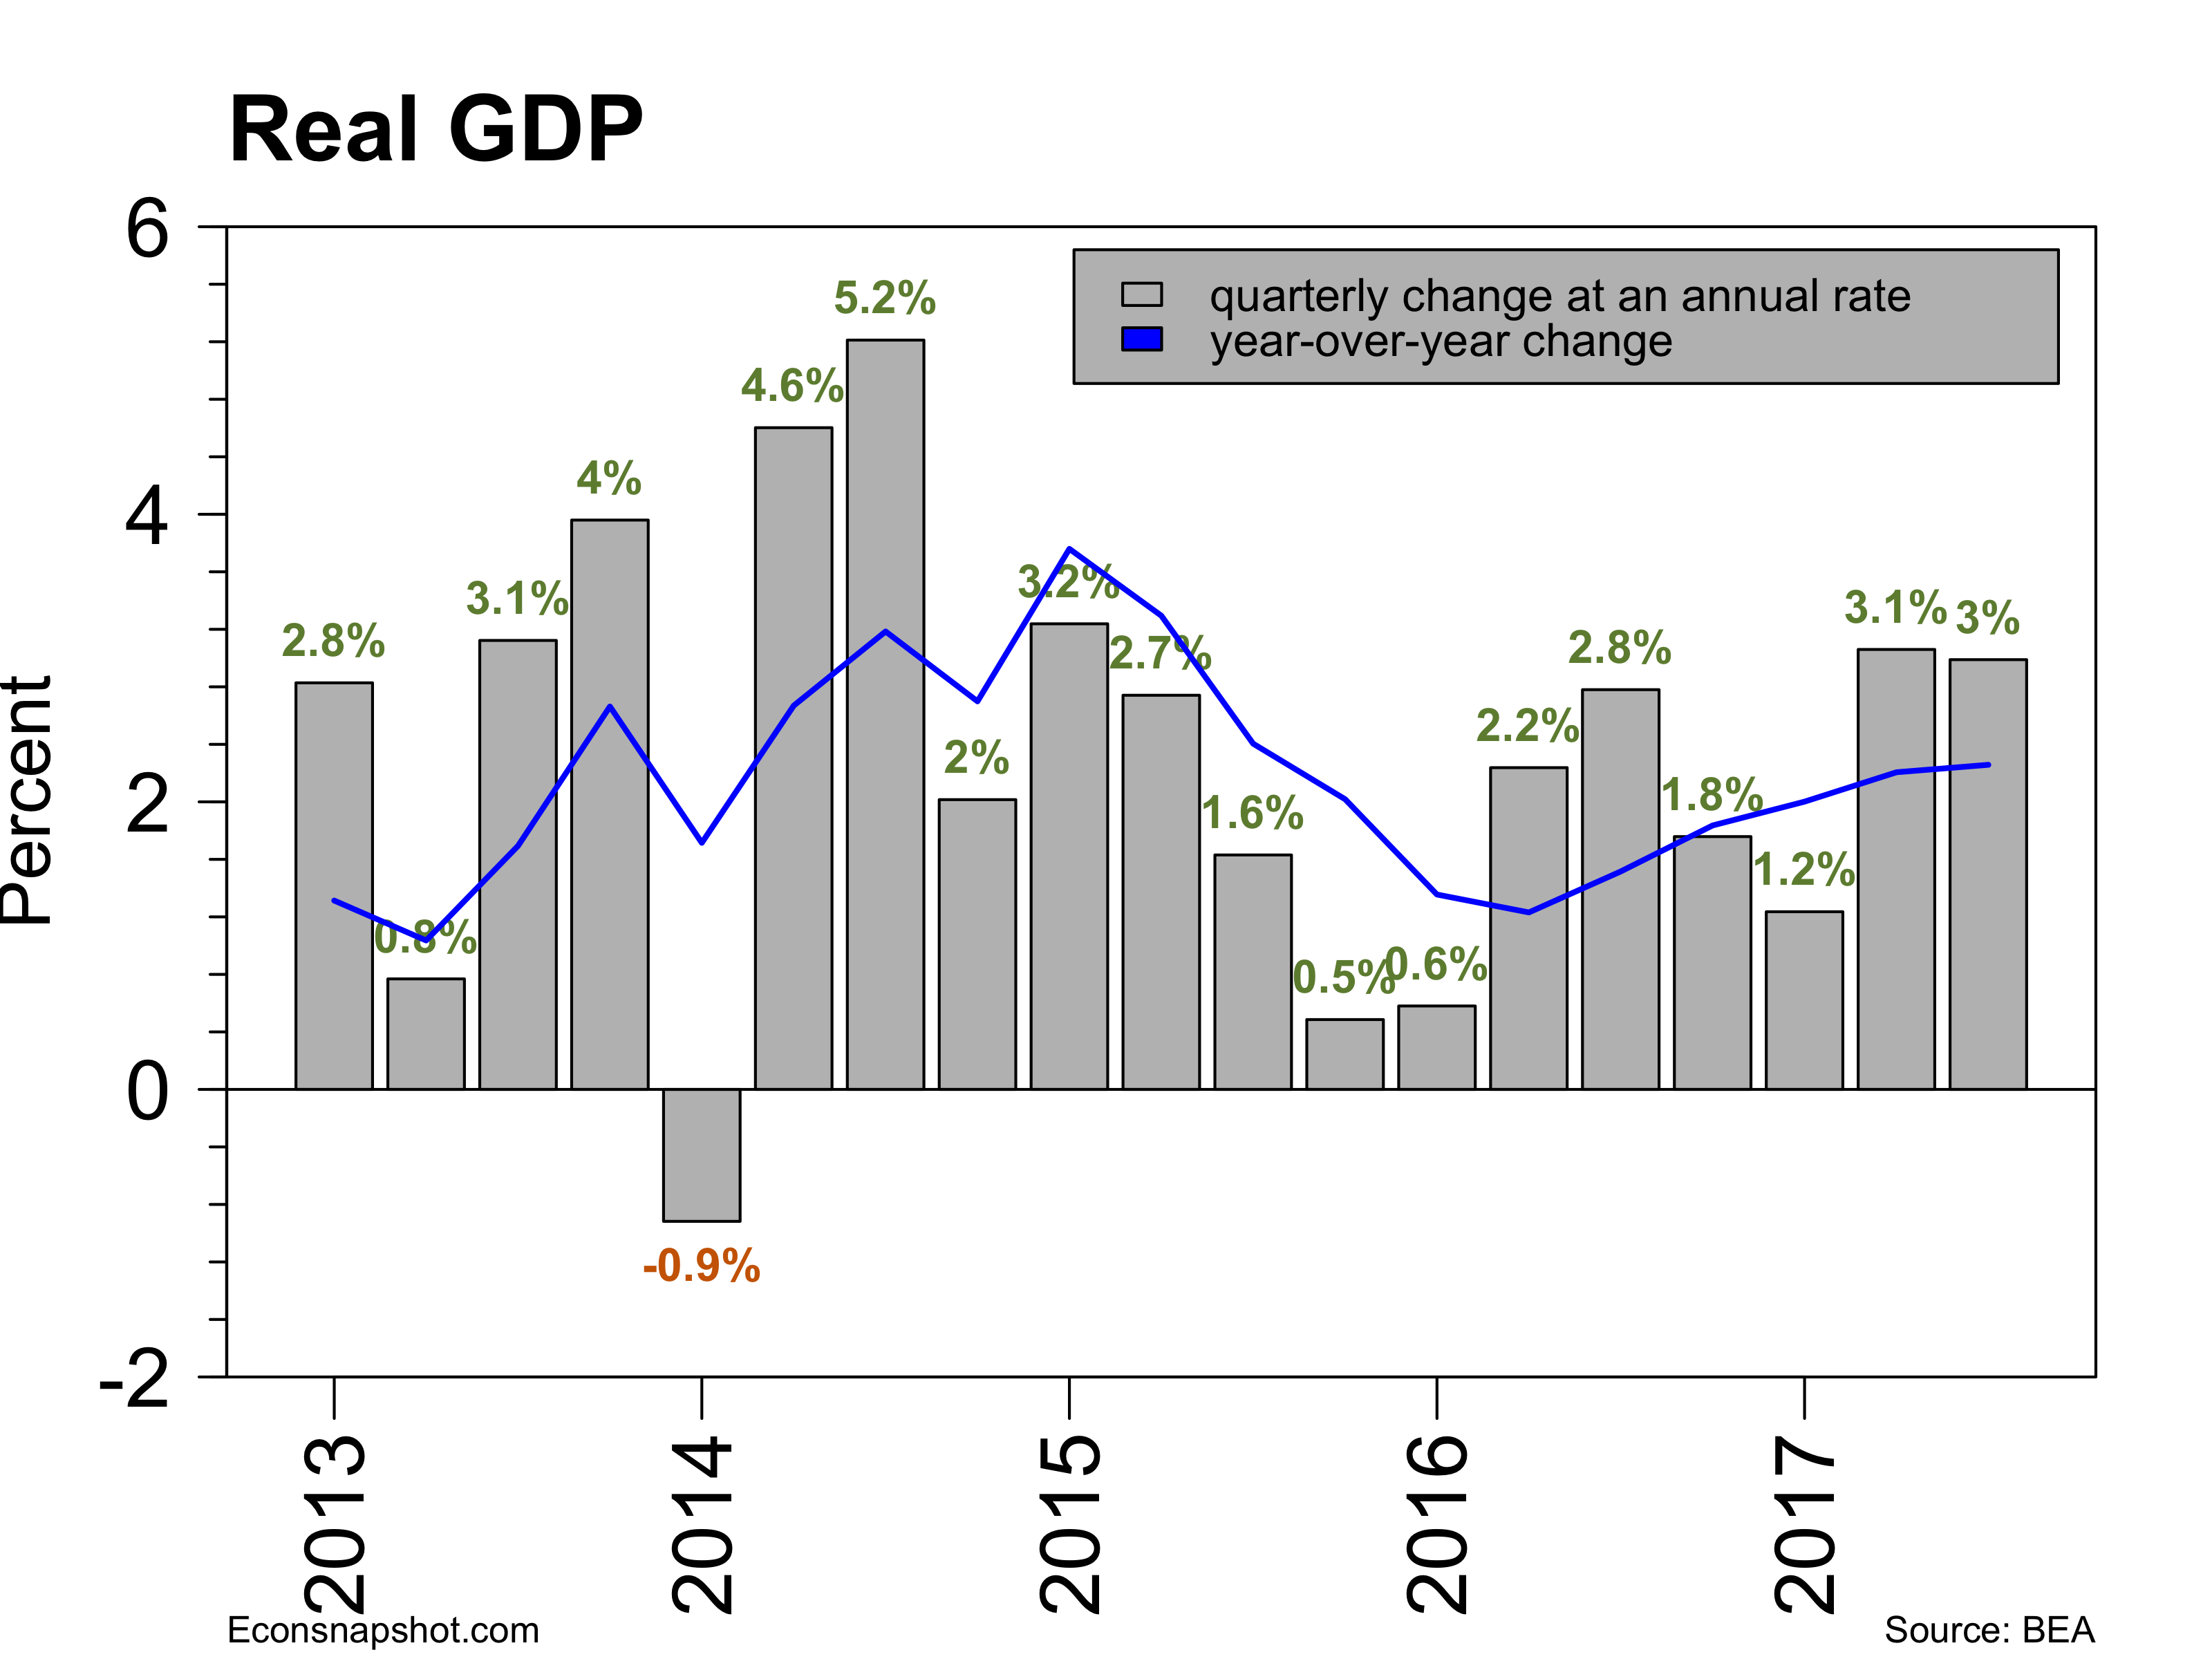
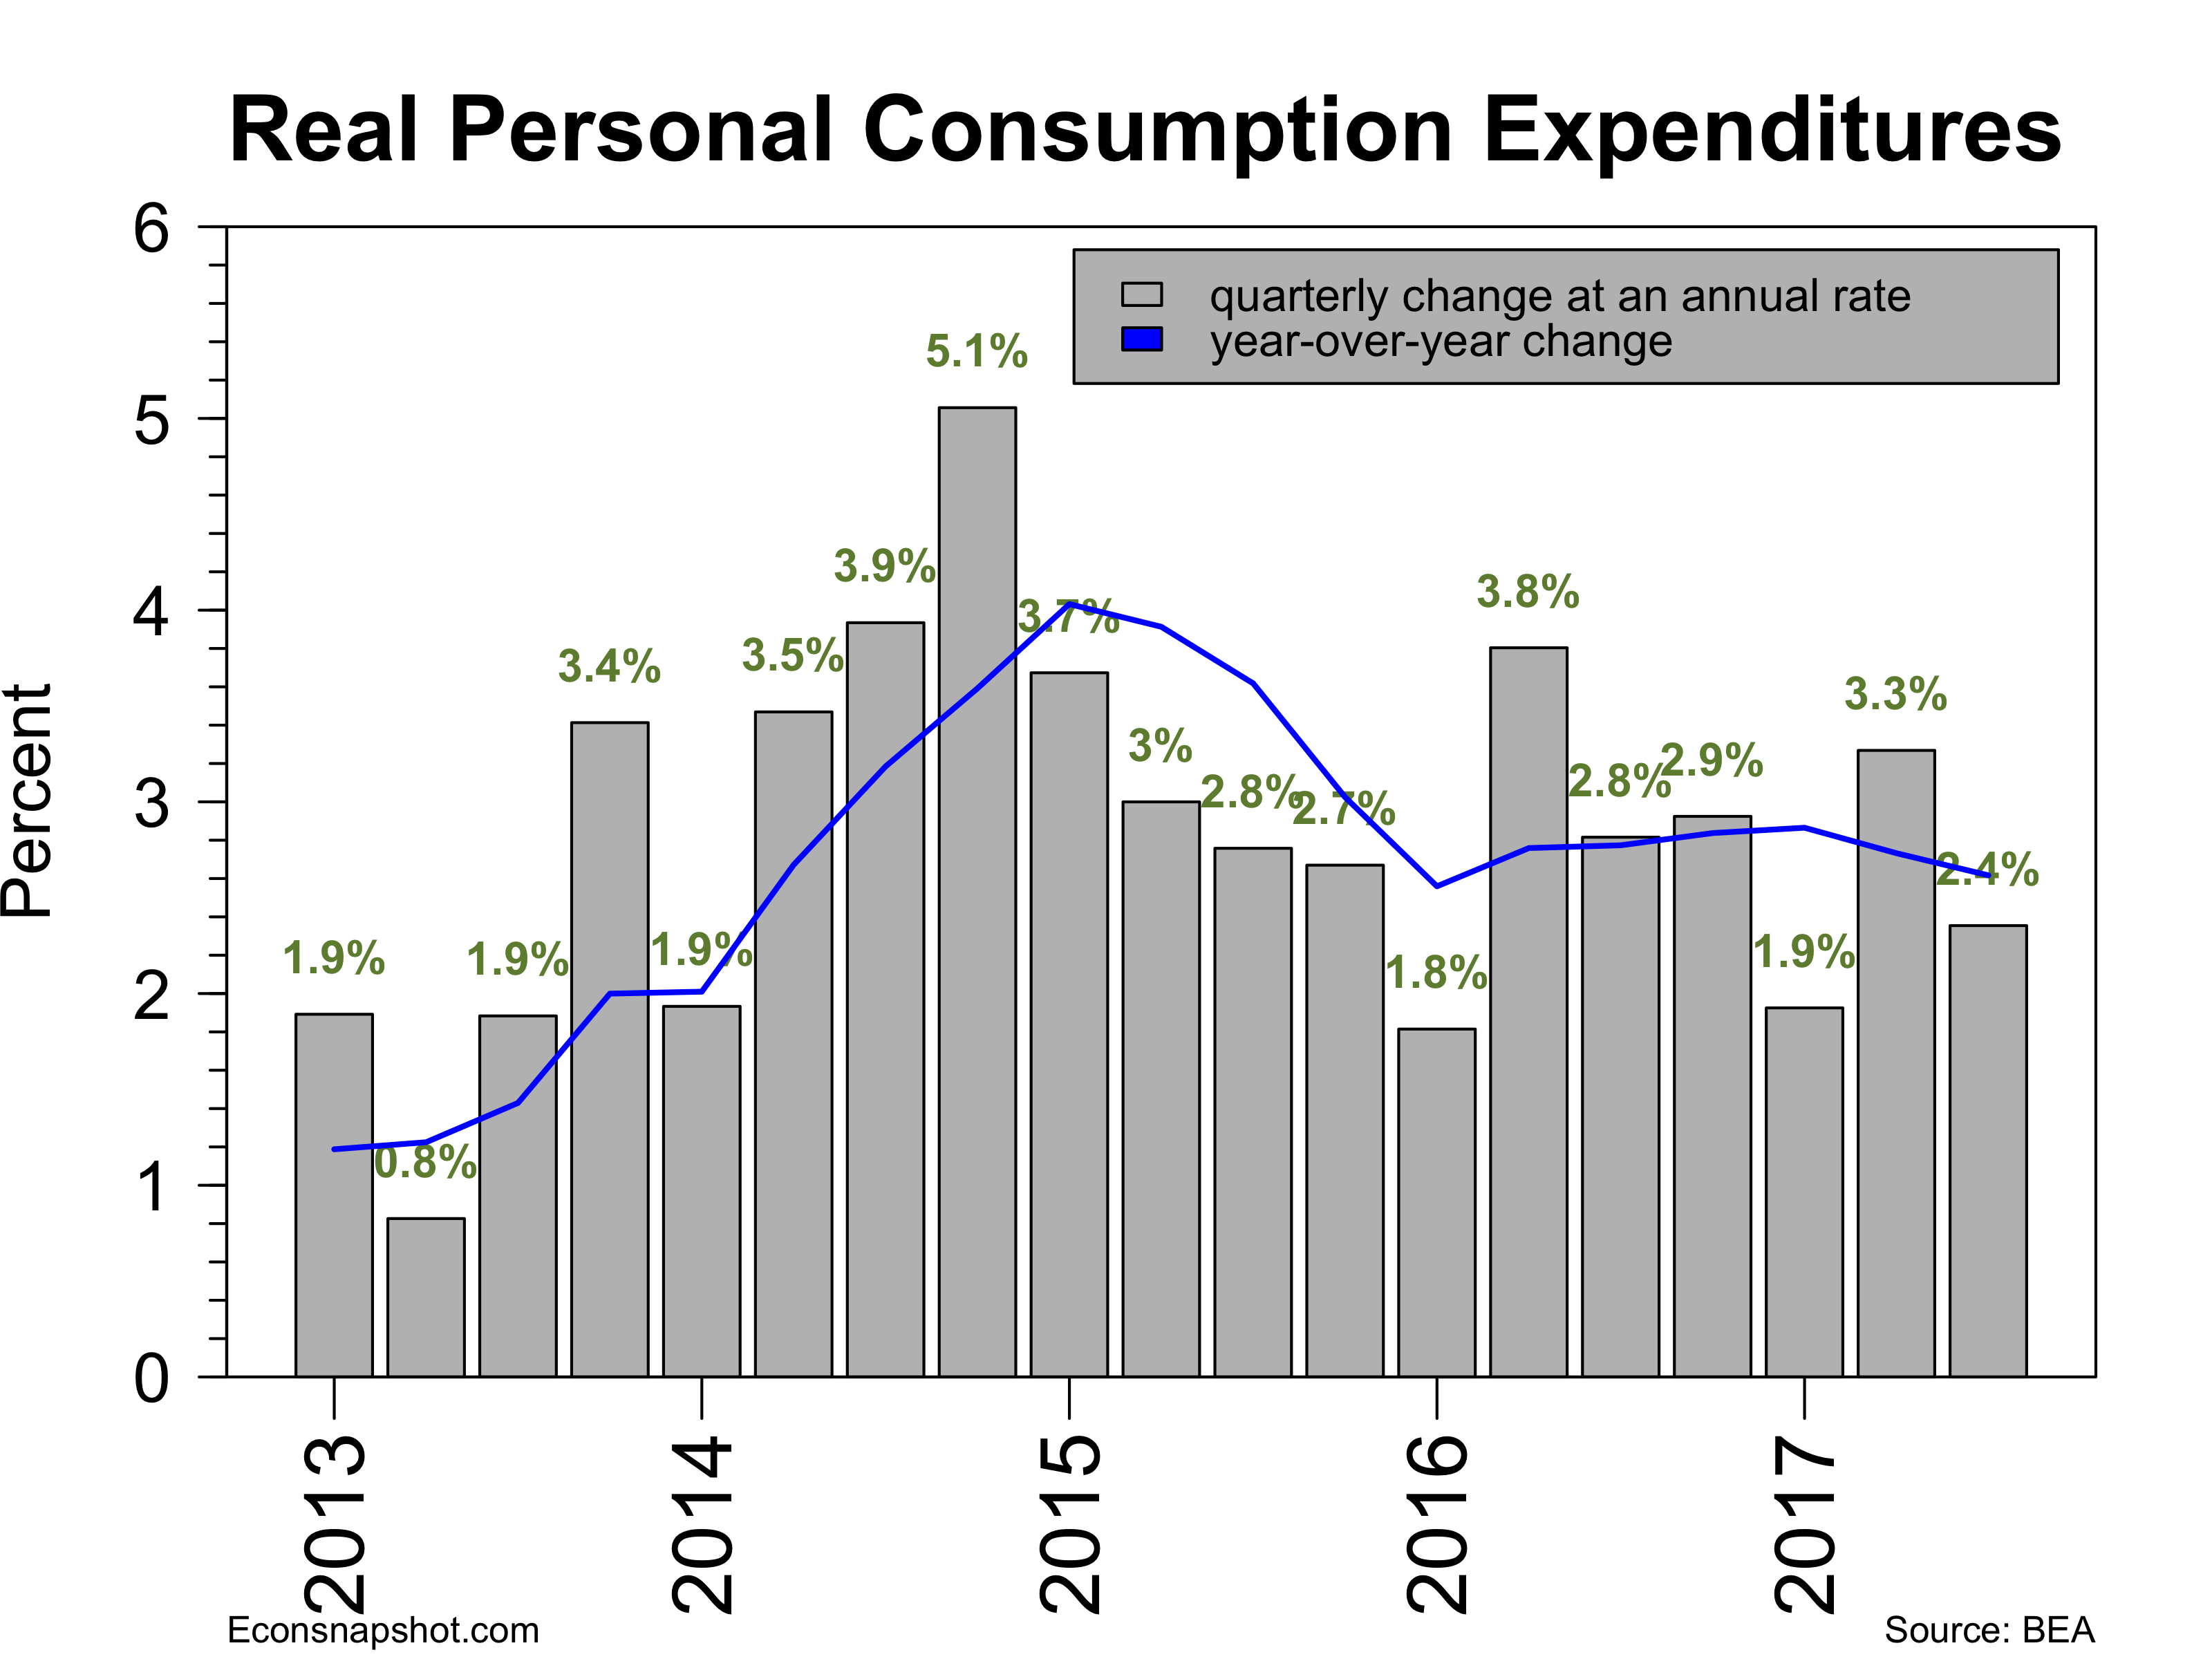
The BEA announced that GDP grew 3.0% the advance estimate for Q3 following a 3.1% rise in Q2. This was the strongest two-quarter increase since Q2-Q3 in 2014. The economy is rolling along despite the disruption from hurricanes and the uncertainty about future policies. Consumption expenditures remain strong, increasing 2.4% and durable goods increasing 8.3%. Investment in structures, both residential and non-residential, however, was quite weak, falling -6.0% and -5.2%, respectively. On the other hand equipment investment grew at 8.6% and intellectual property products at 4.3%.

gdprealchgm1-2017-10-27

pcerealchgm1-2017-10-27

pce_goods-2017-10-27

resnonres-2017-10-27

As the affected areas rebuild from the hurricanes and wildfires the prospects are that economic activity will remain strong in the fourth quarter.  The only worries are longer term concerns about the impact of policies originating in the Whitehouse. Bu they remain very uncertain as of now.

The Labor Market Remains Robust

By Thomas Cooley and Peter Rupert

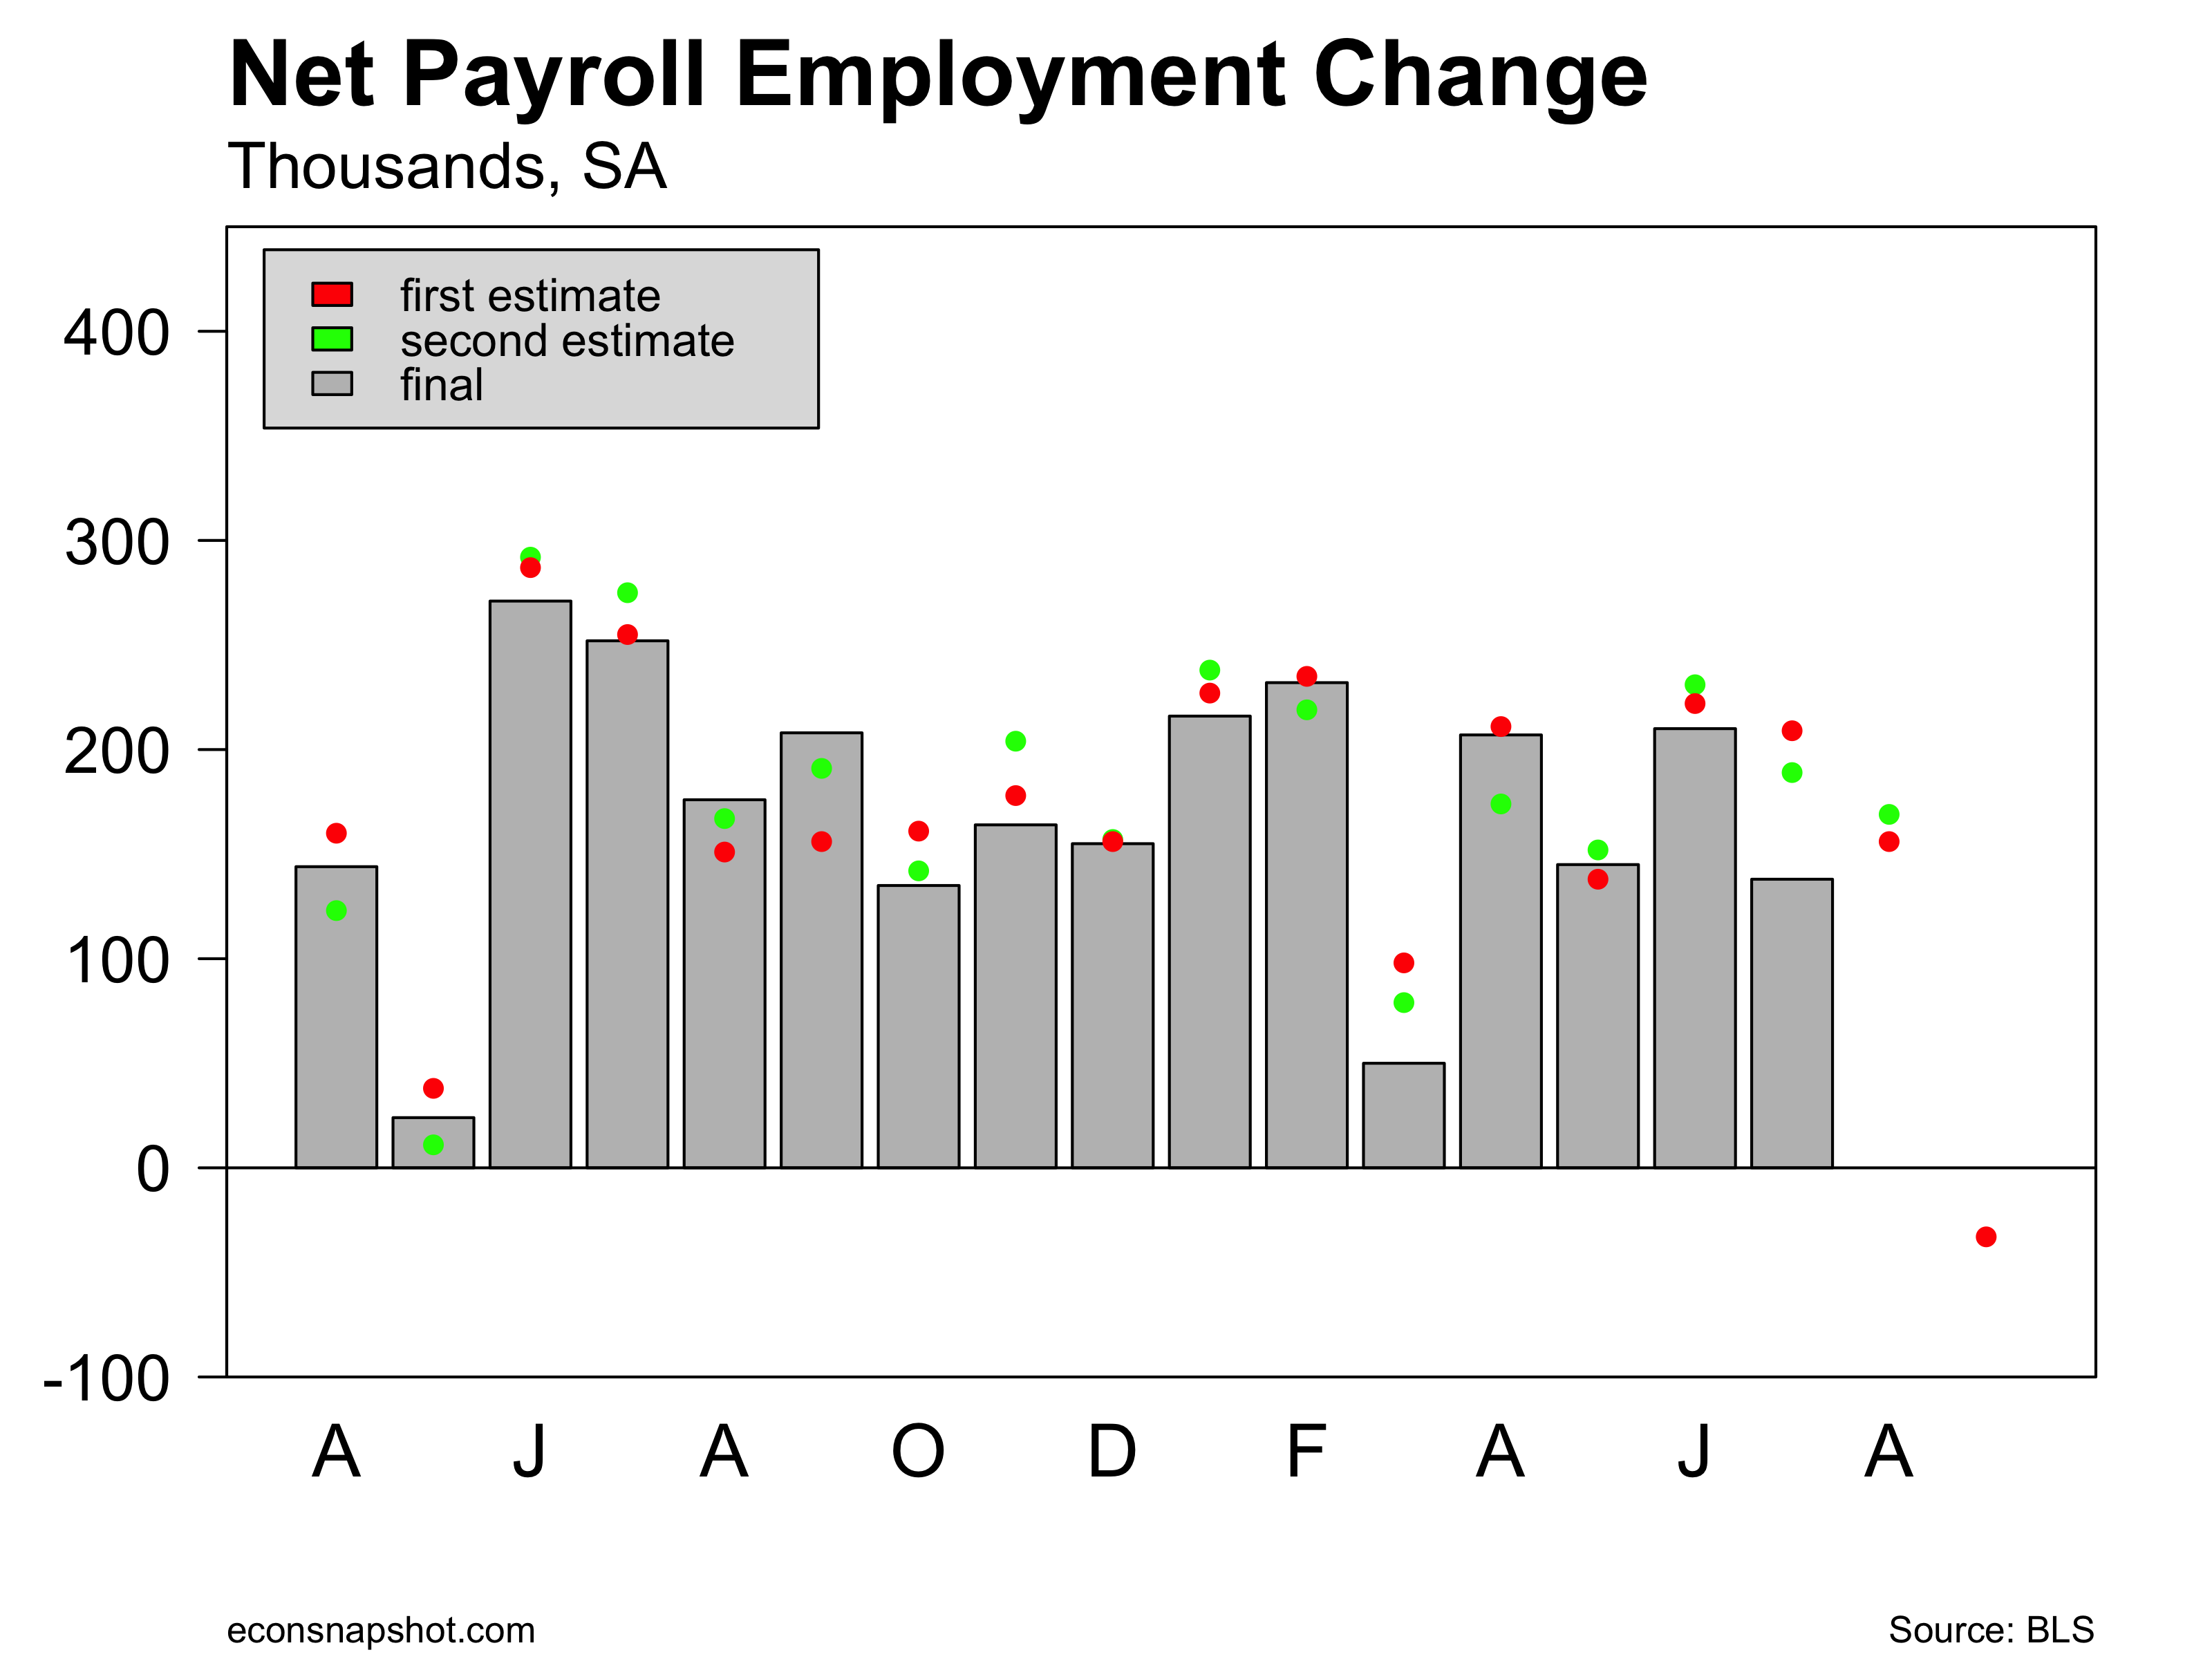
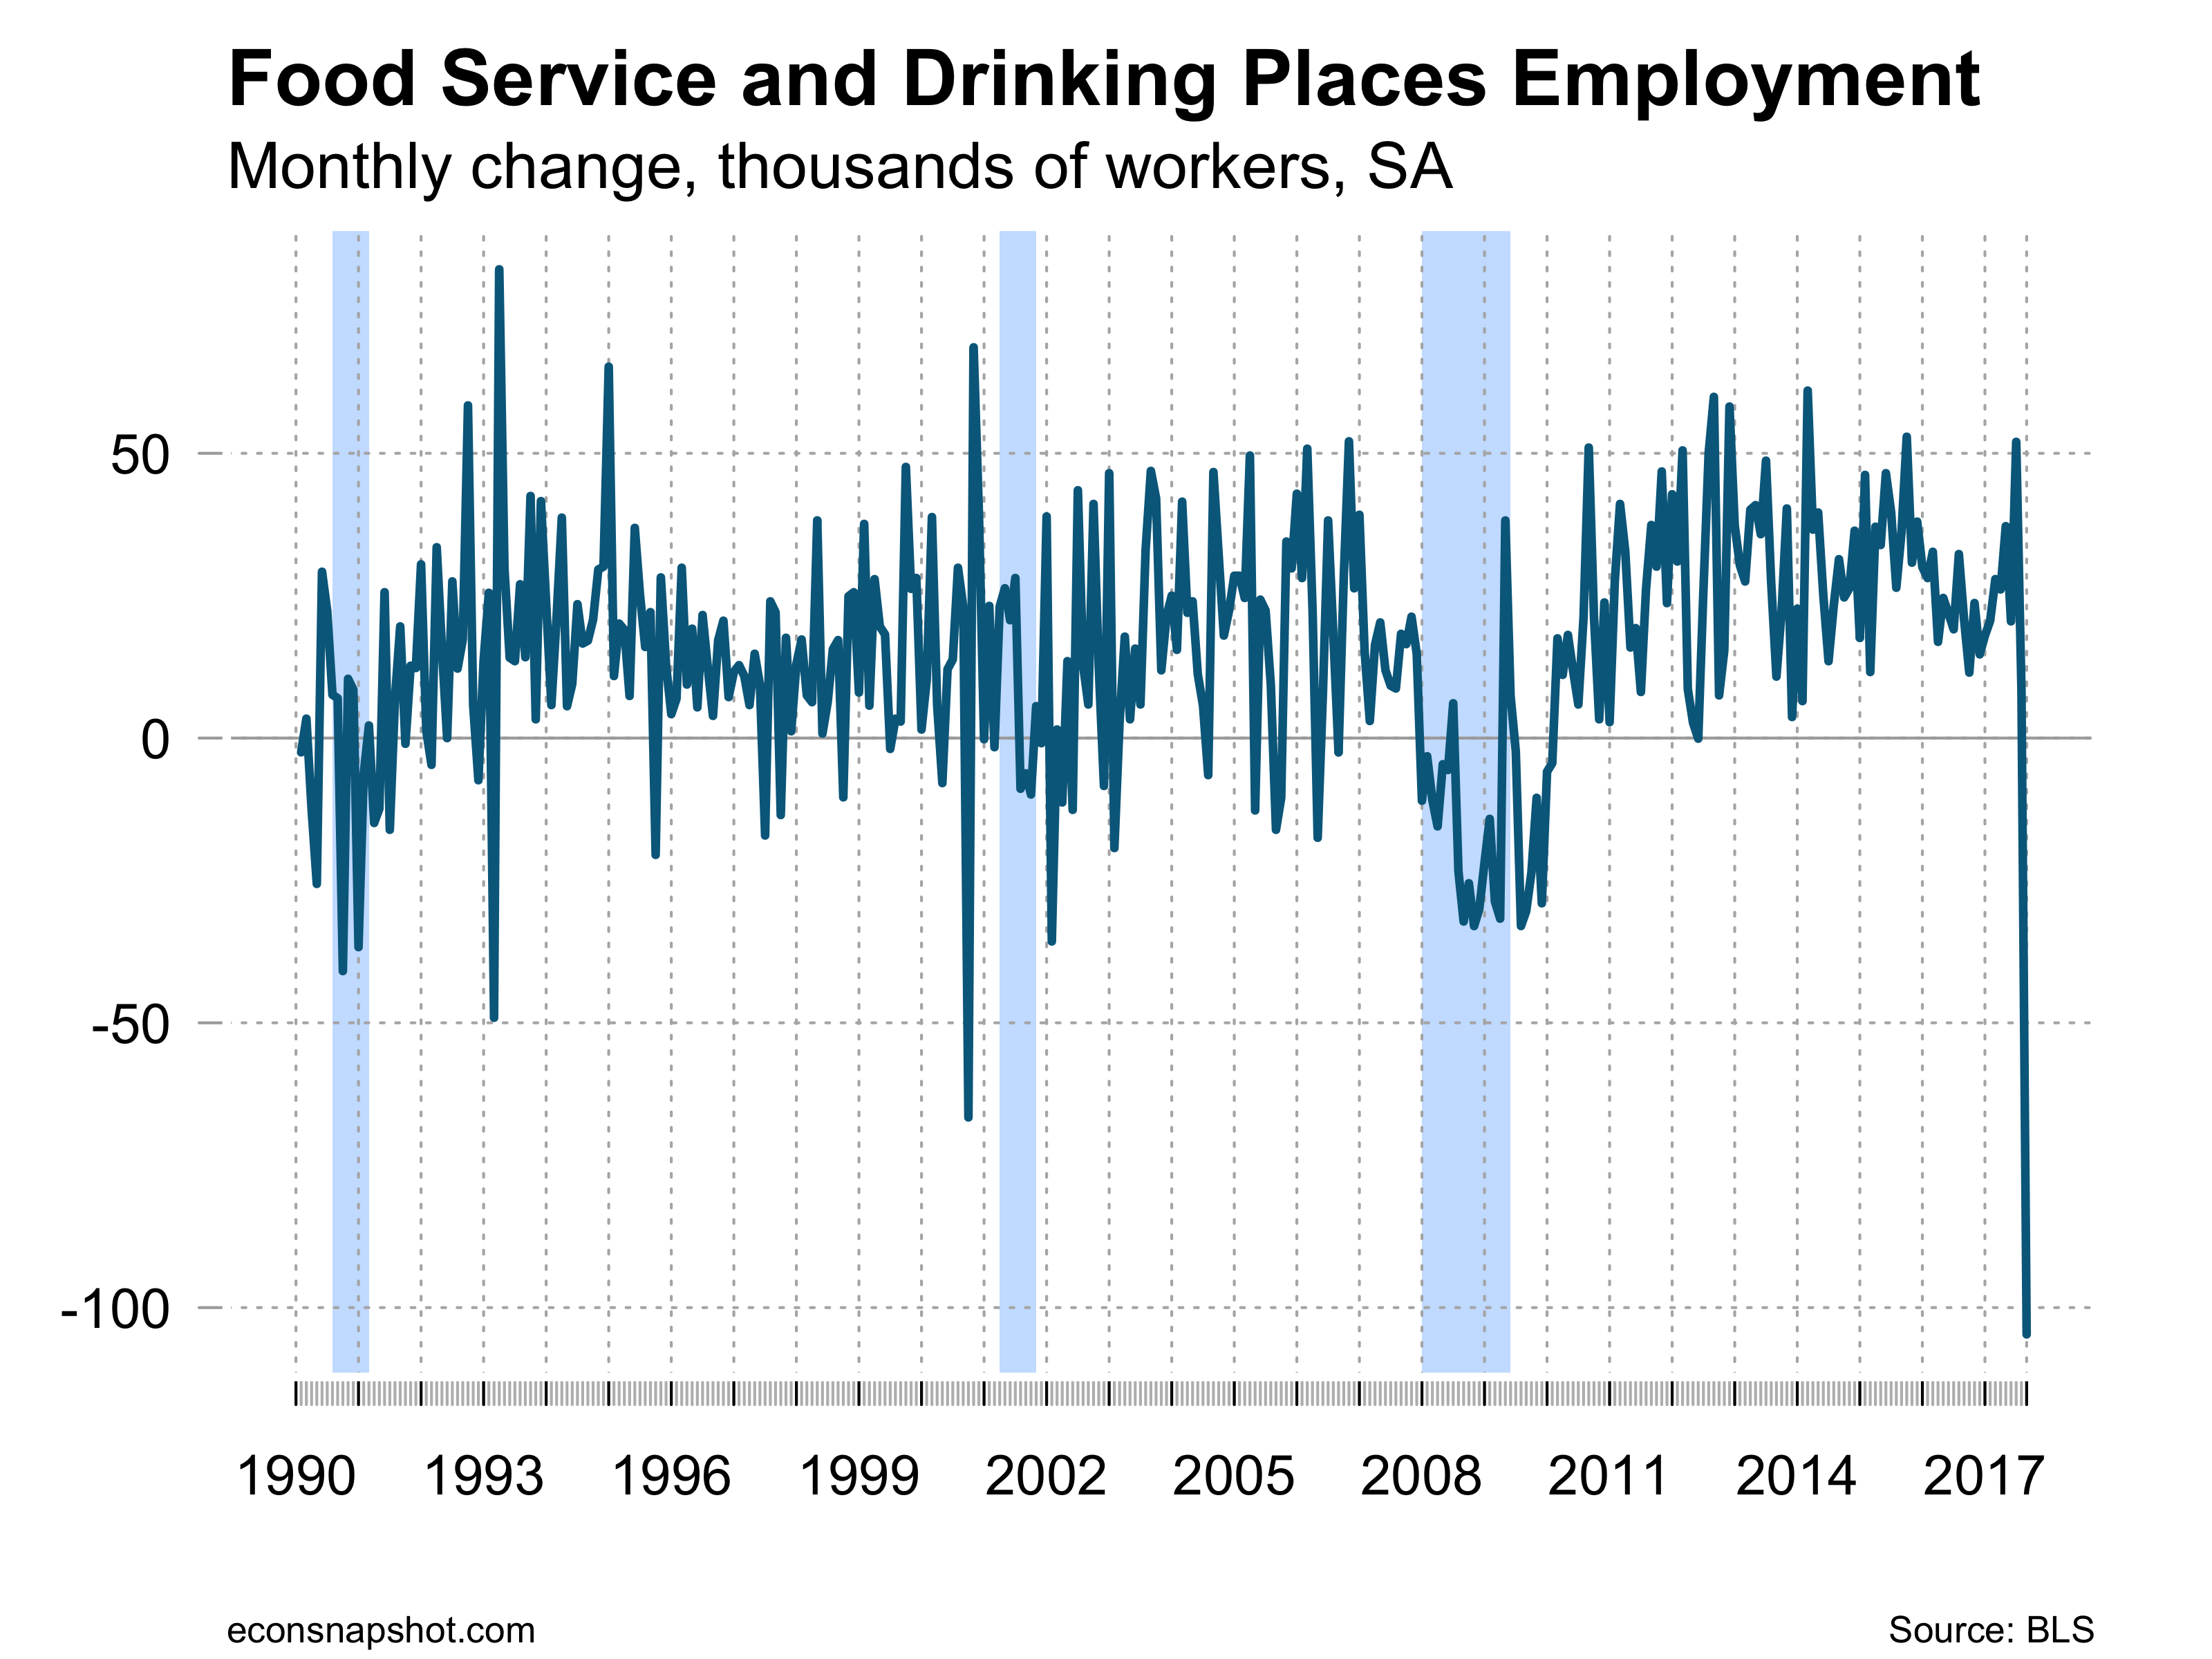
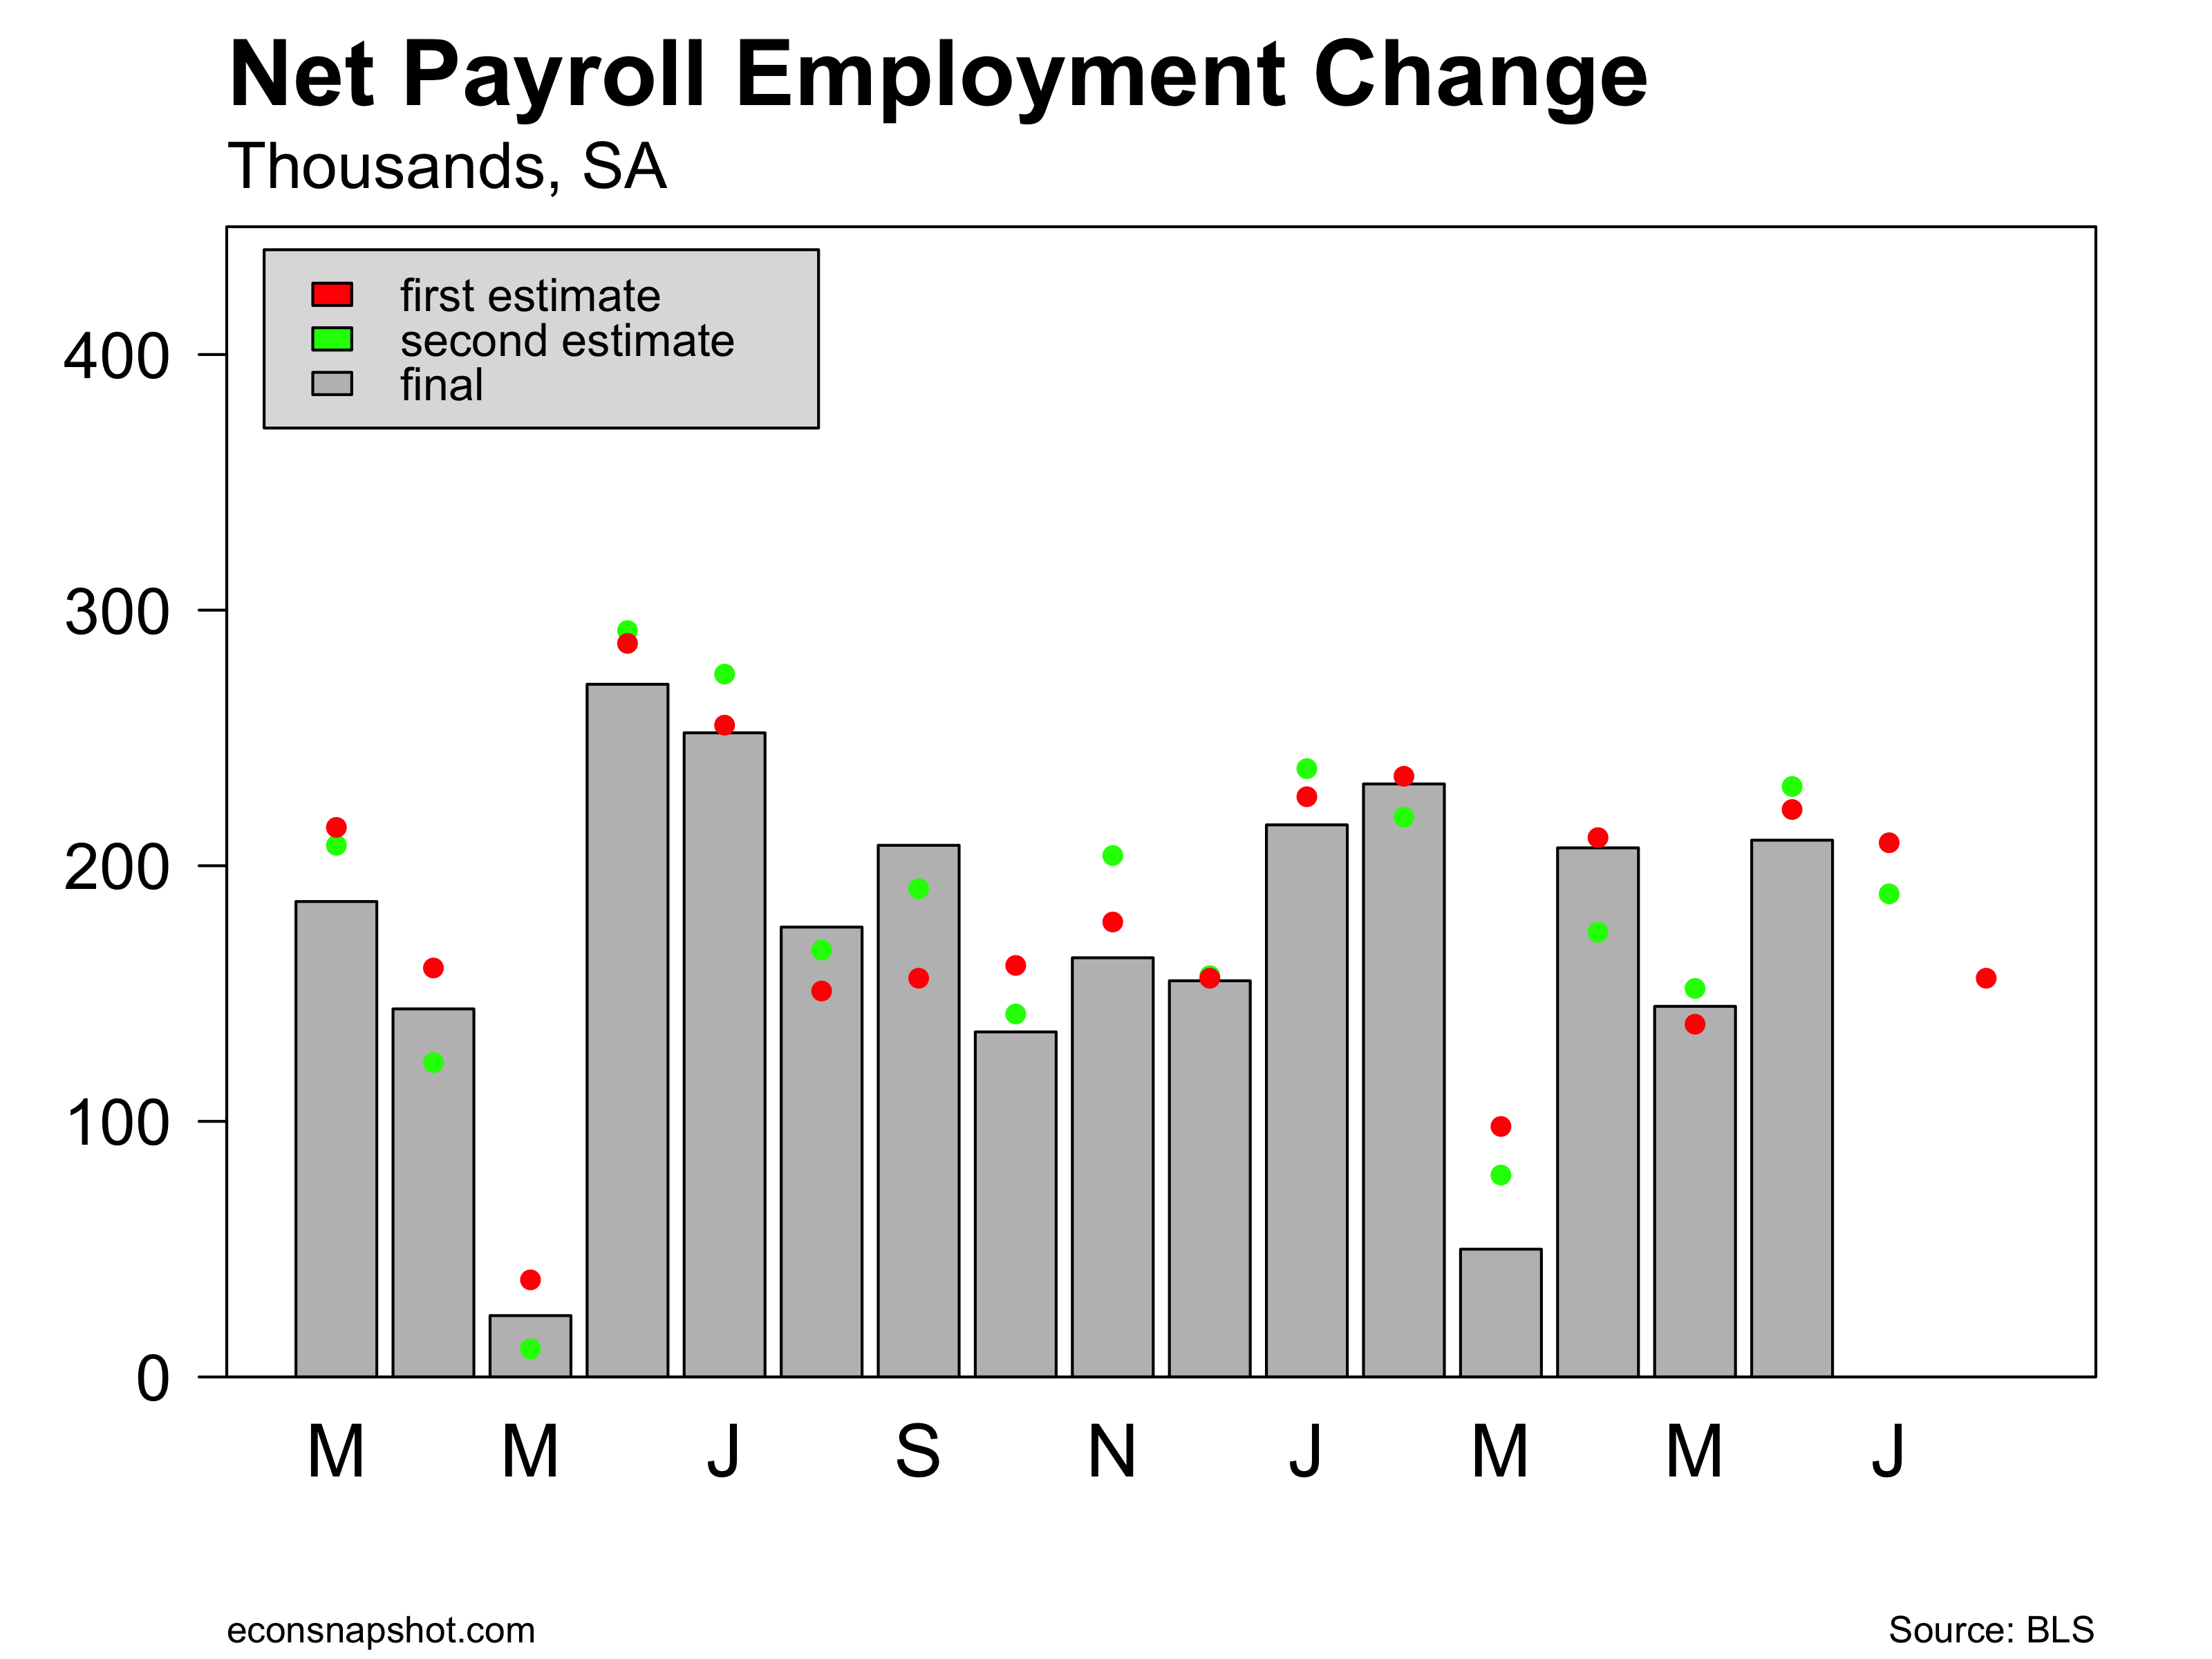
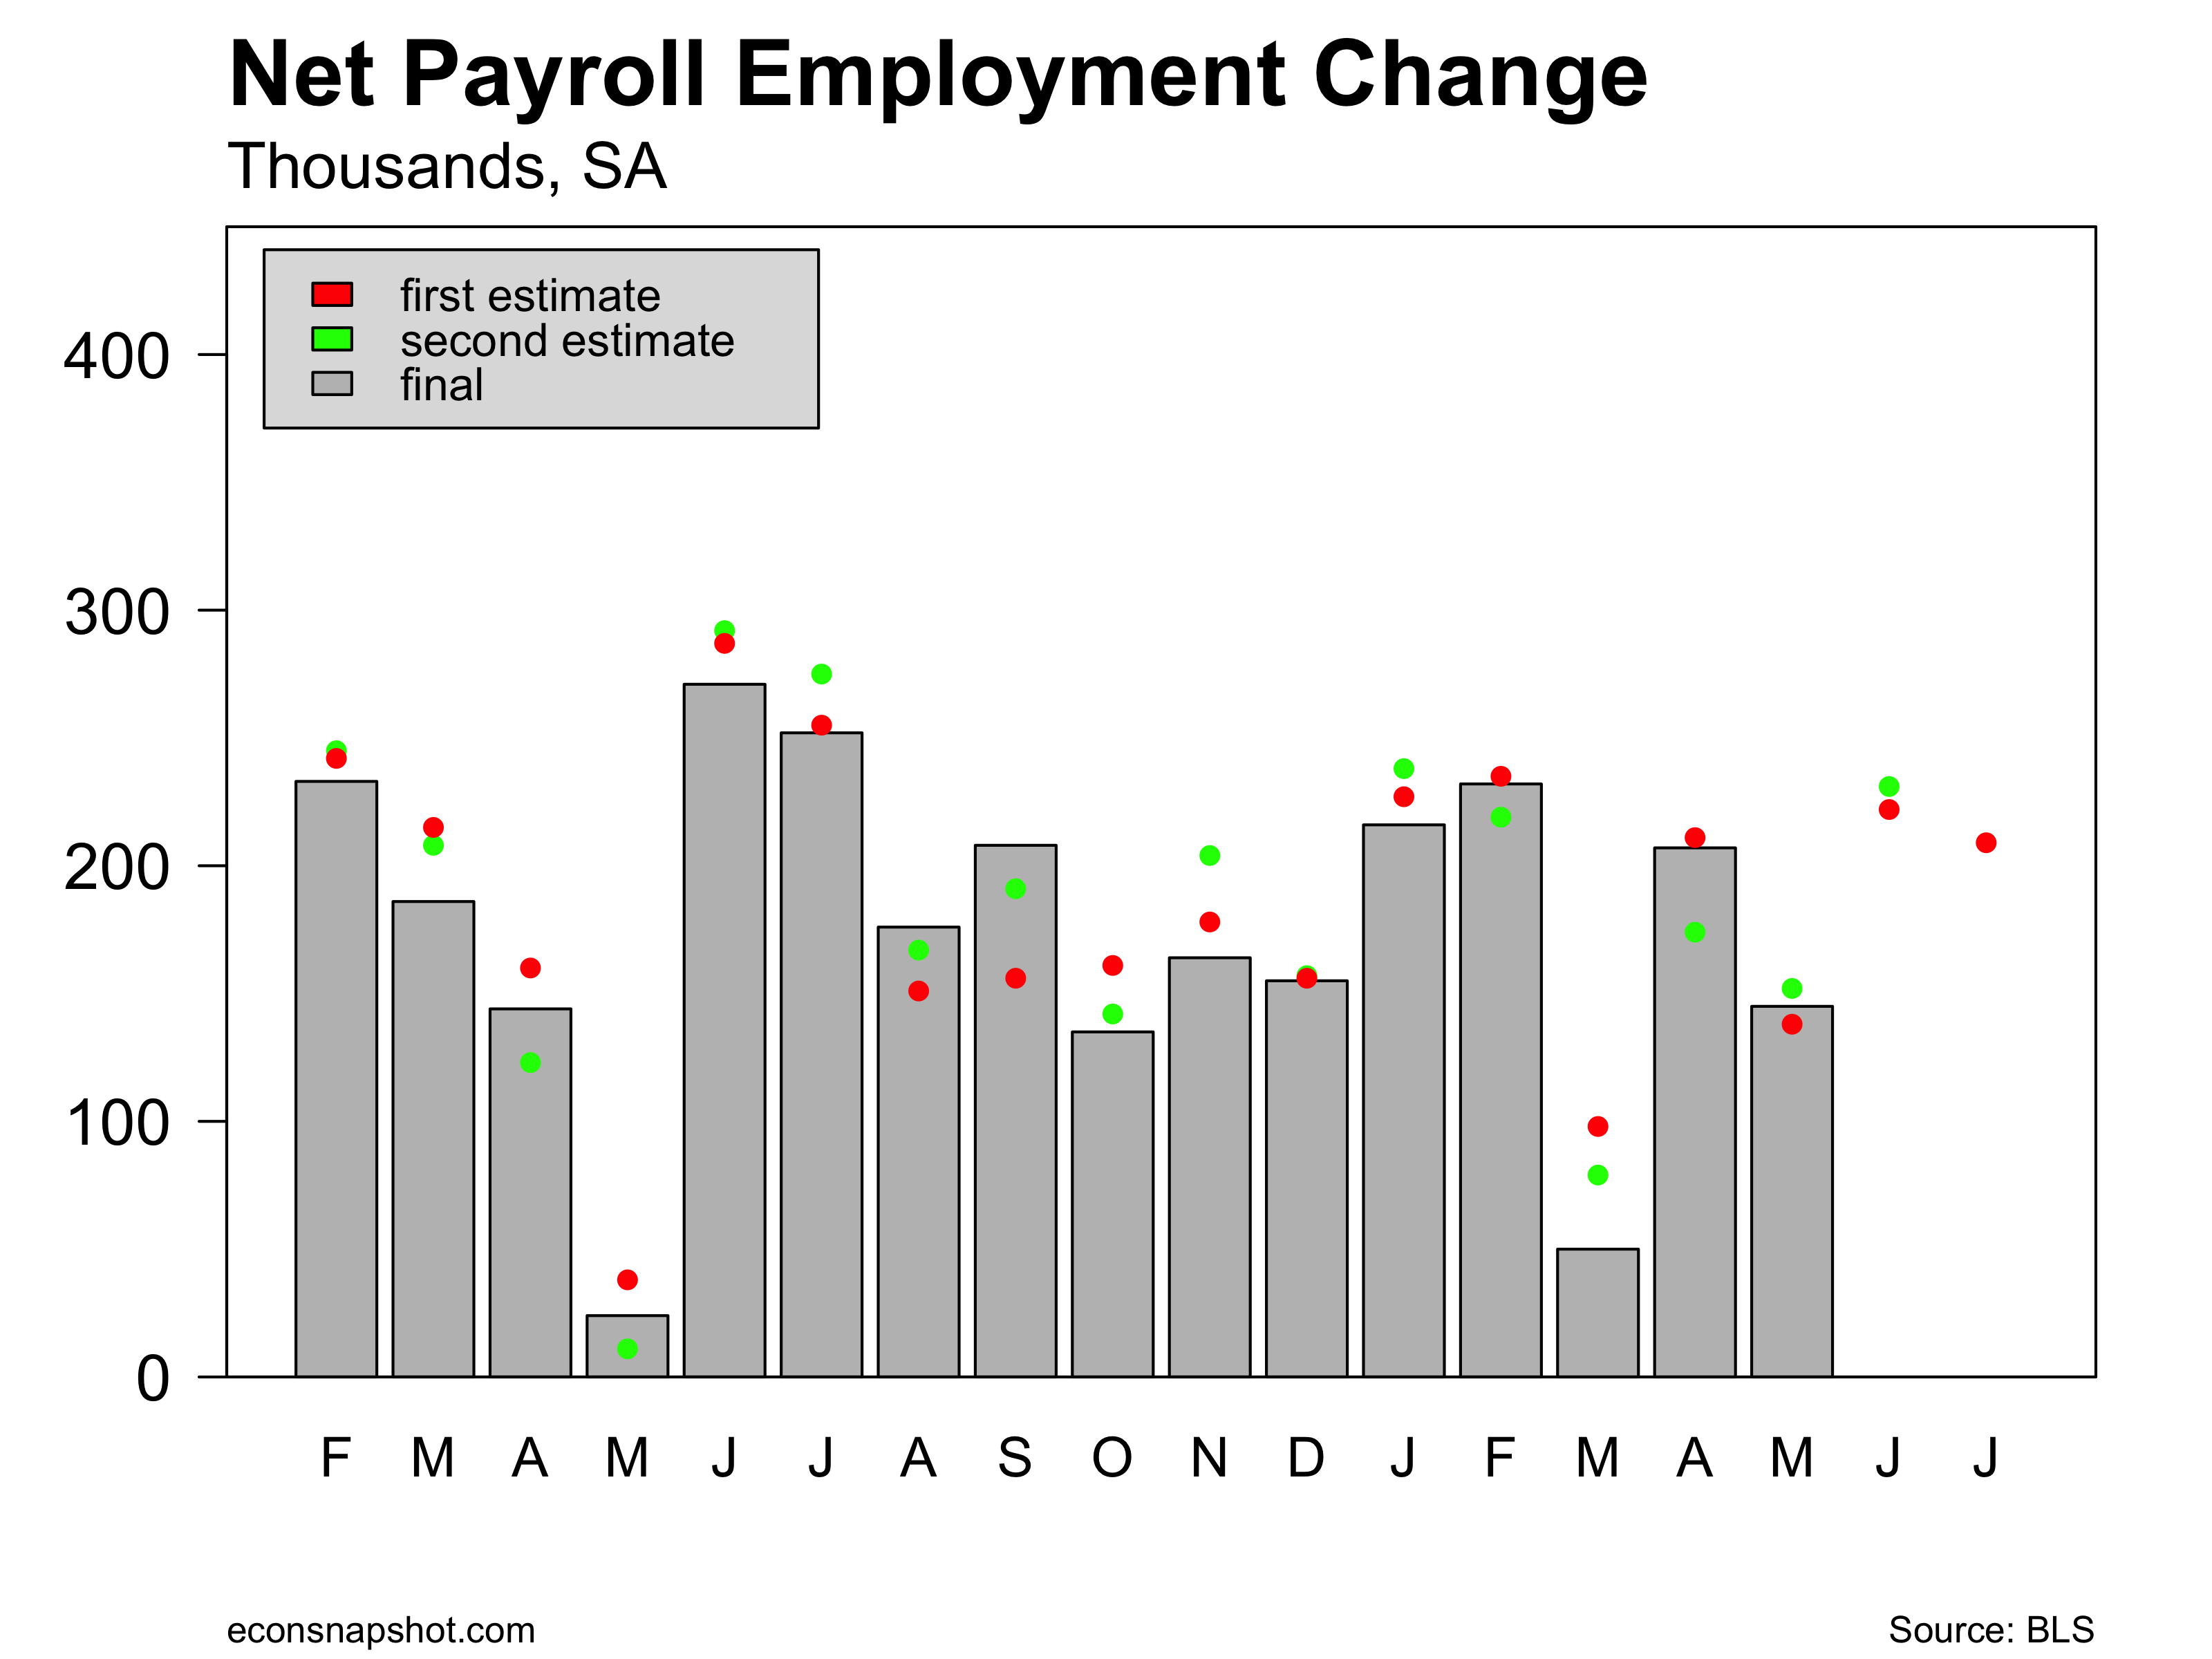
The BLS announced a 33,000 decline in in payroll employment. Employment in the food services and drinking places sector fell by 104,000. Several disruptions occurred during the past month, including hurricane Irma that occurred at the beginning of the BLS survey week. This is the first decline in employment since September, 2010 as the economy was recovering from the Great Recession. The drop in employment in food services and drinking places was the largest since the series started. This decline was largely responsible for the overall decline in payroll employment. 

empchgm-2017-10-06

food-drink-2017-10-06

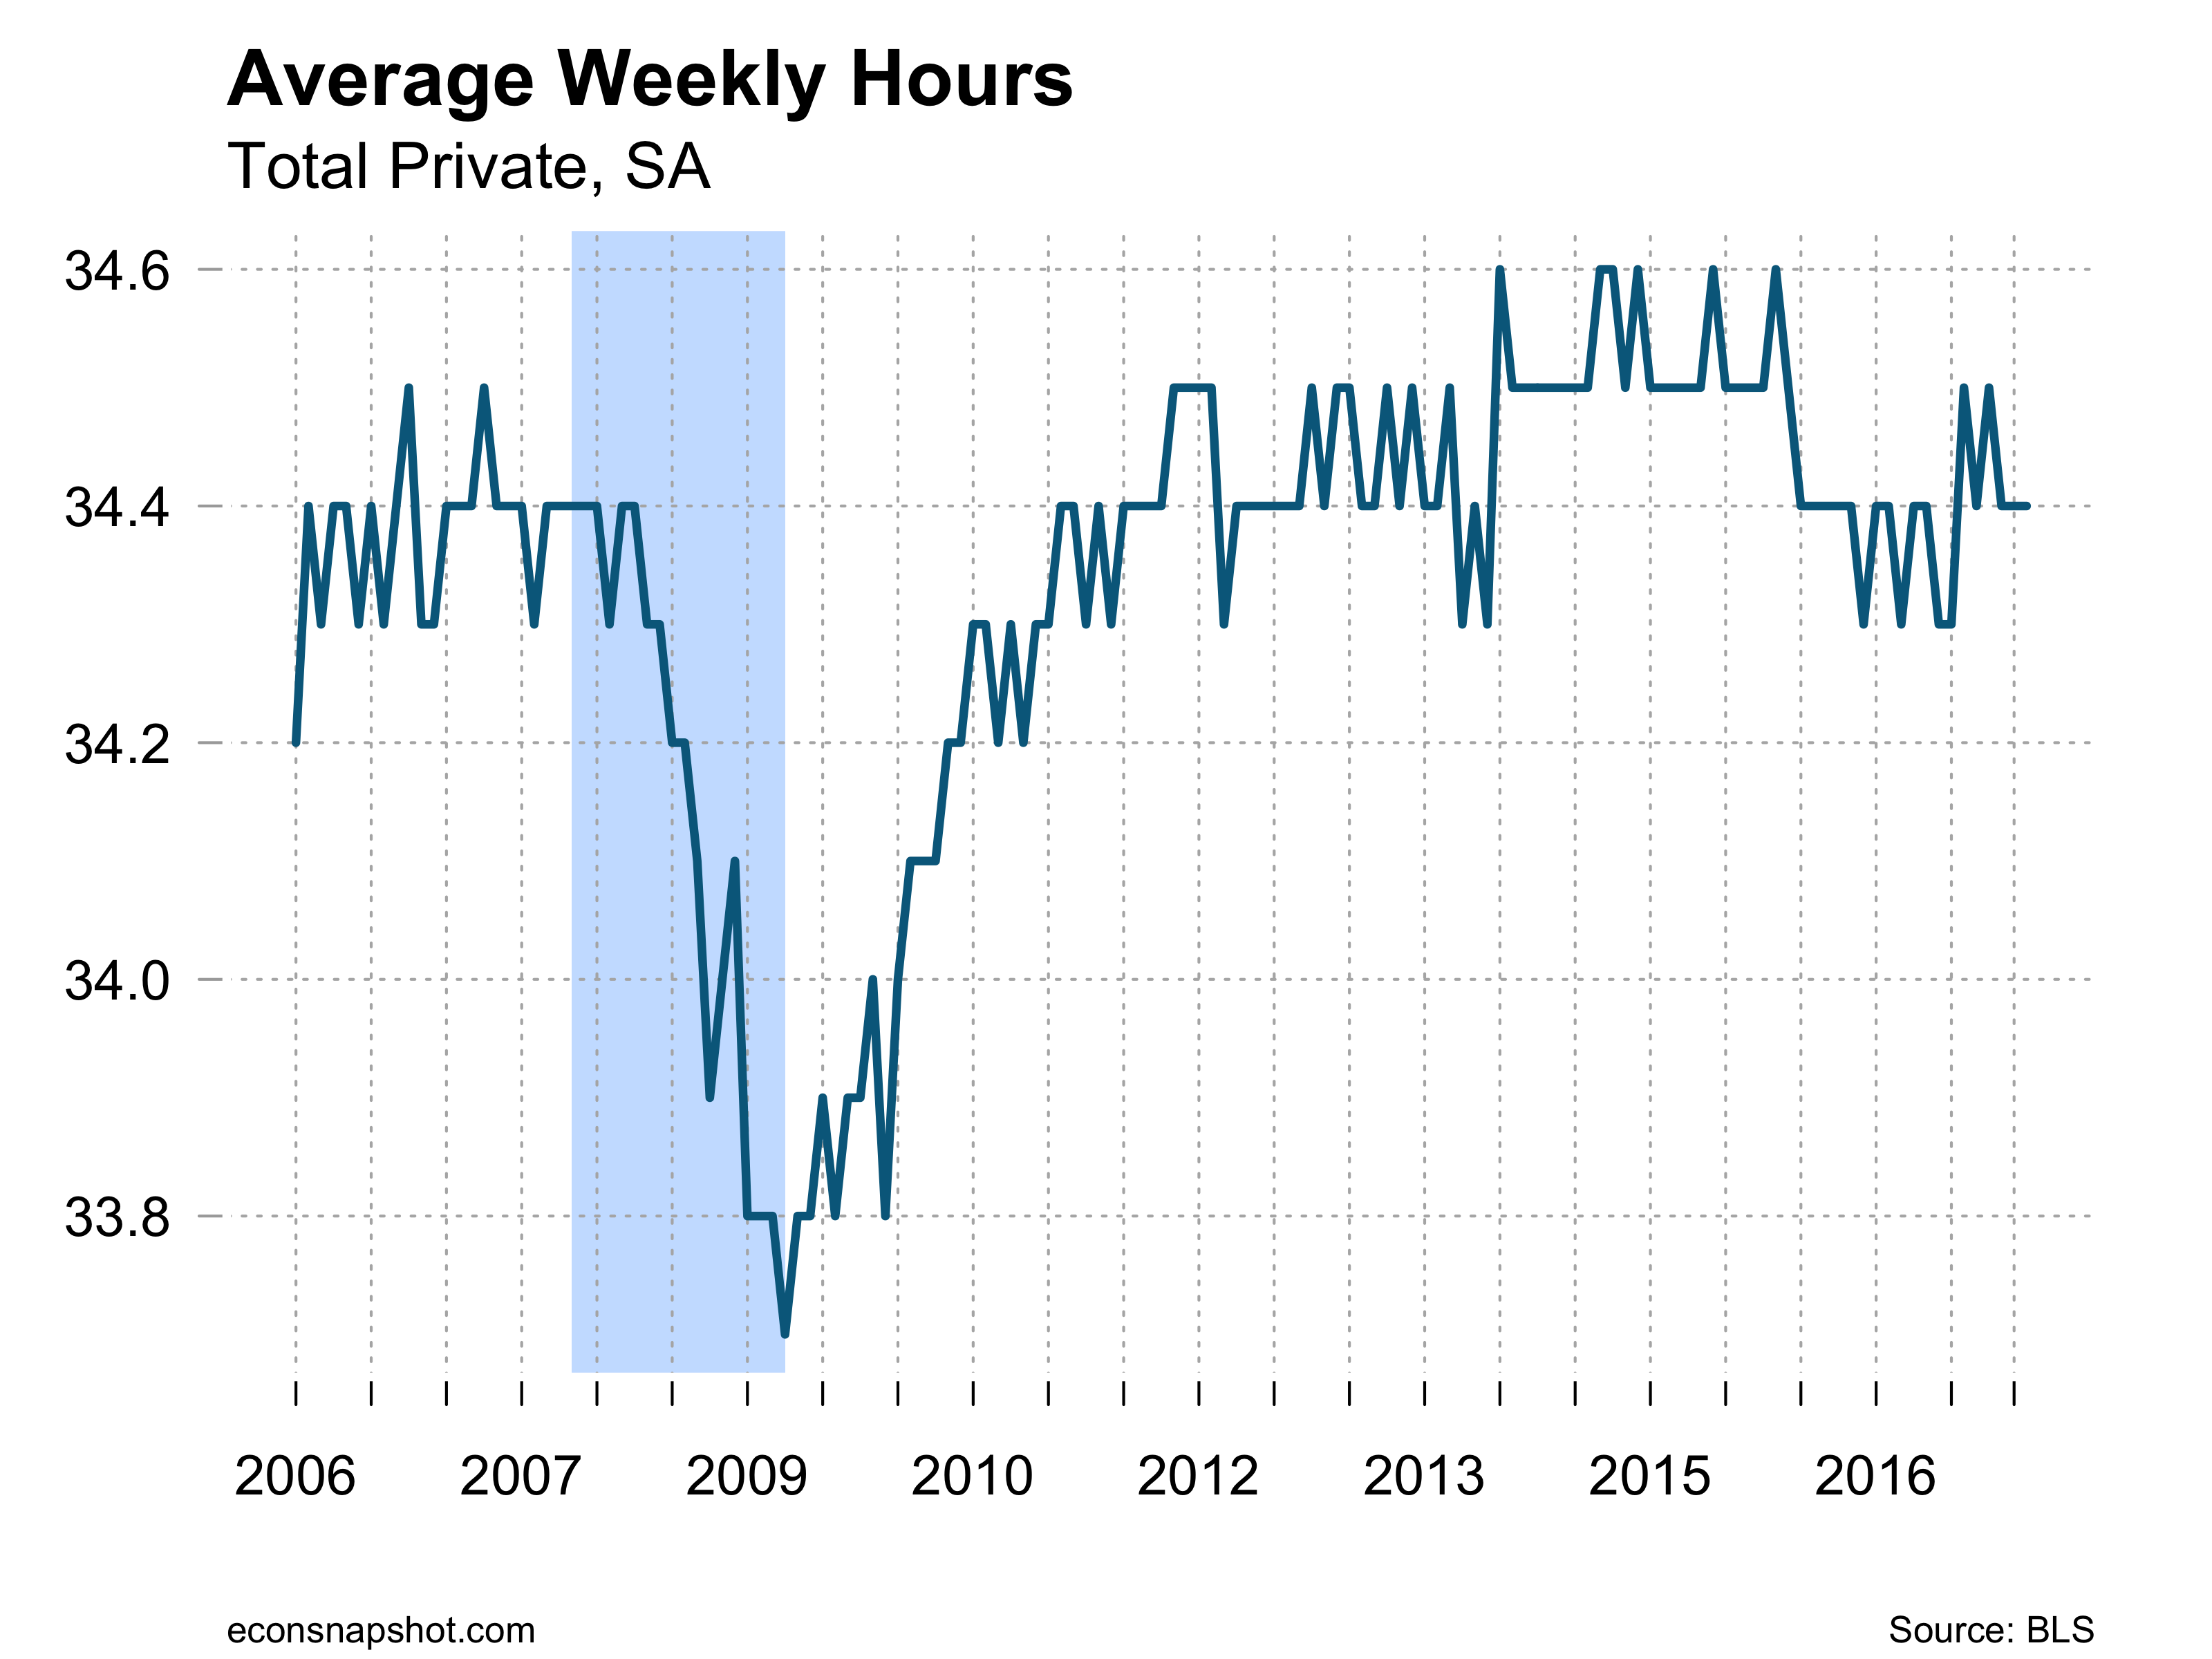
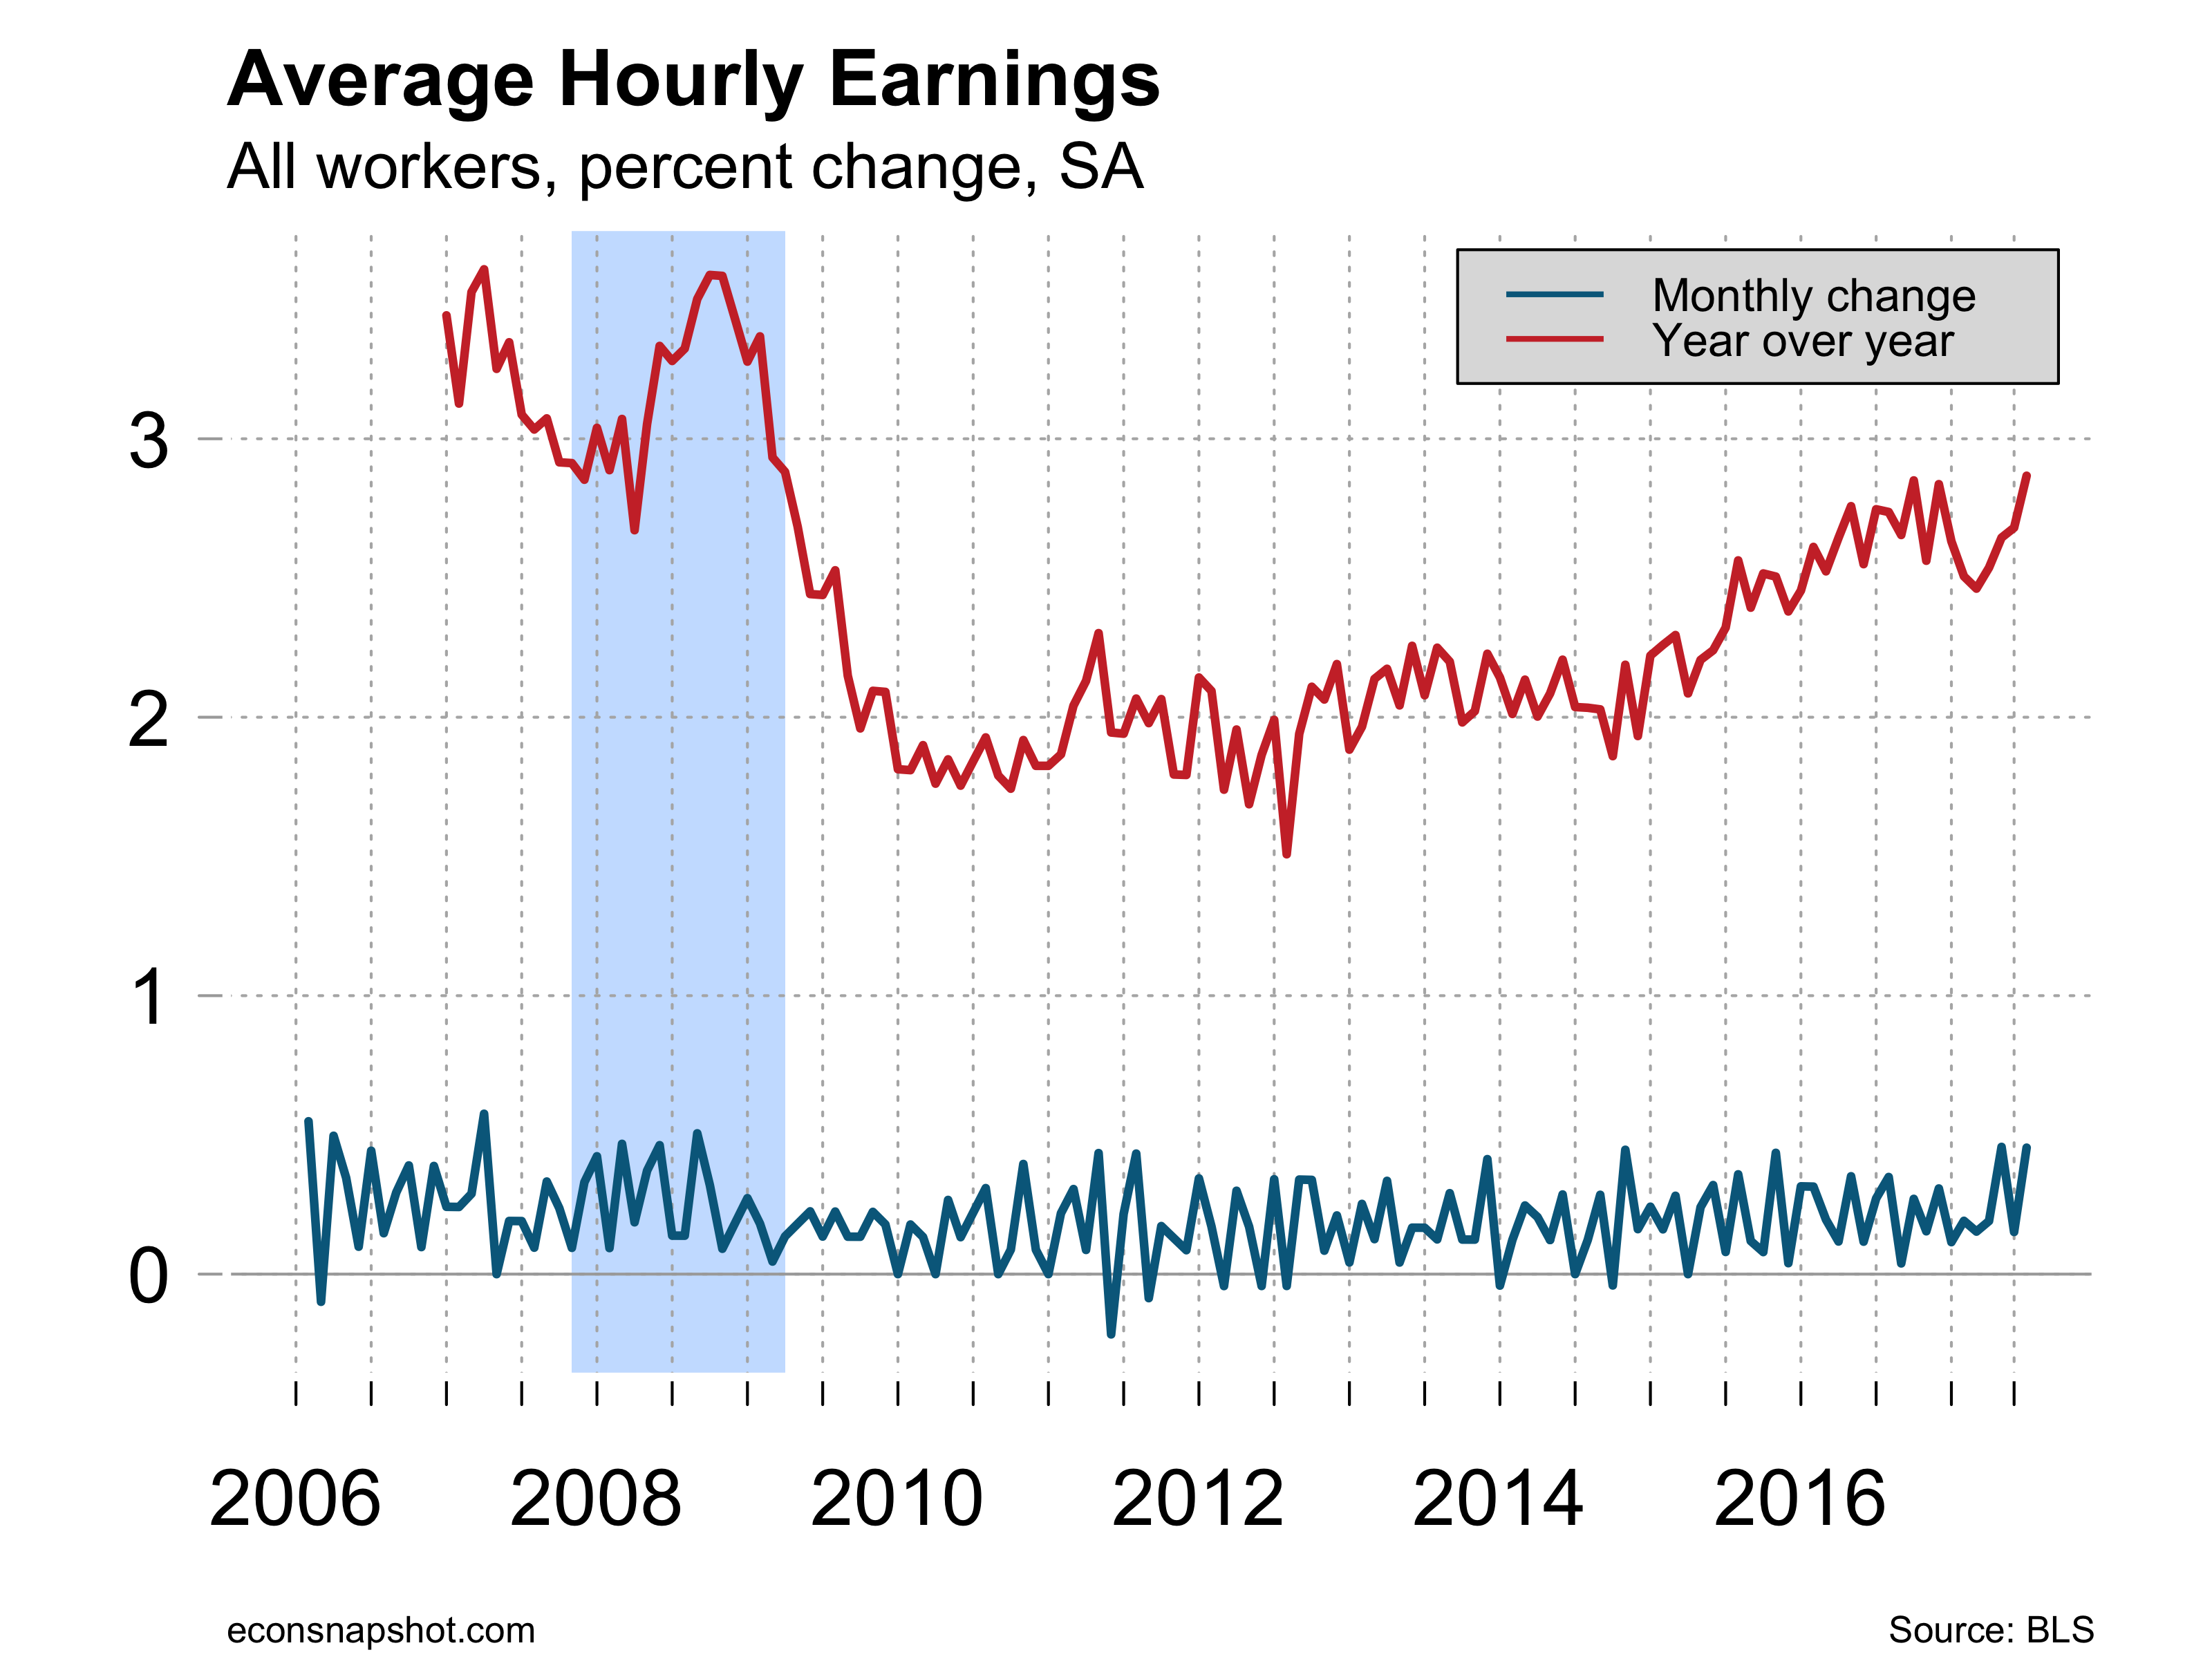
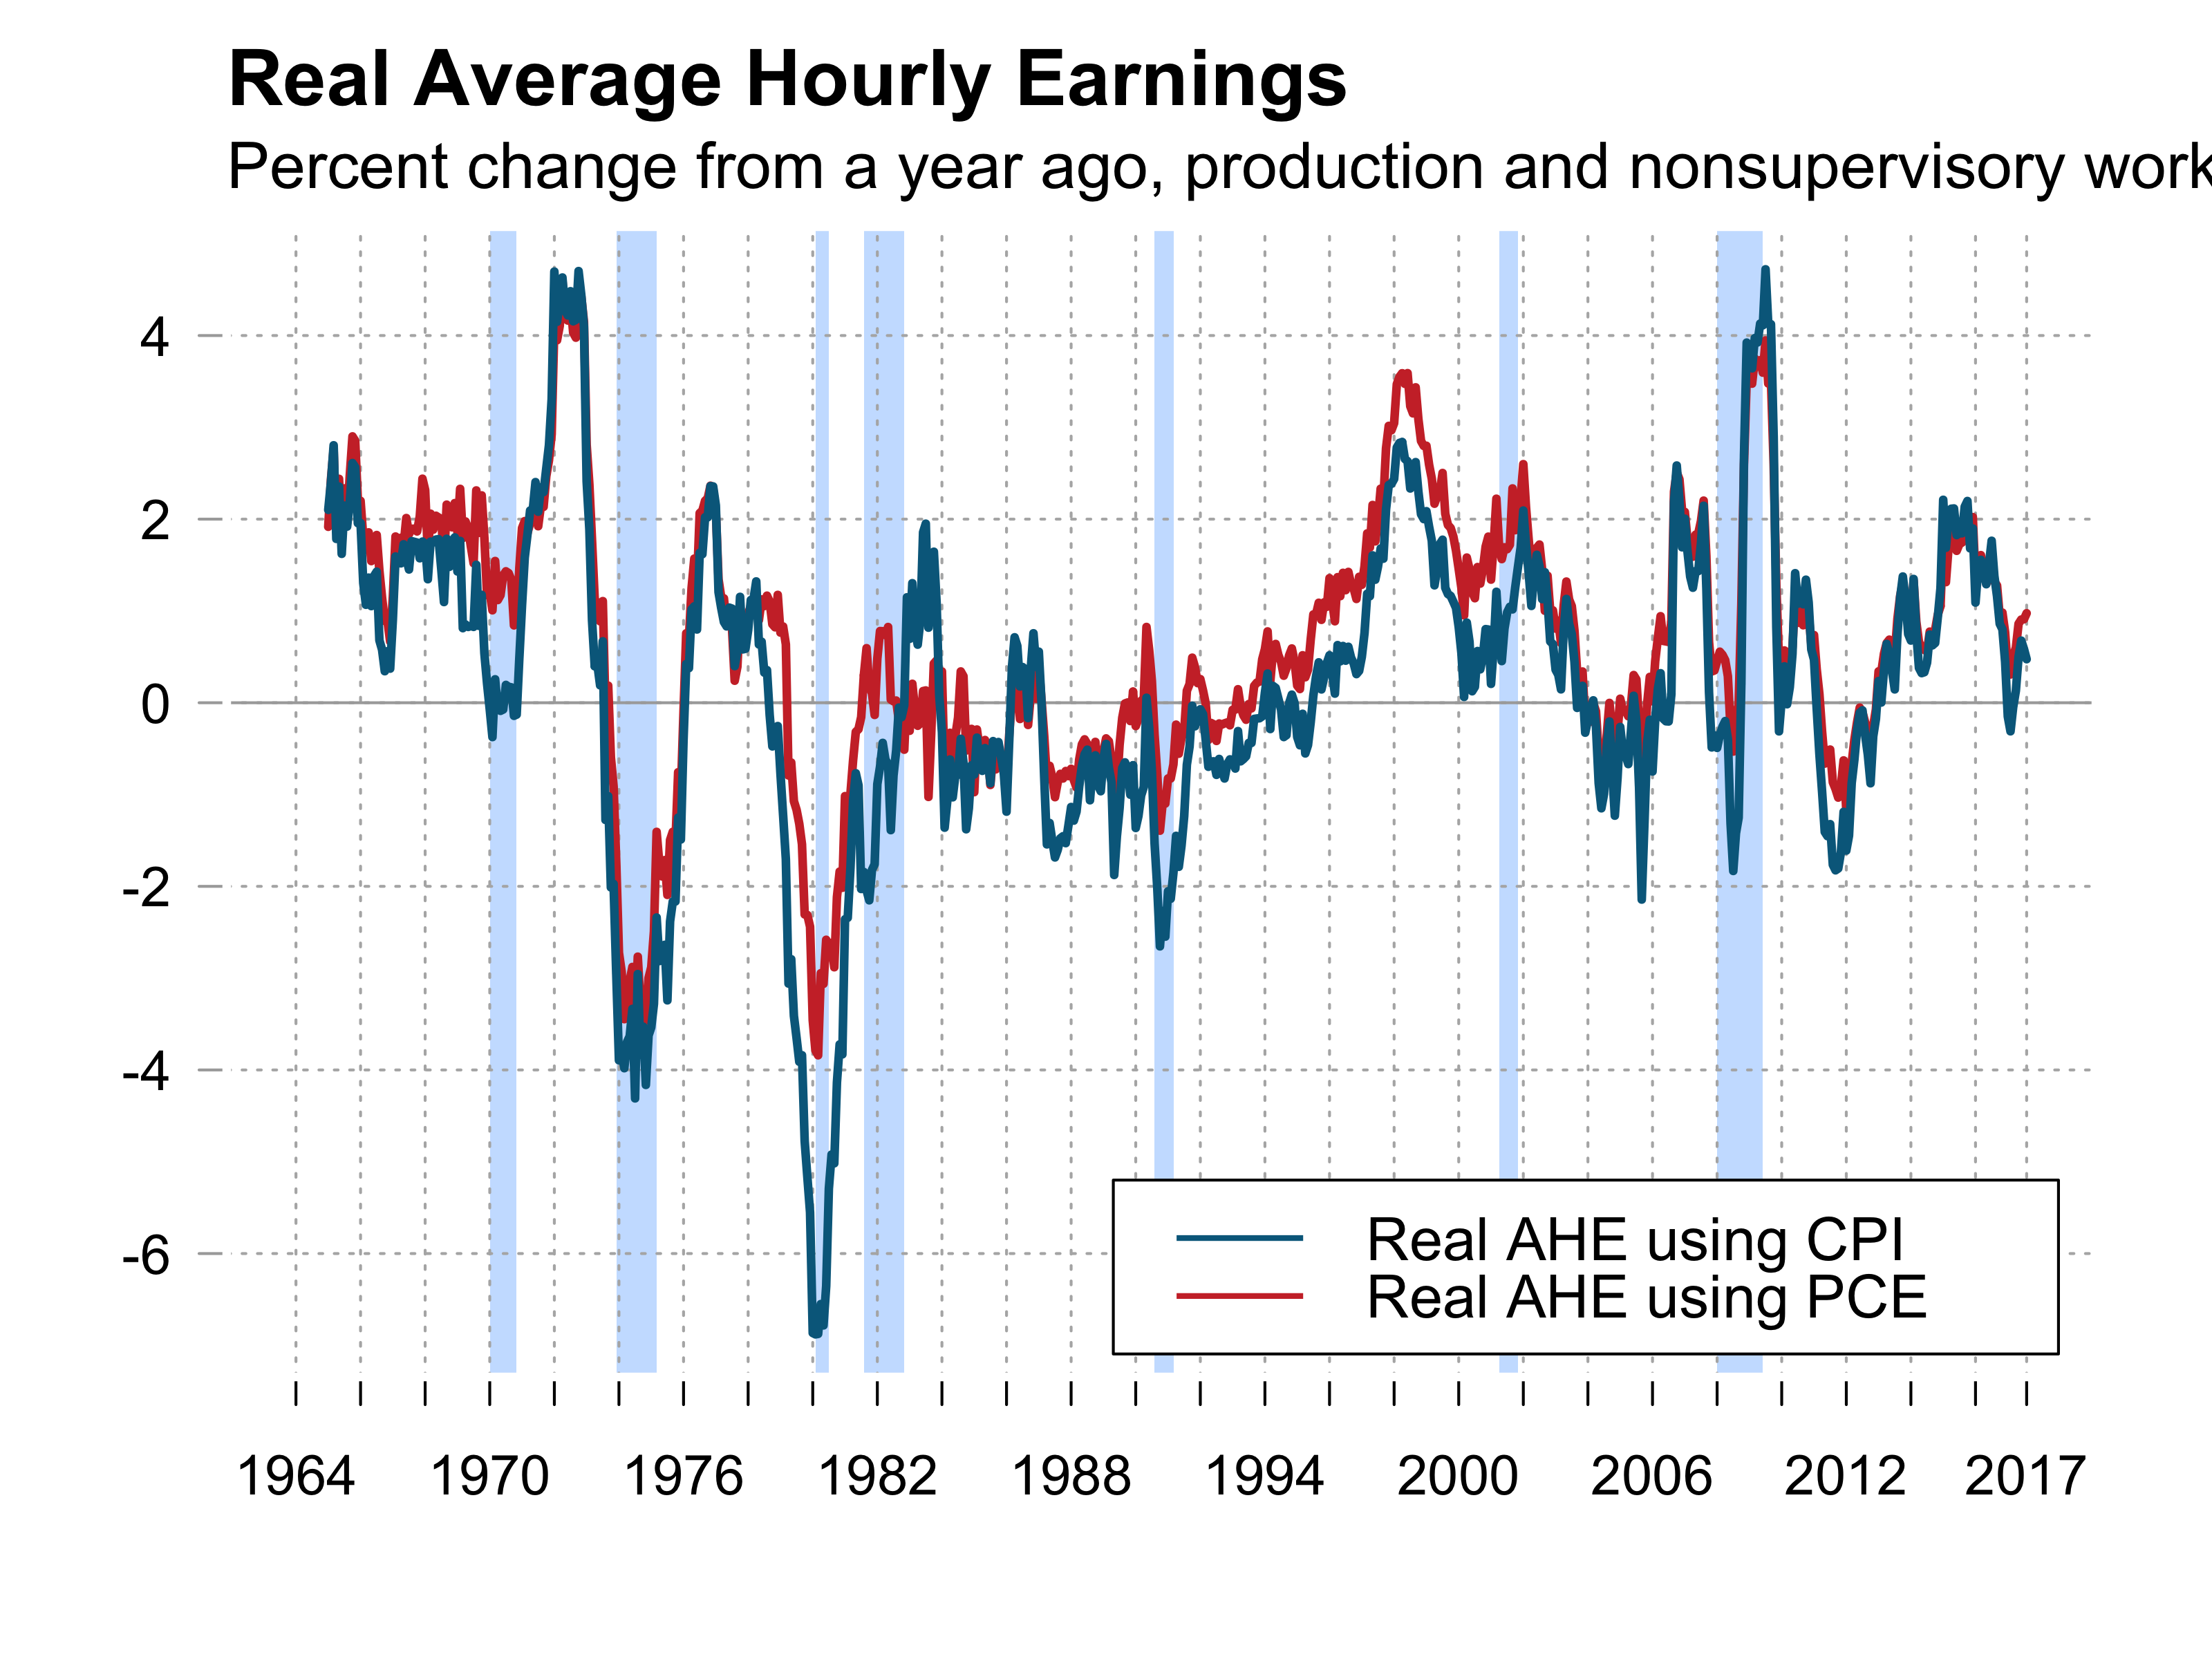
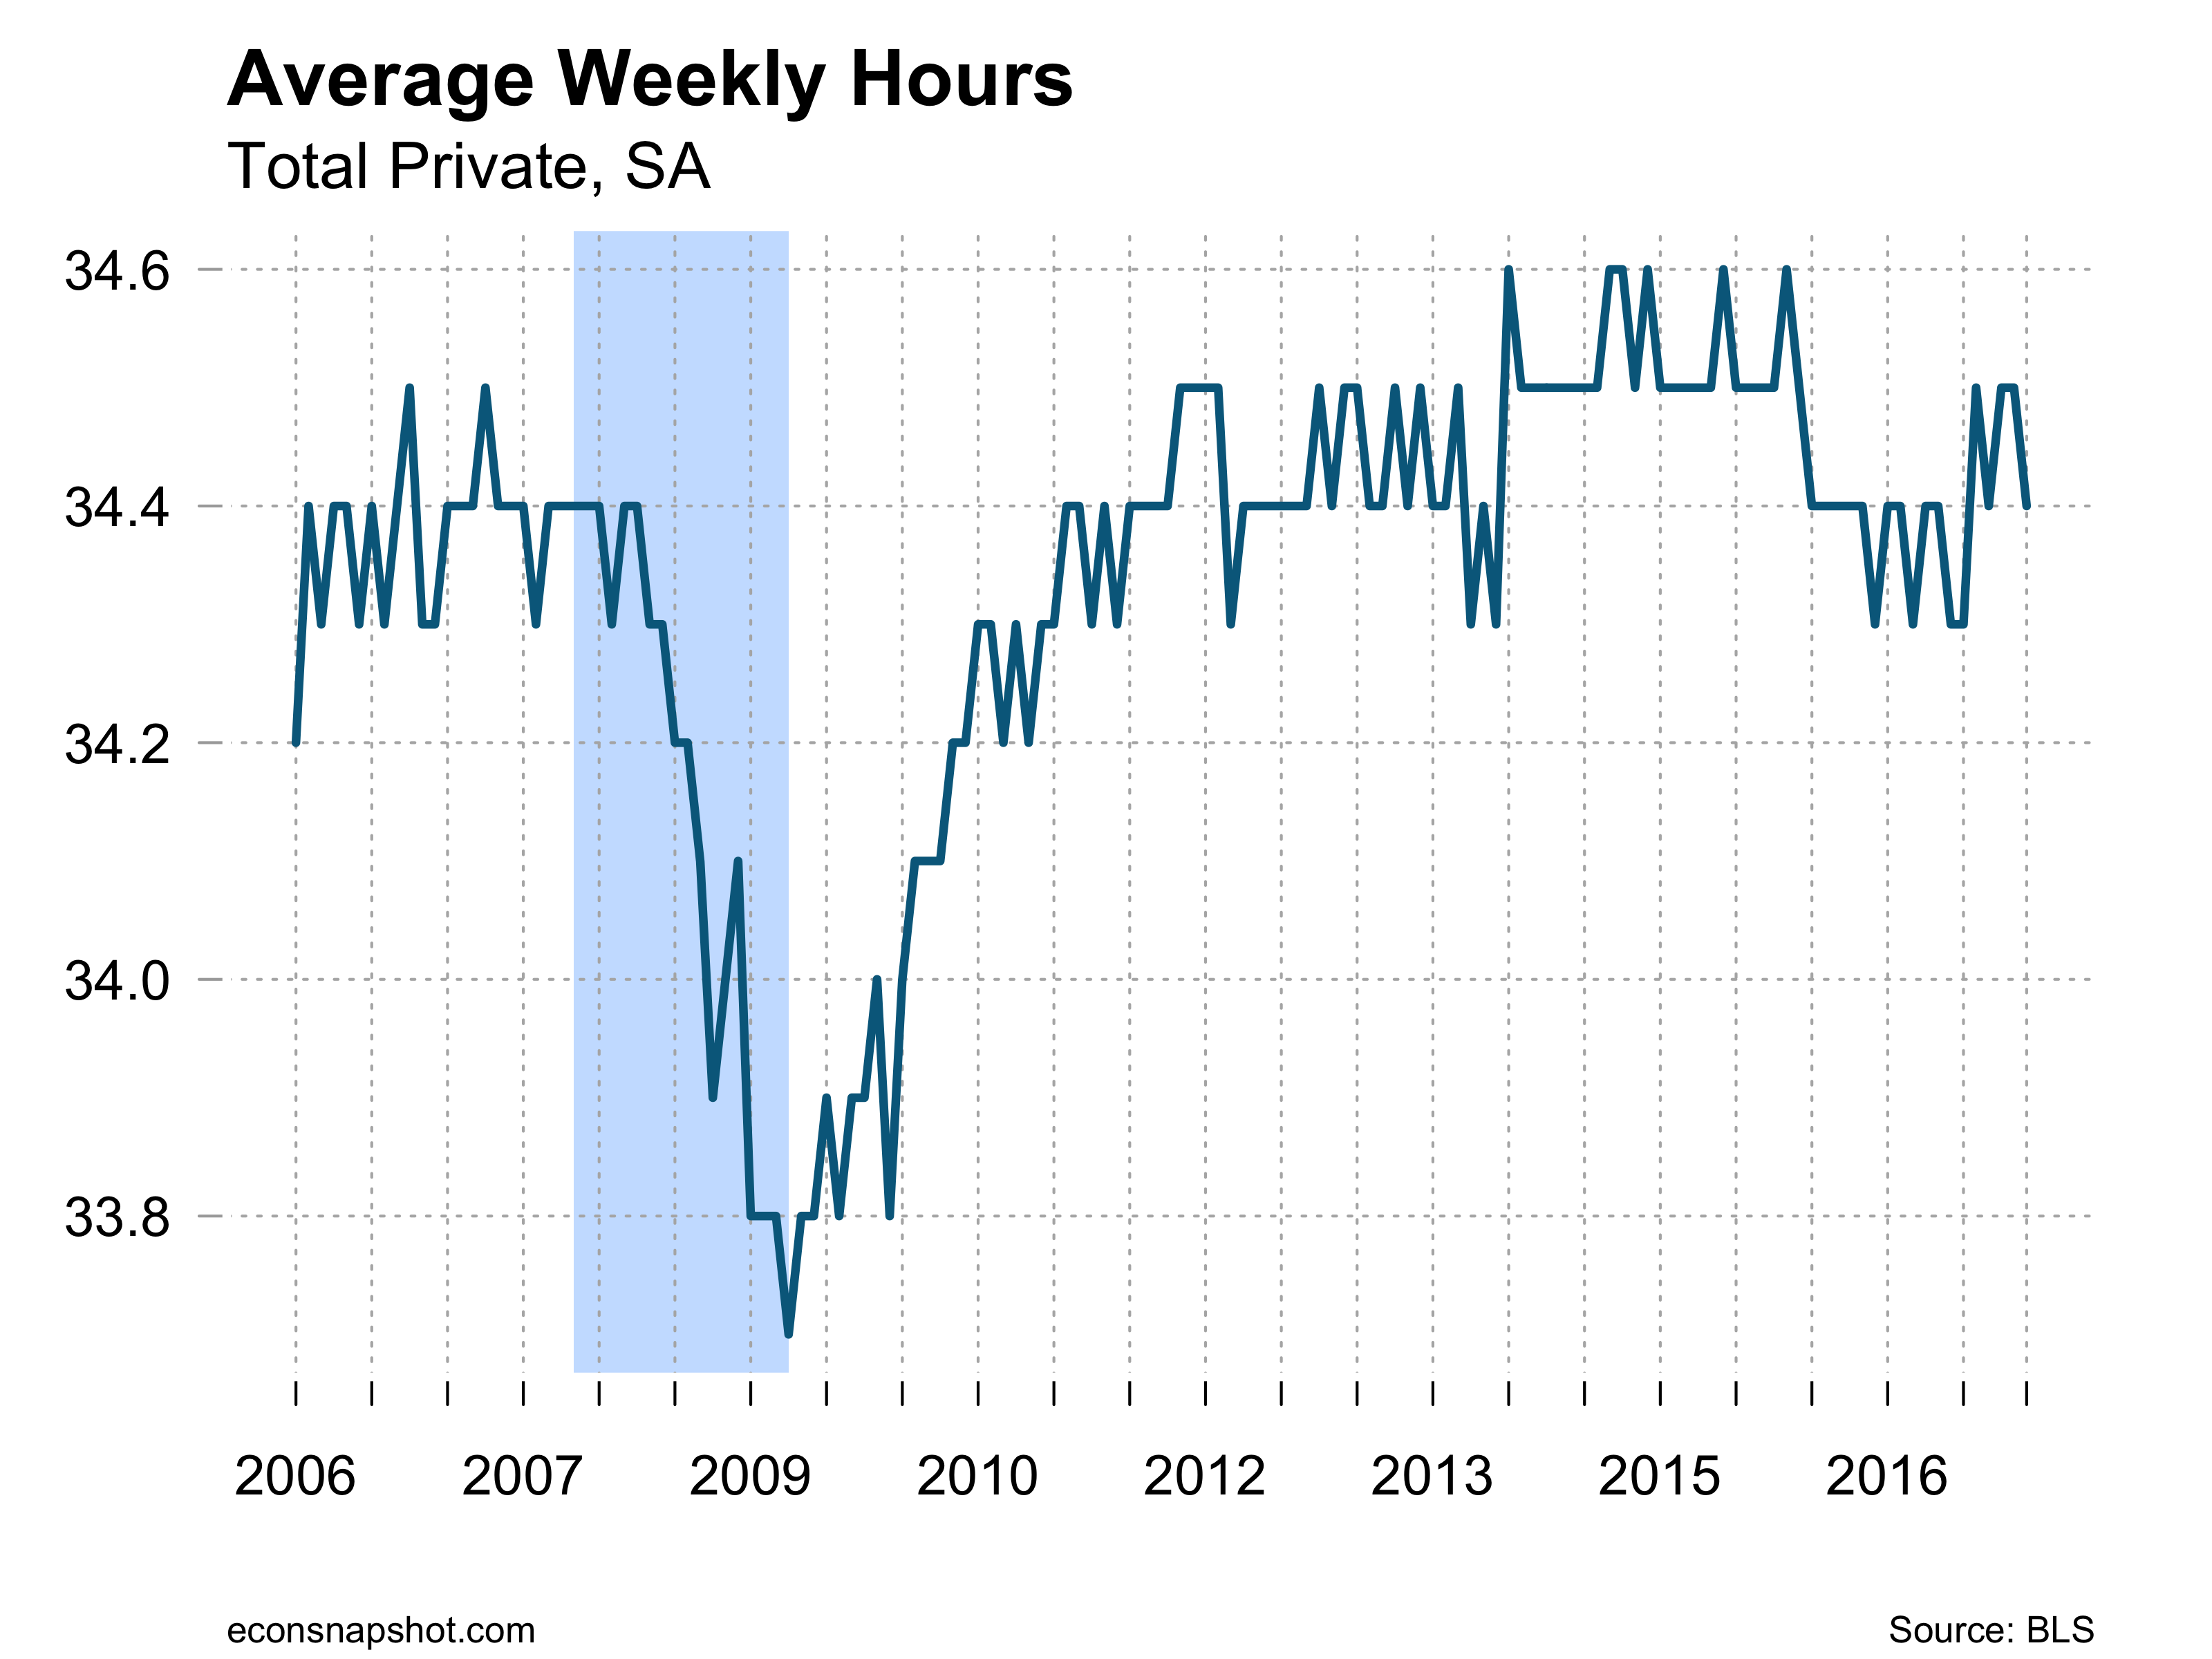
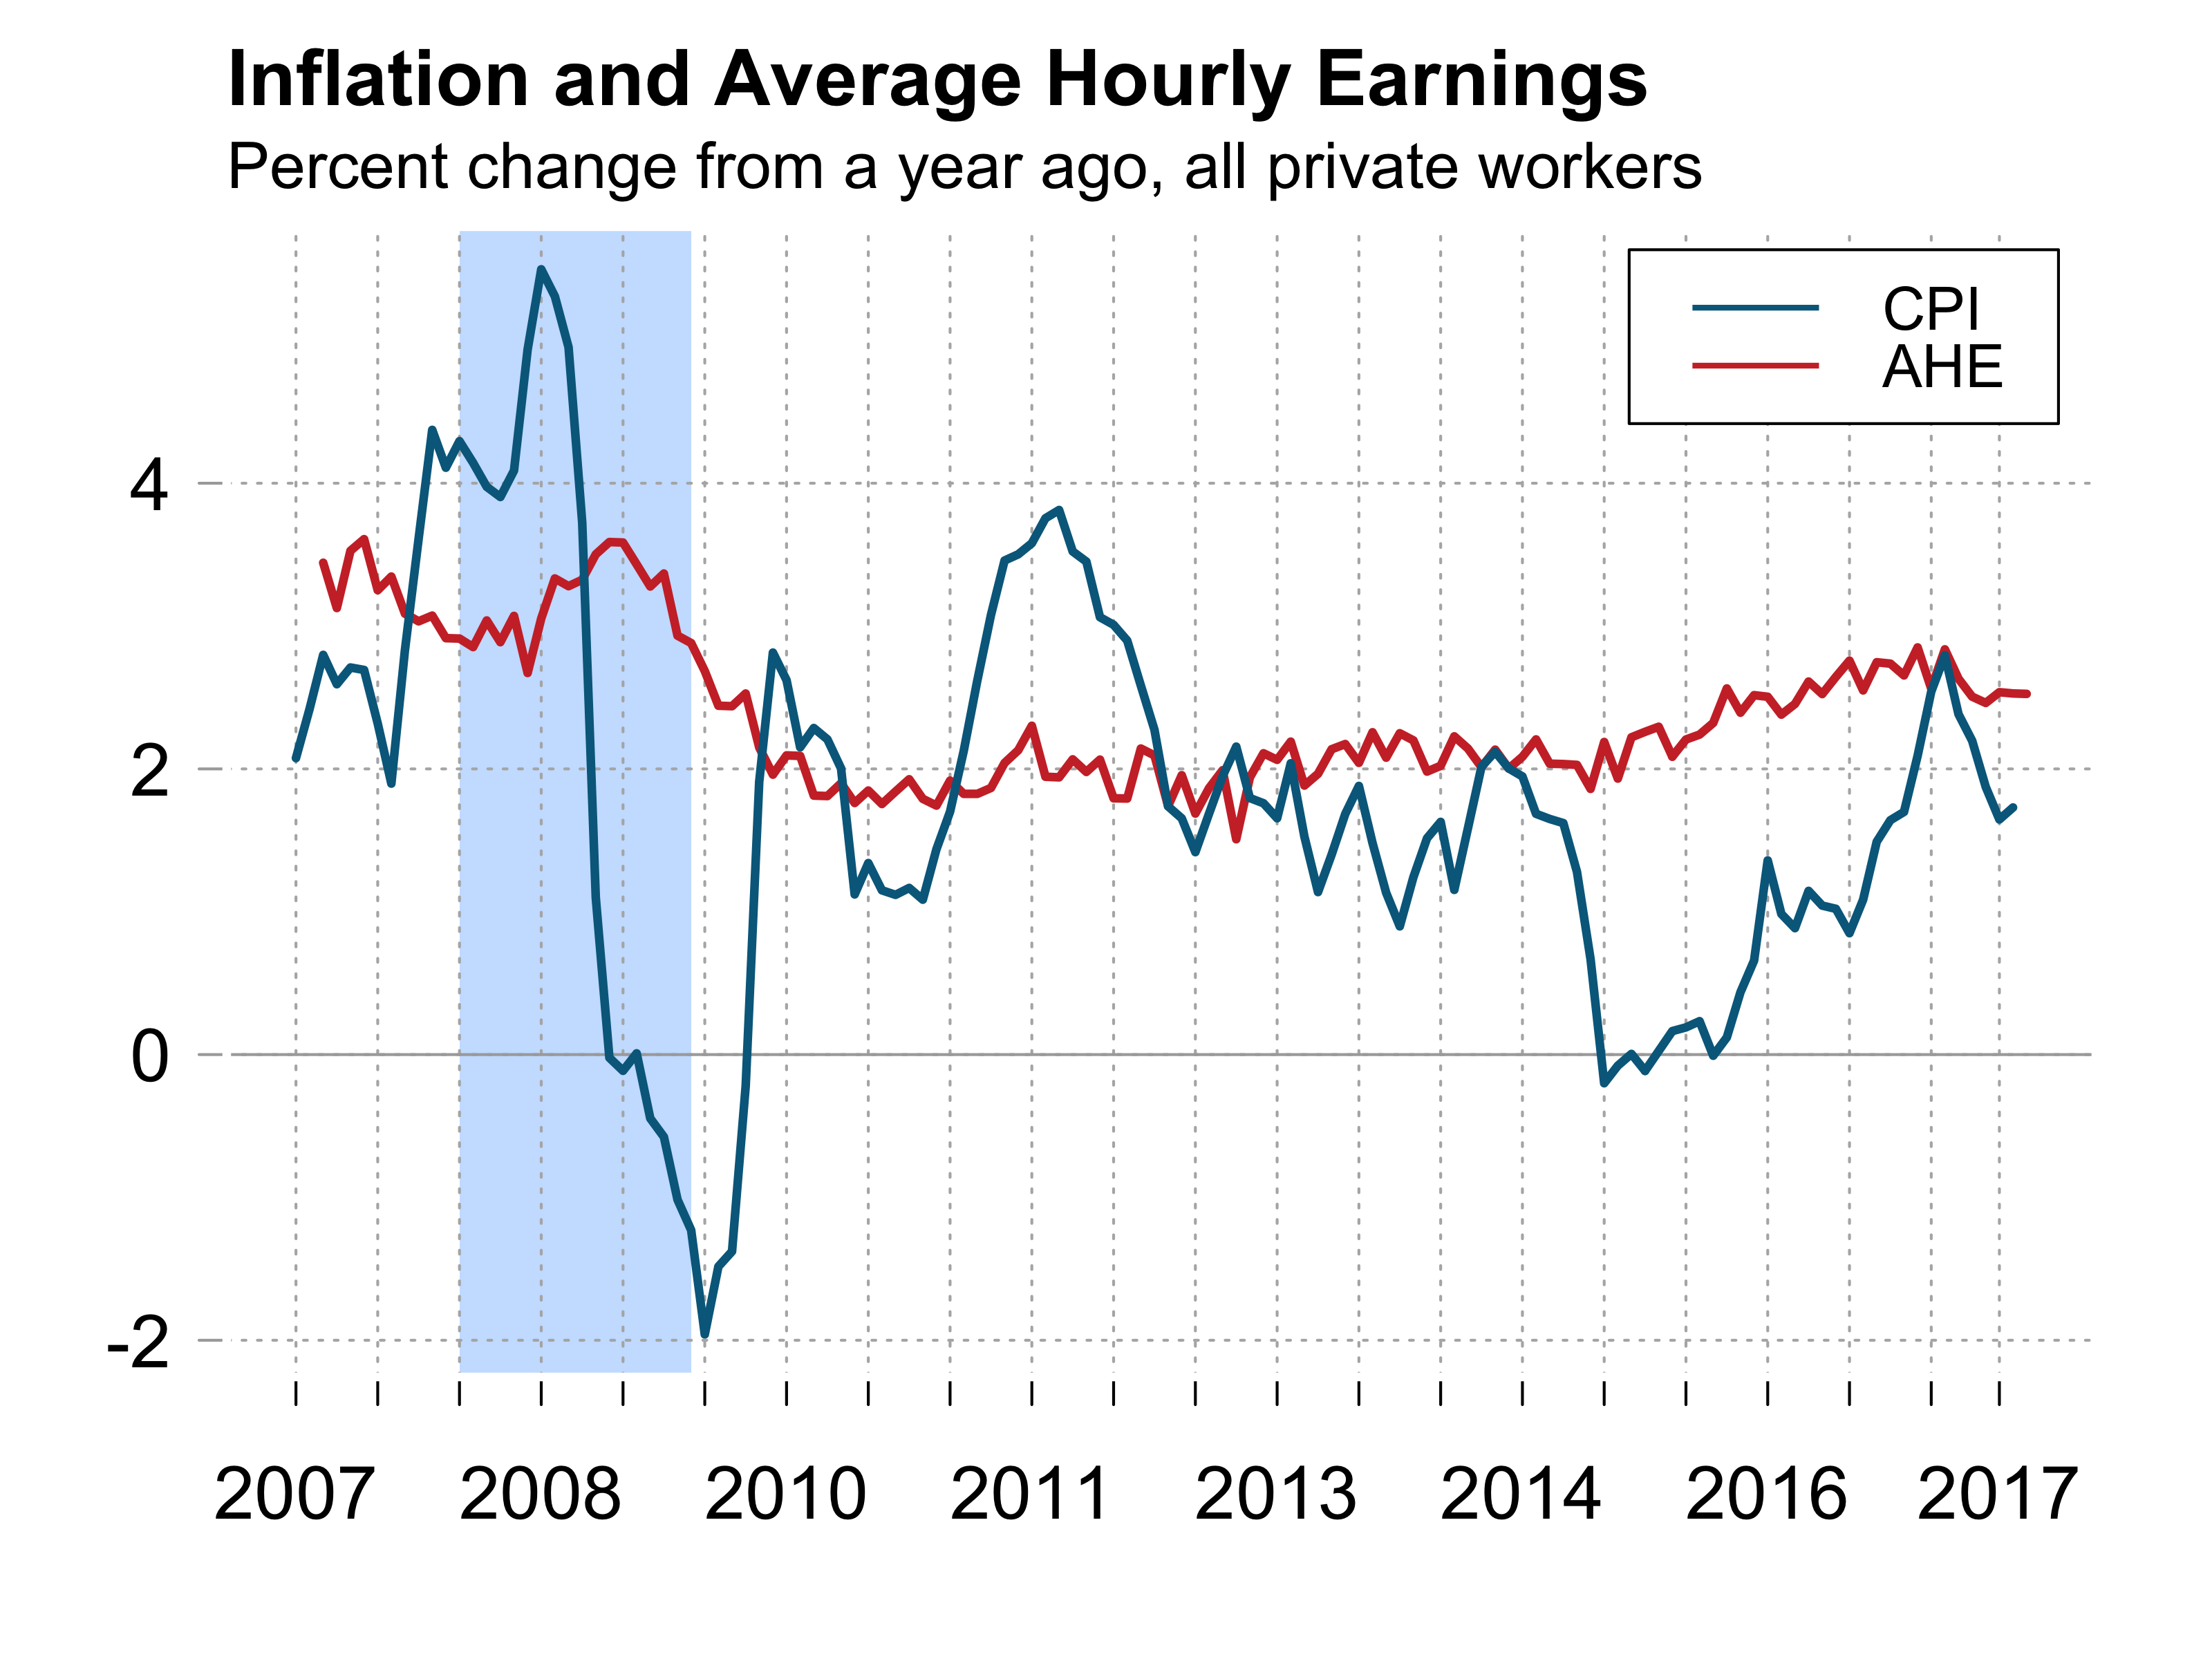
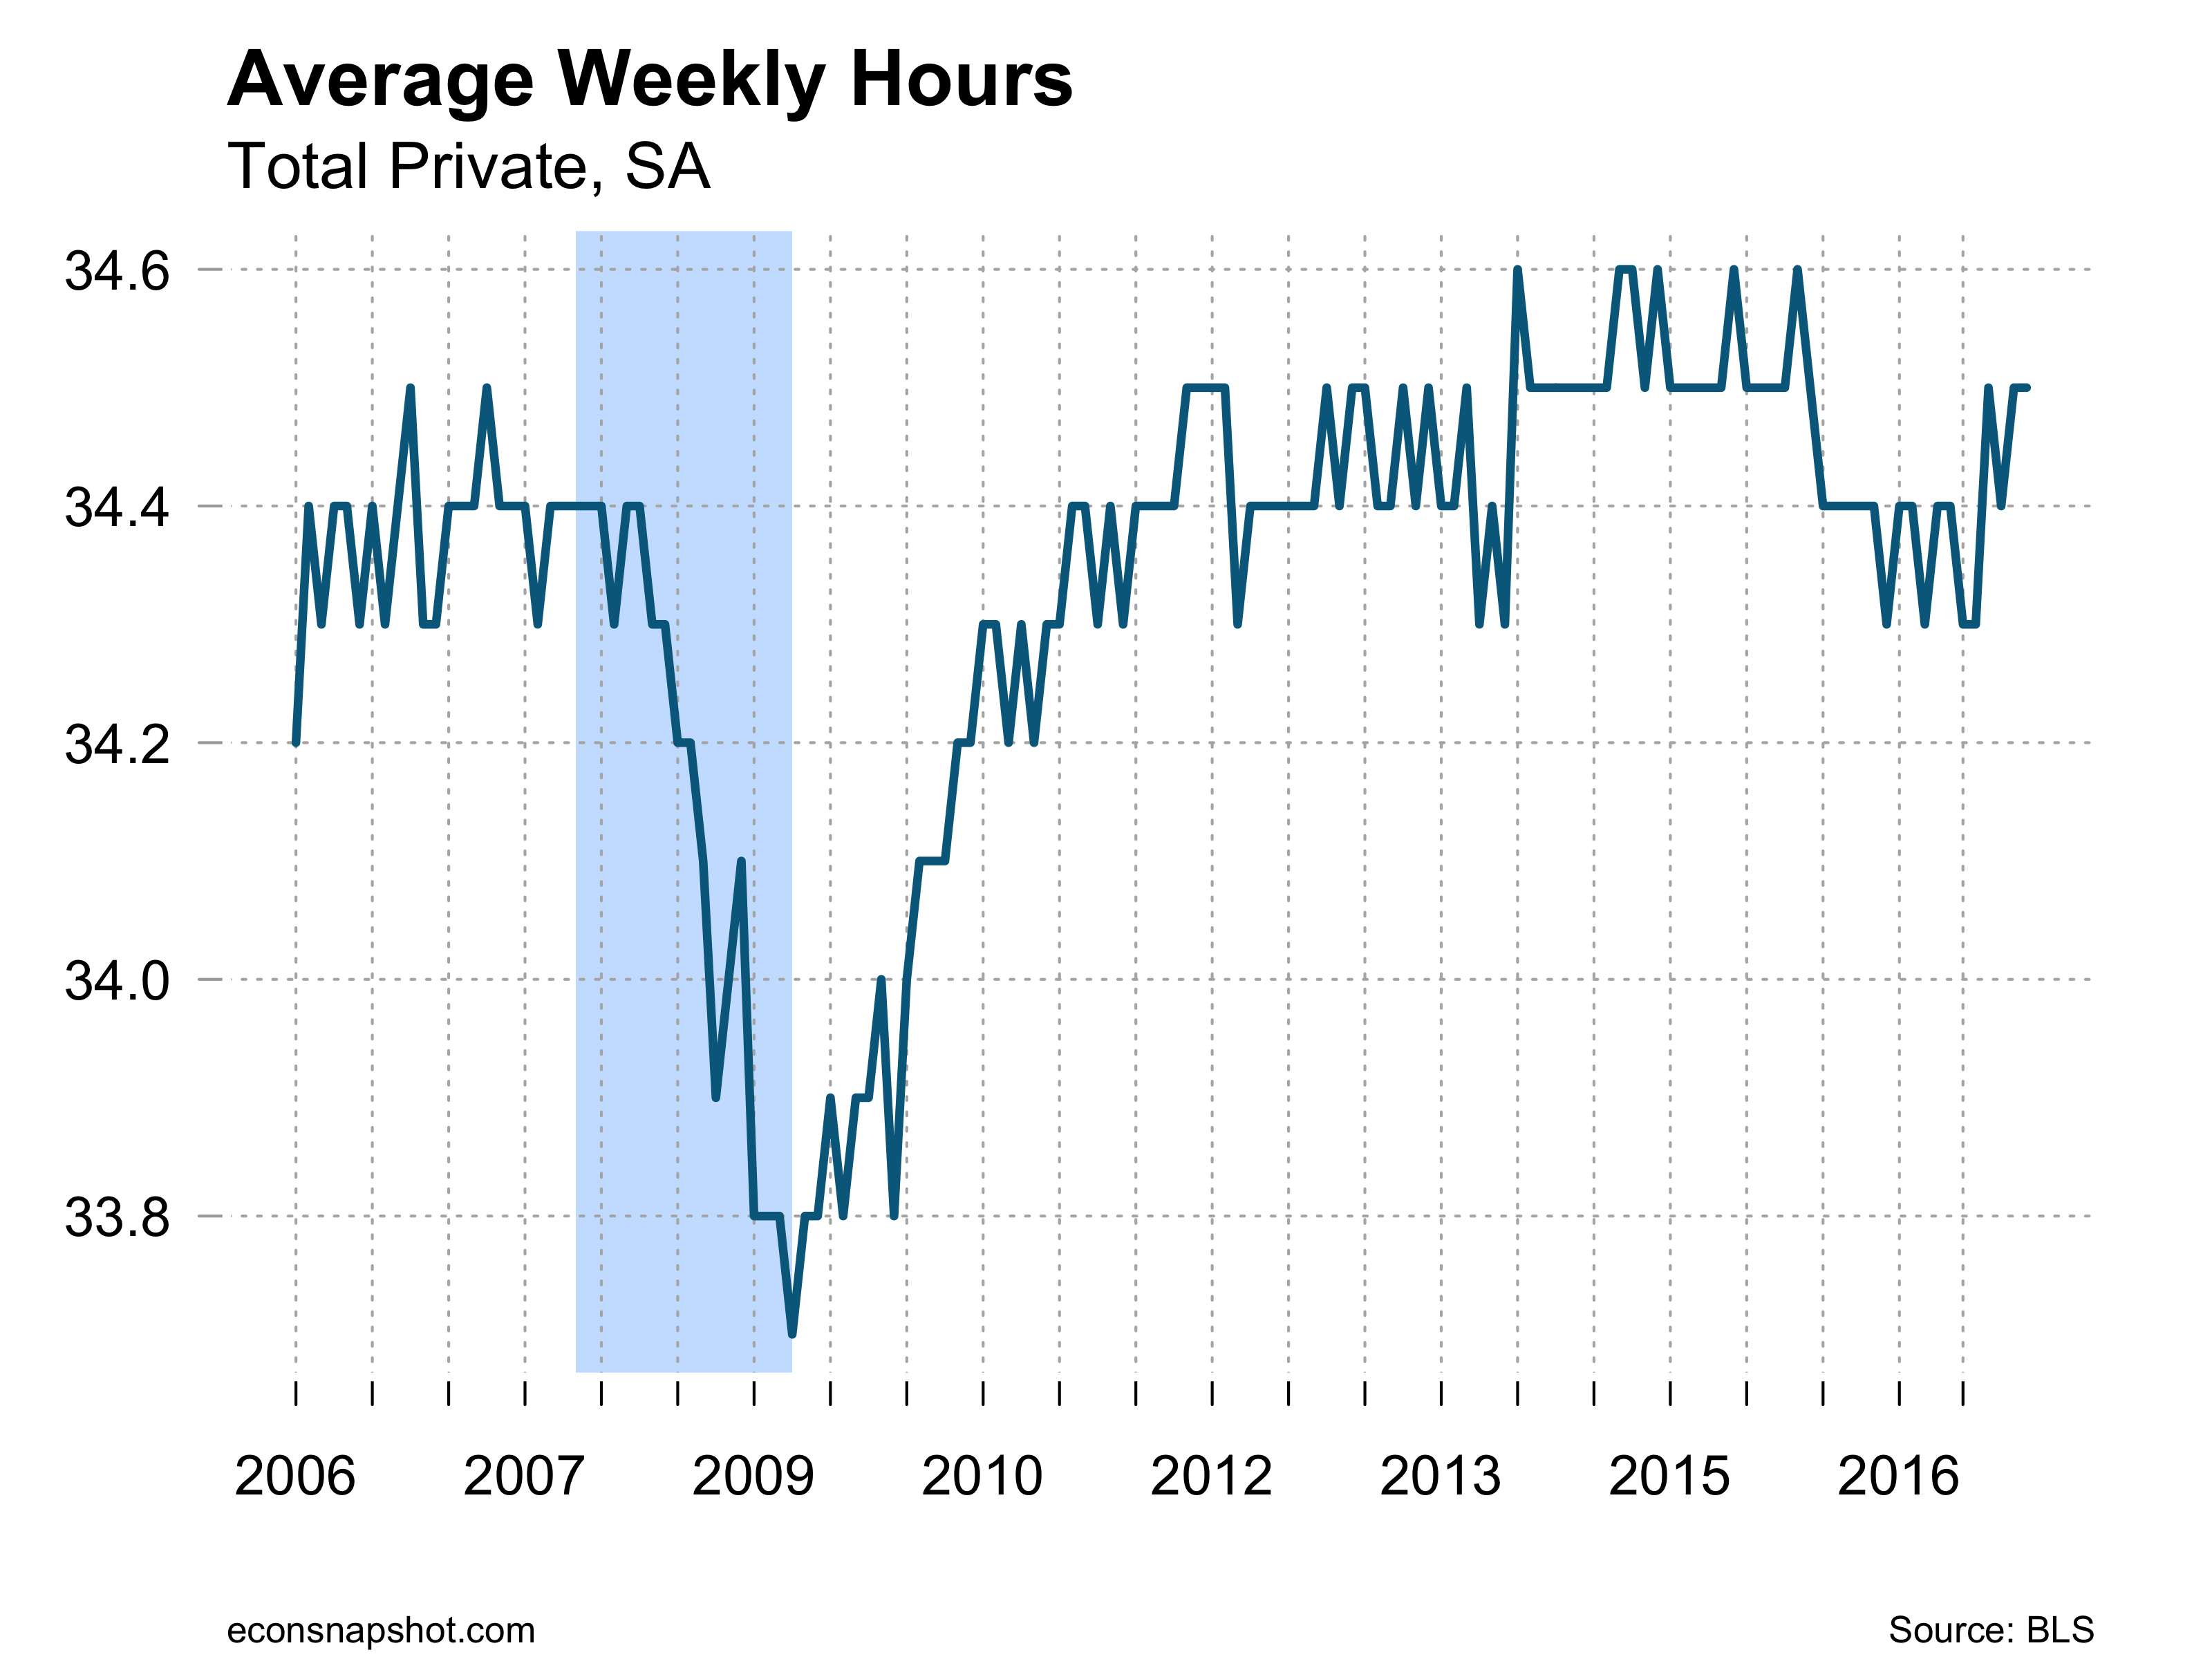
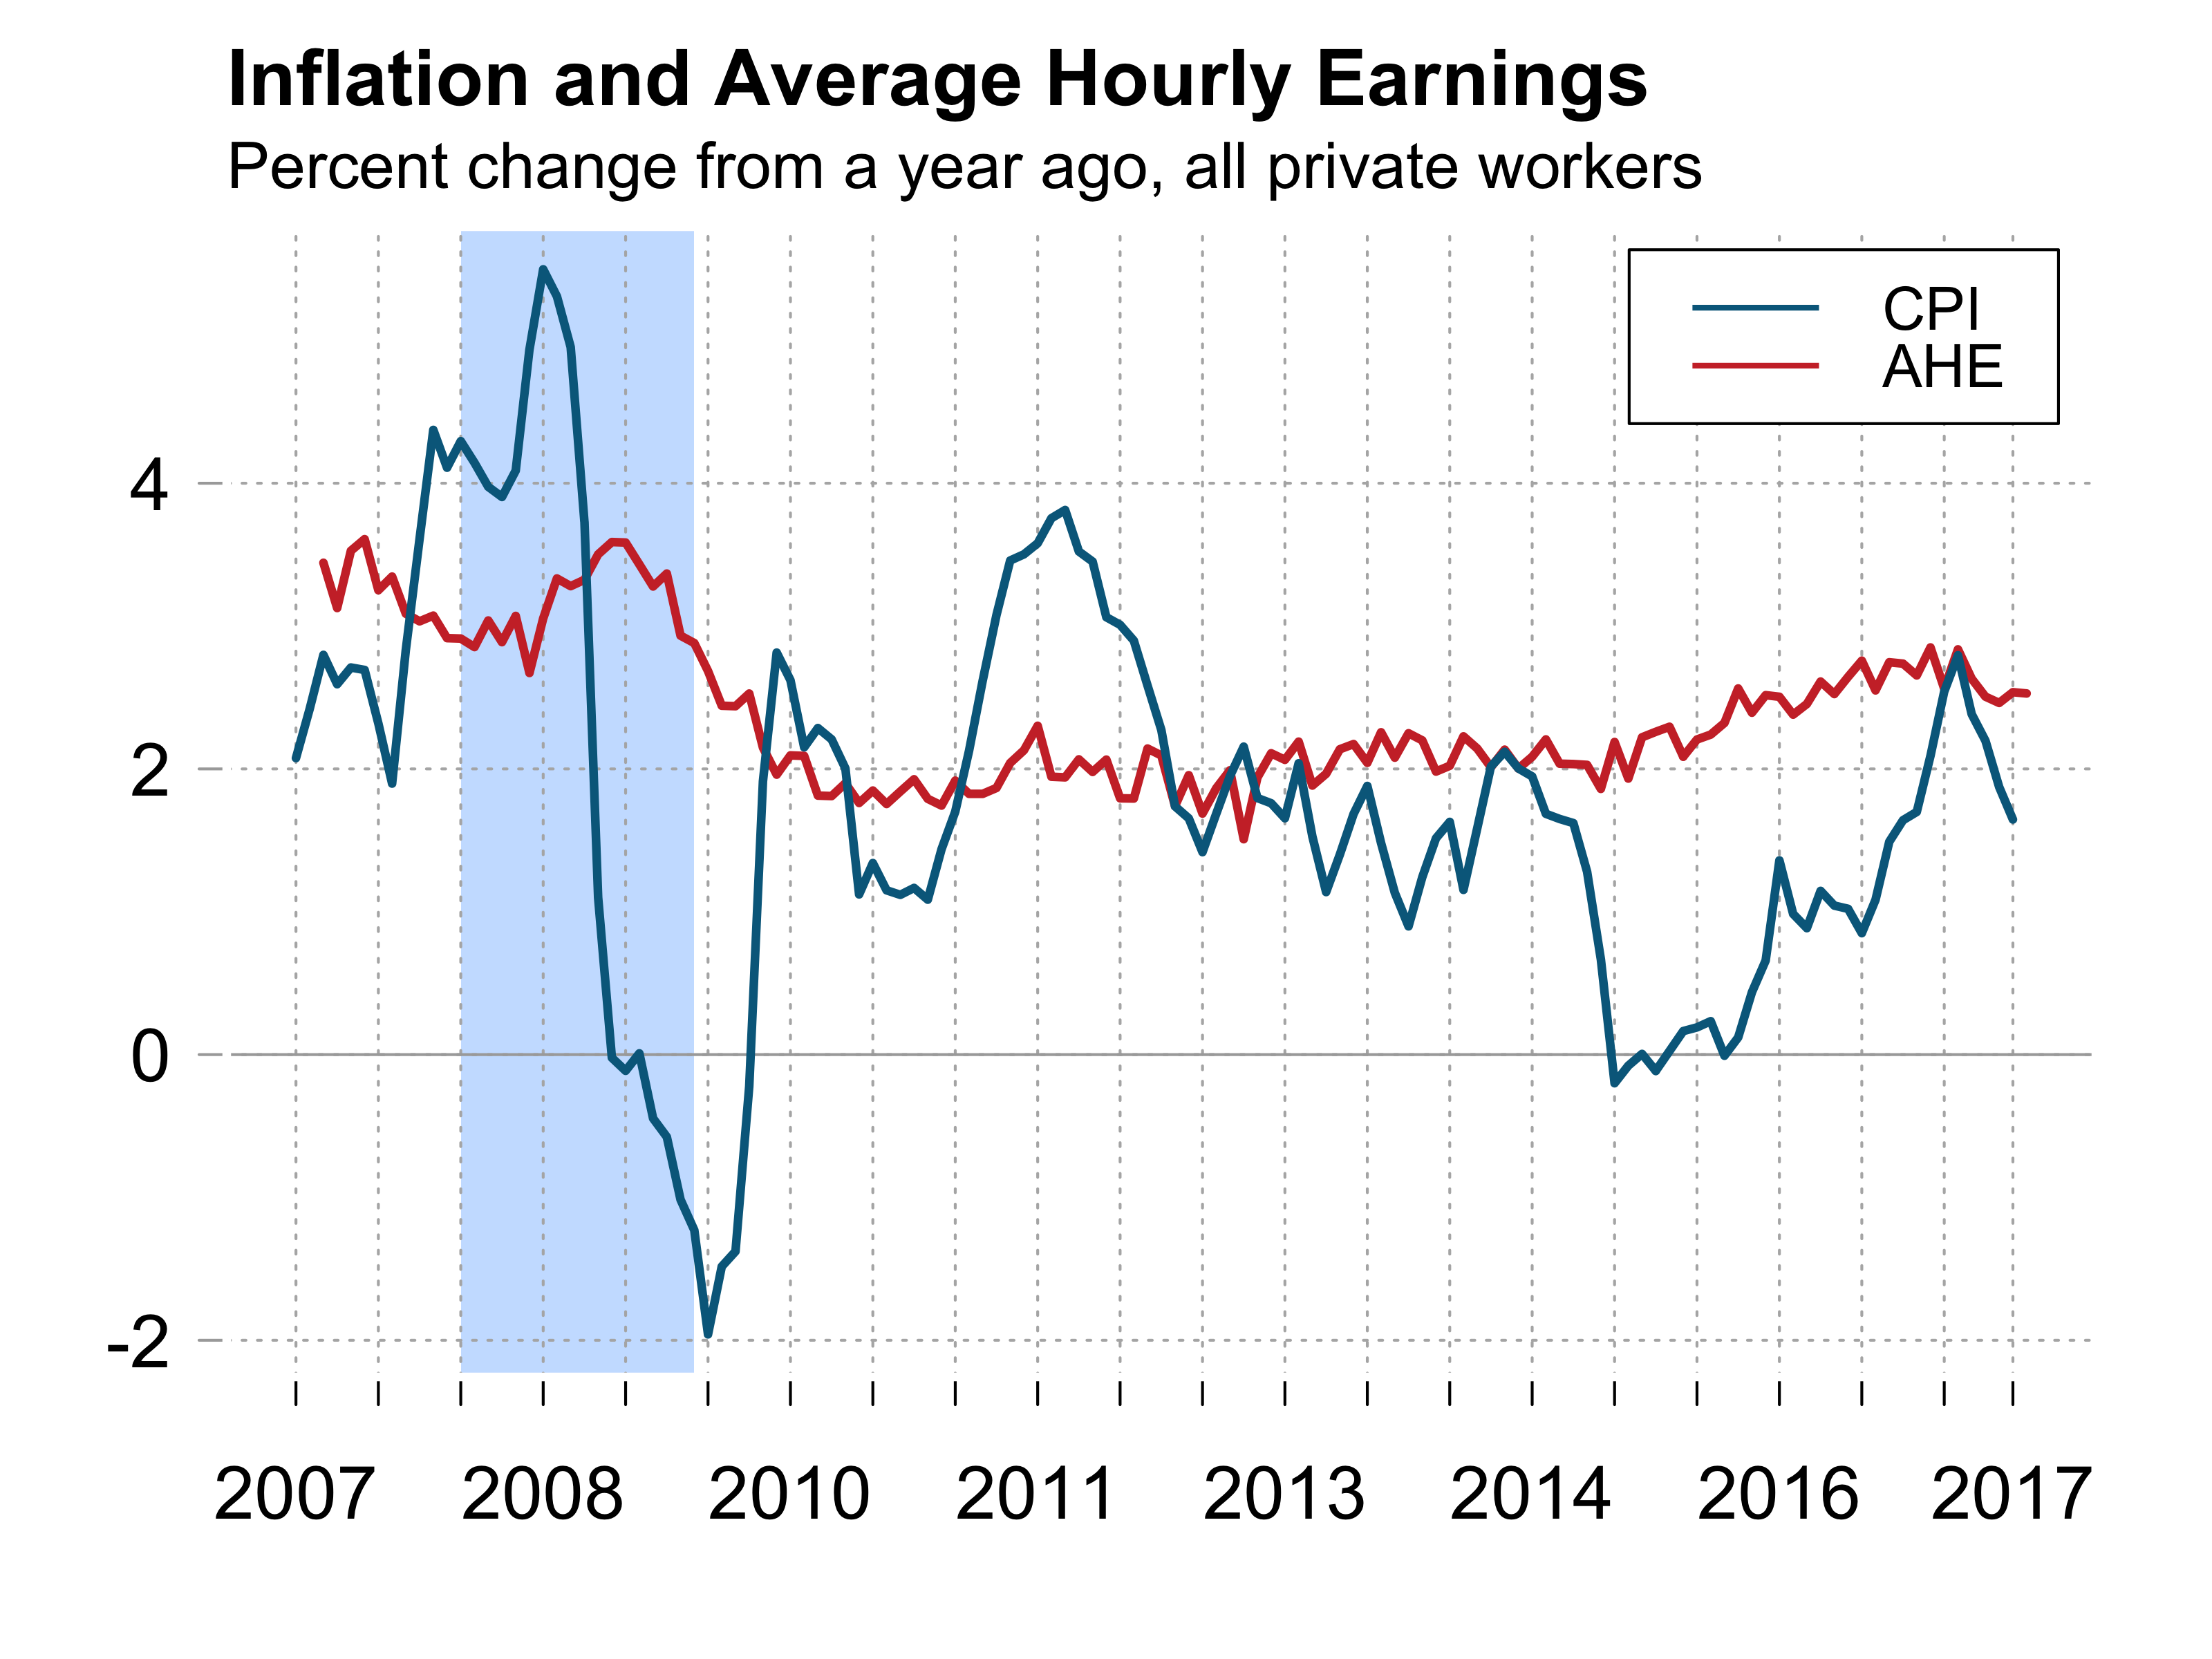
Average hours worked remained at 34.4 for the third straight month. Average hourly earnings rose 0.5% over the month and are up 2.9% year over year. Given the changes in the CPI and PCE, real earnings have grown between .5% and 1%, respectively.

avghours-2017-10-06

ahe-2017-10-06

ahecpipceps-2017-10-06

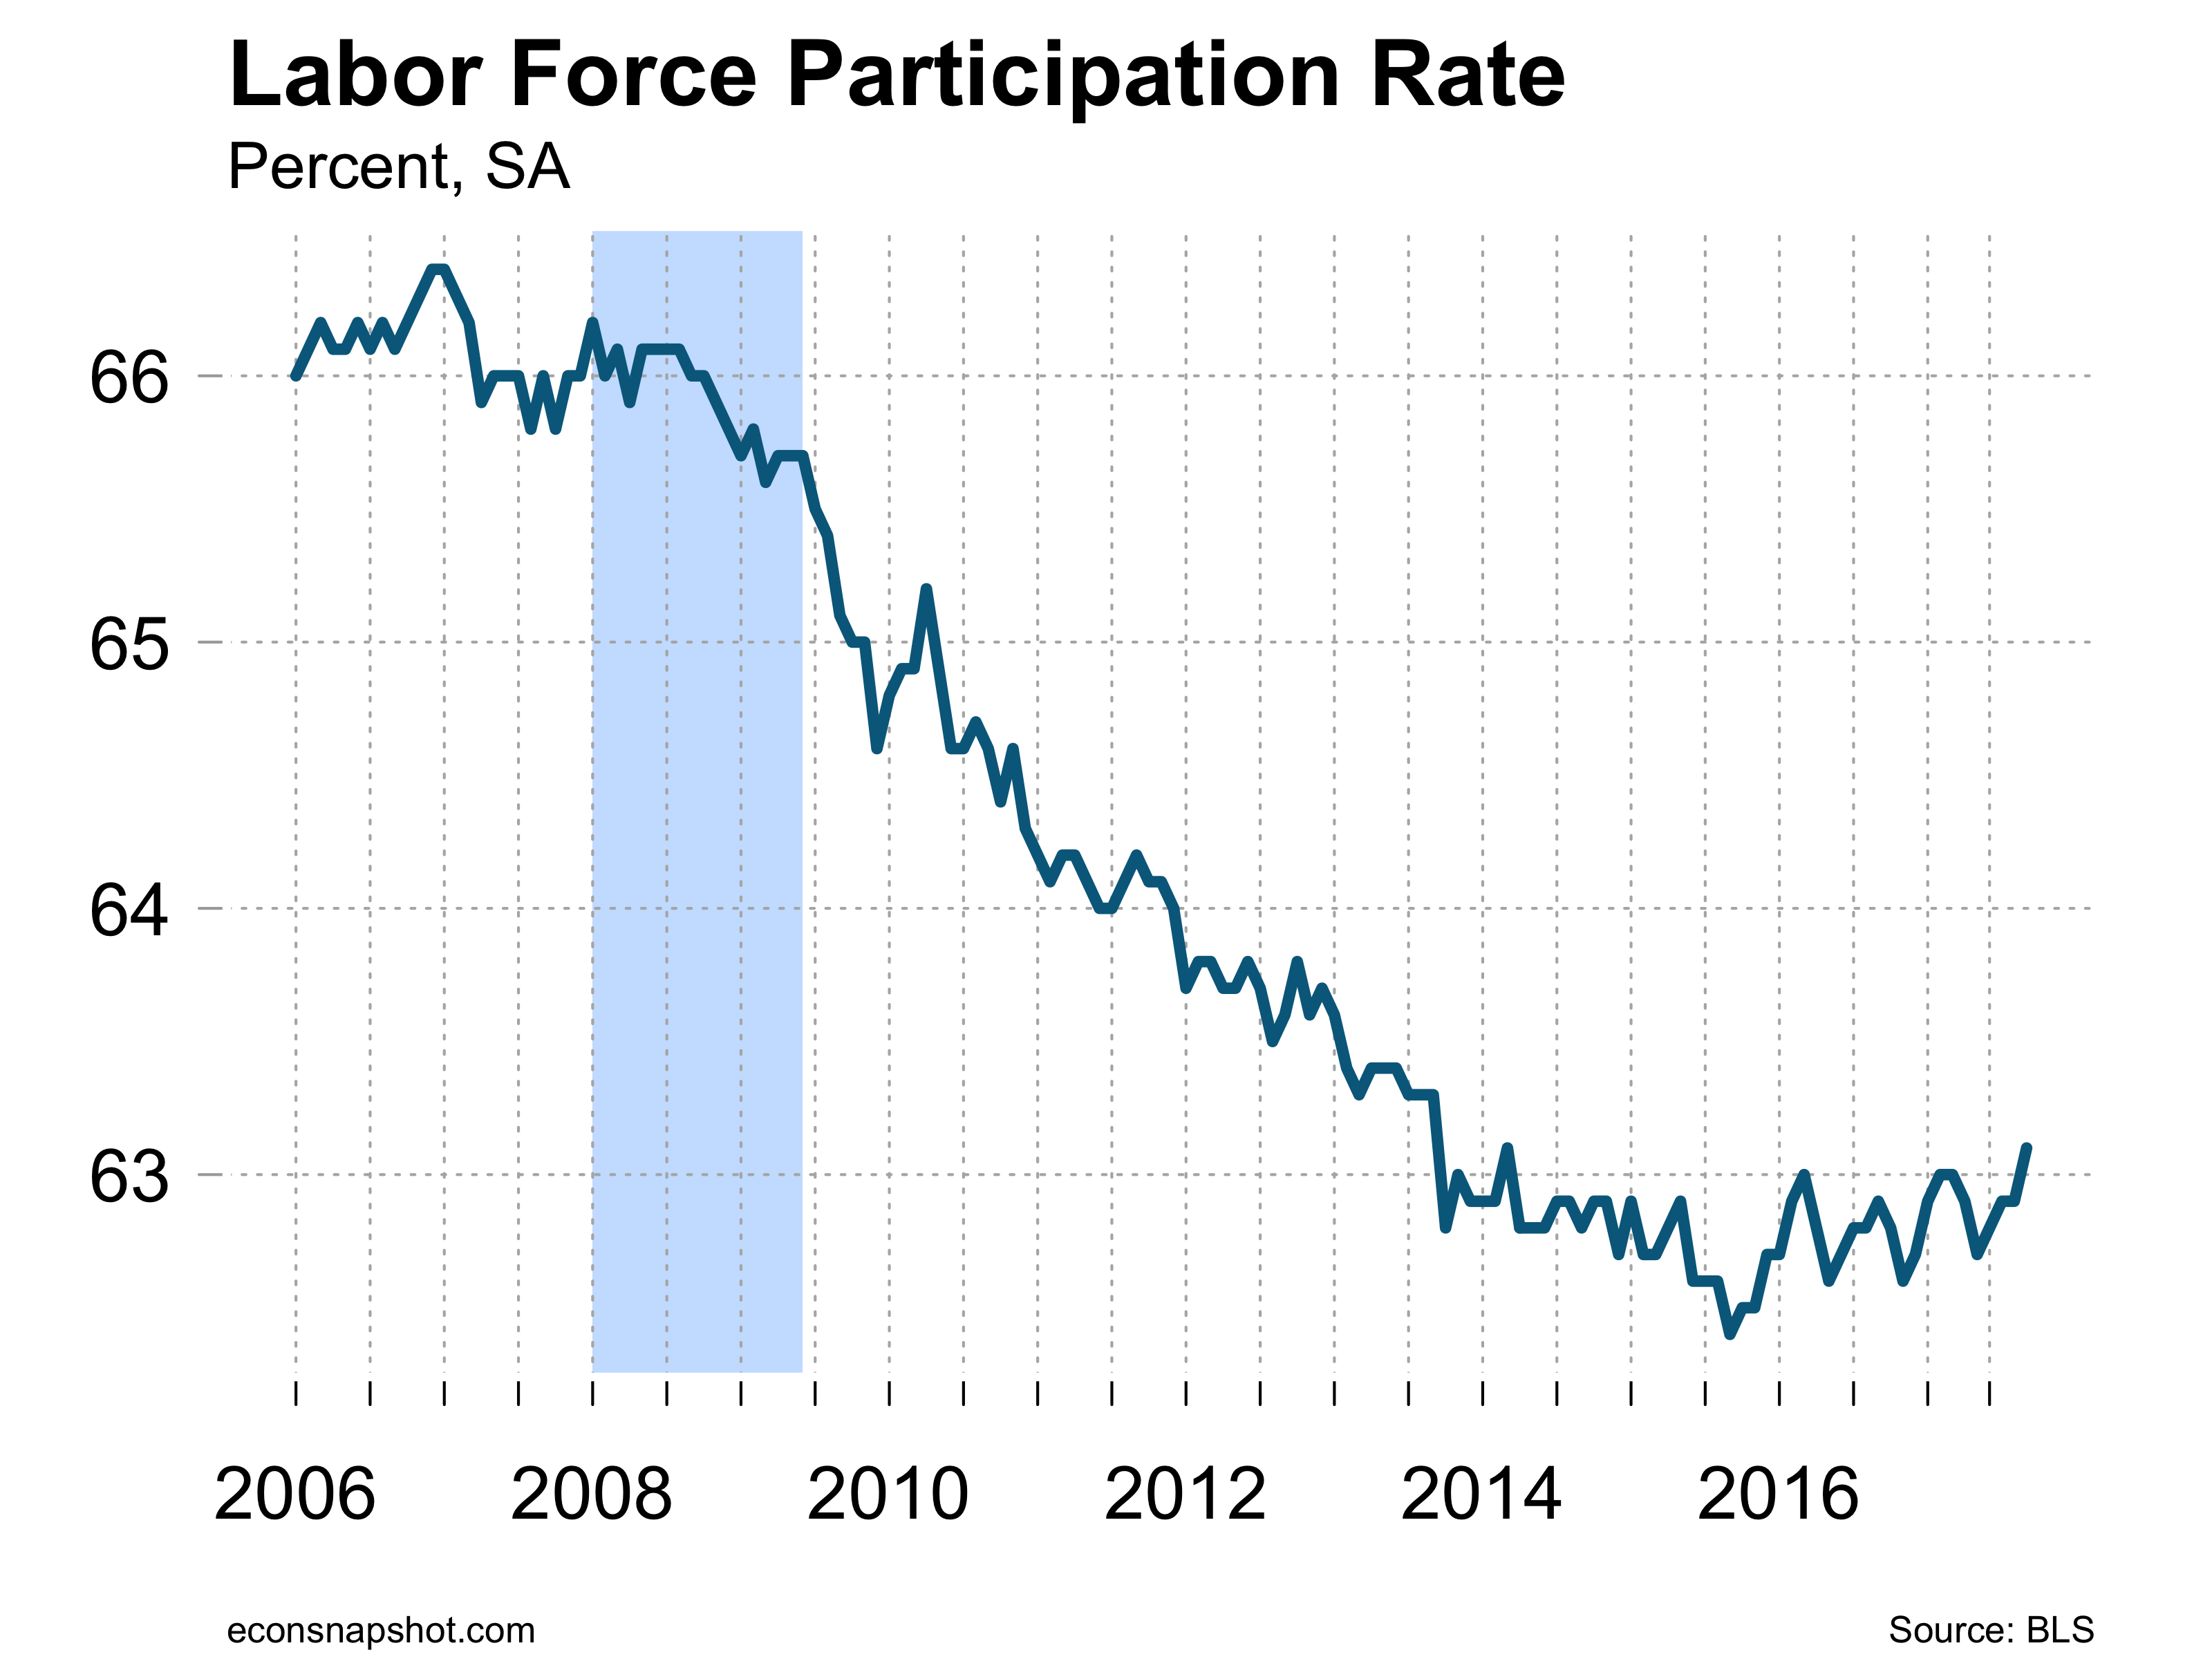
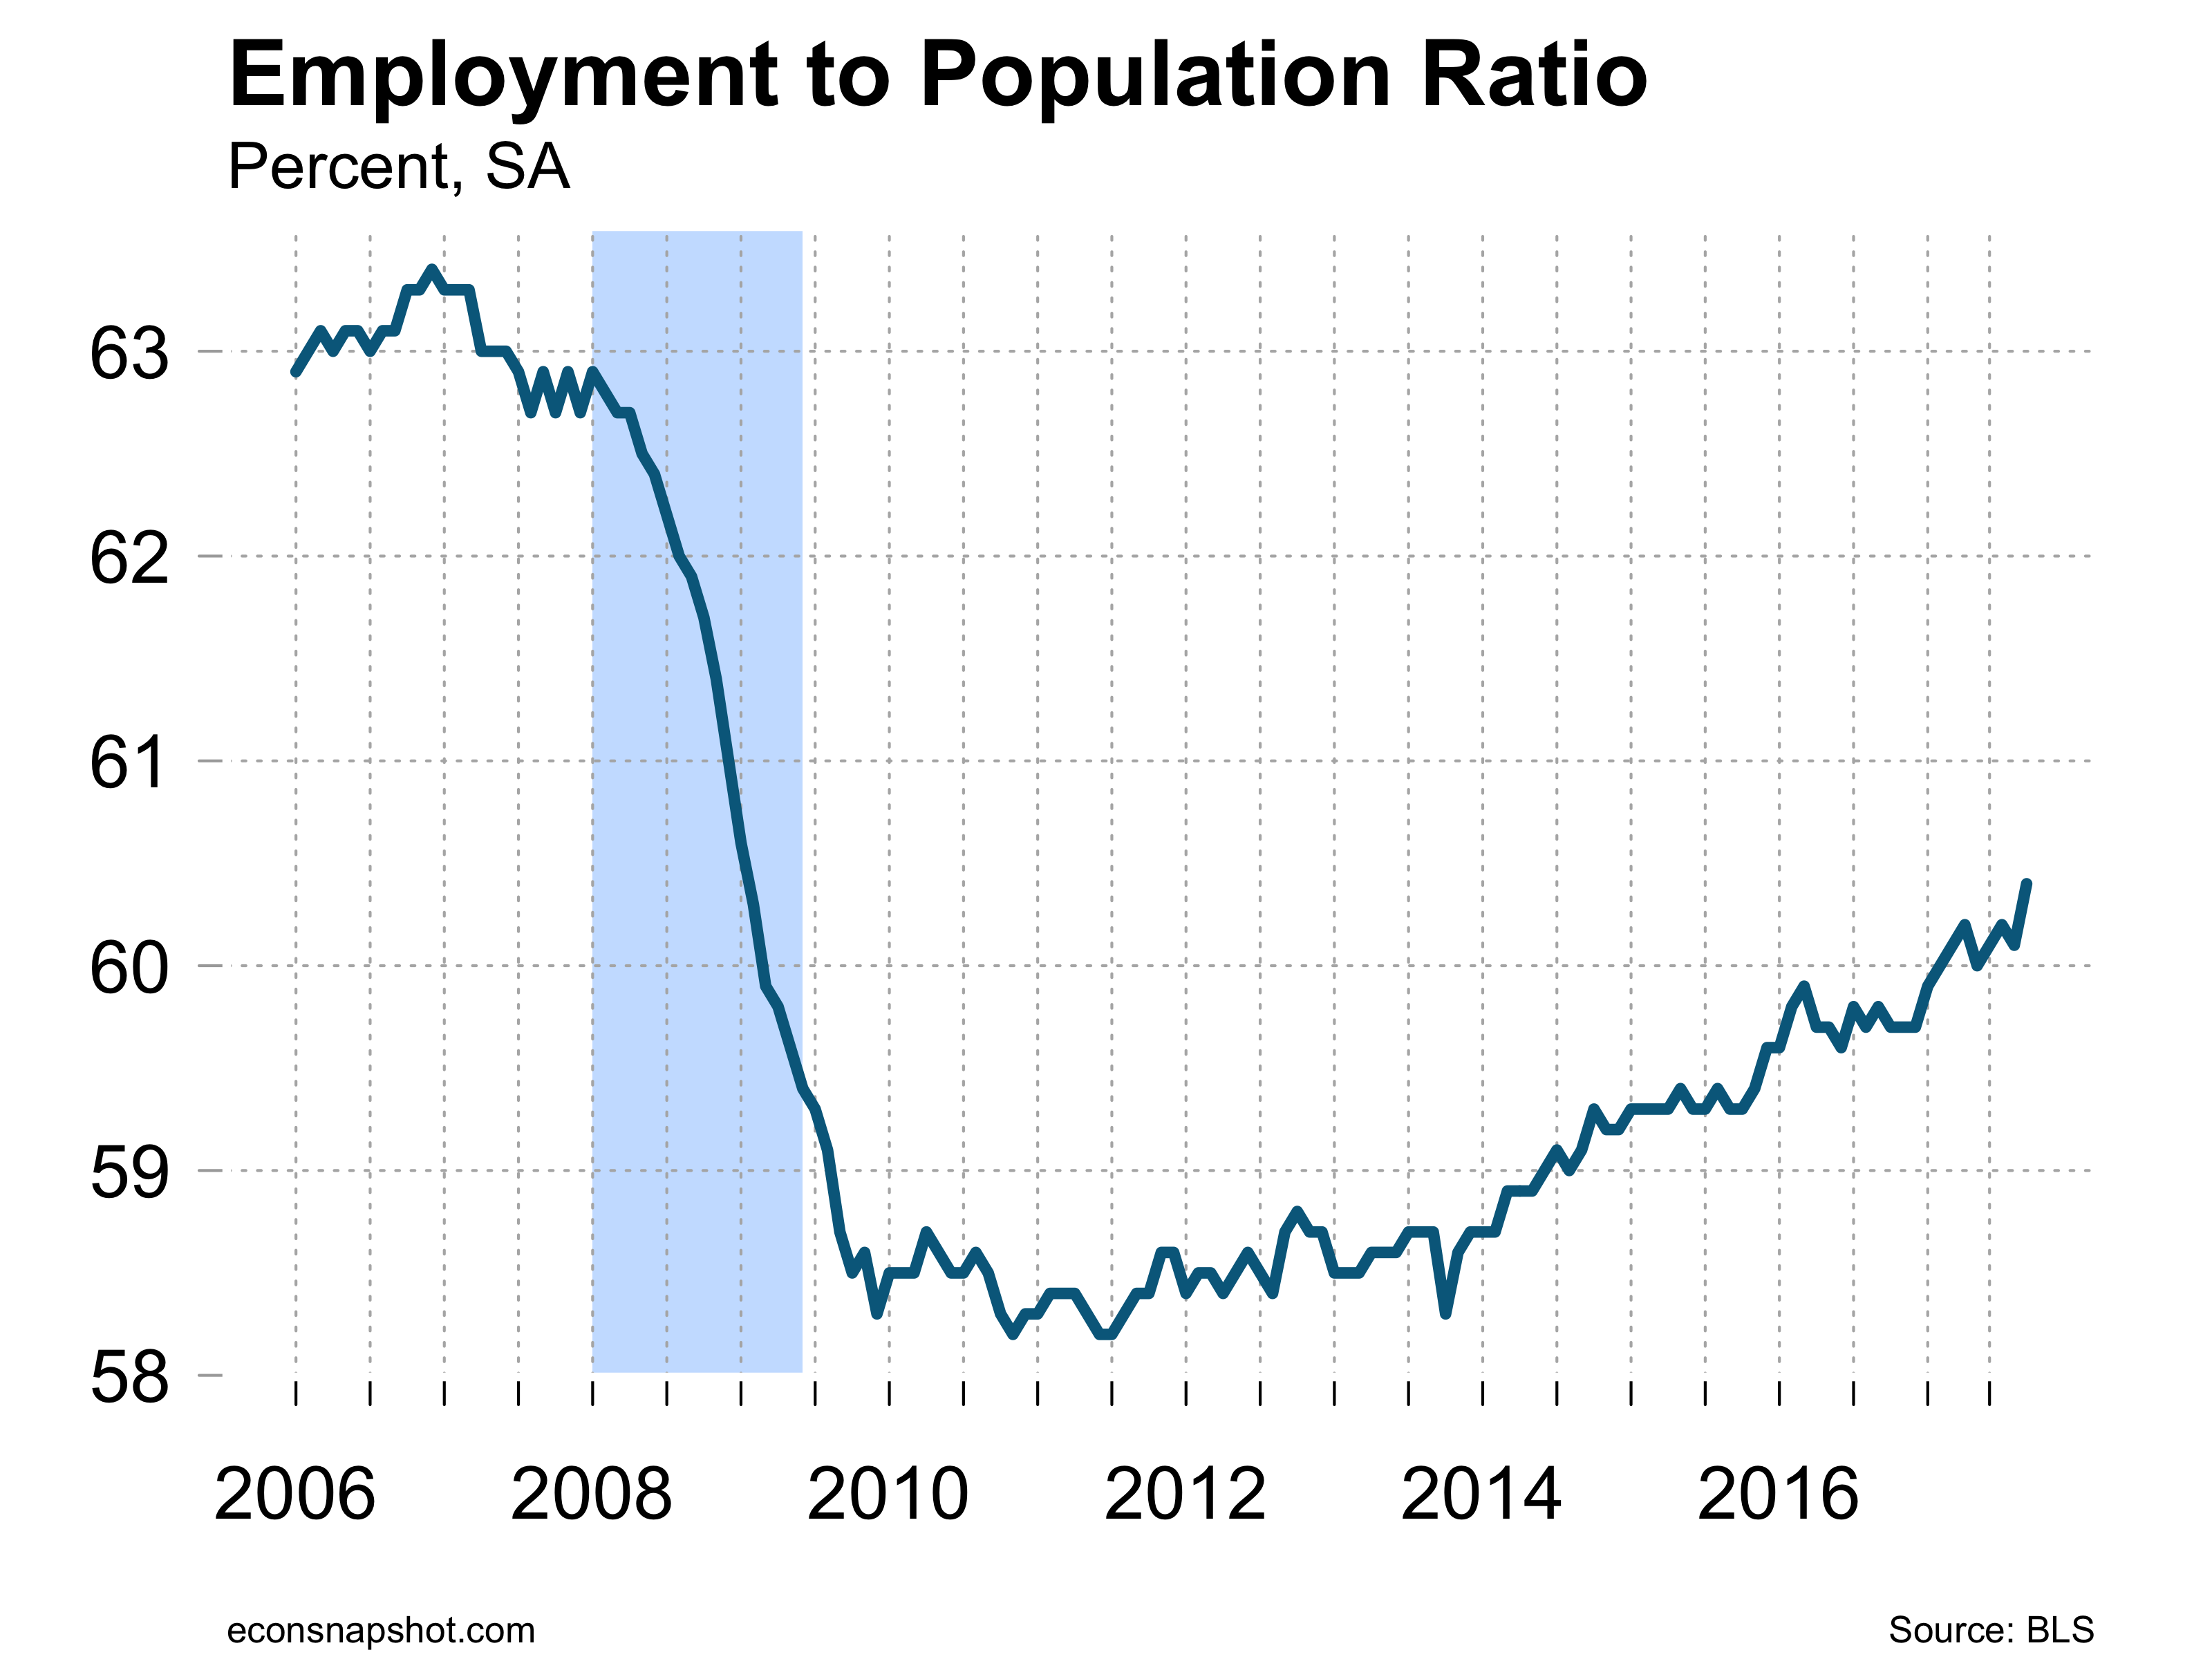
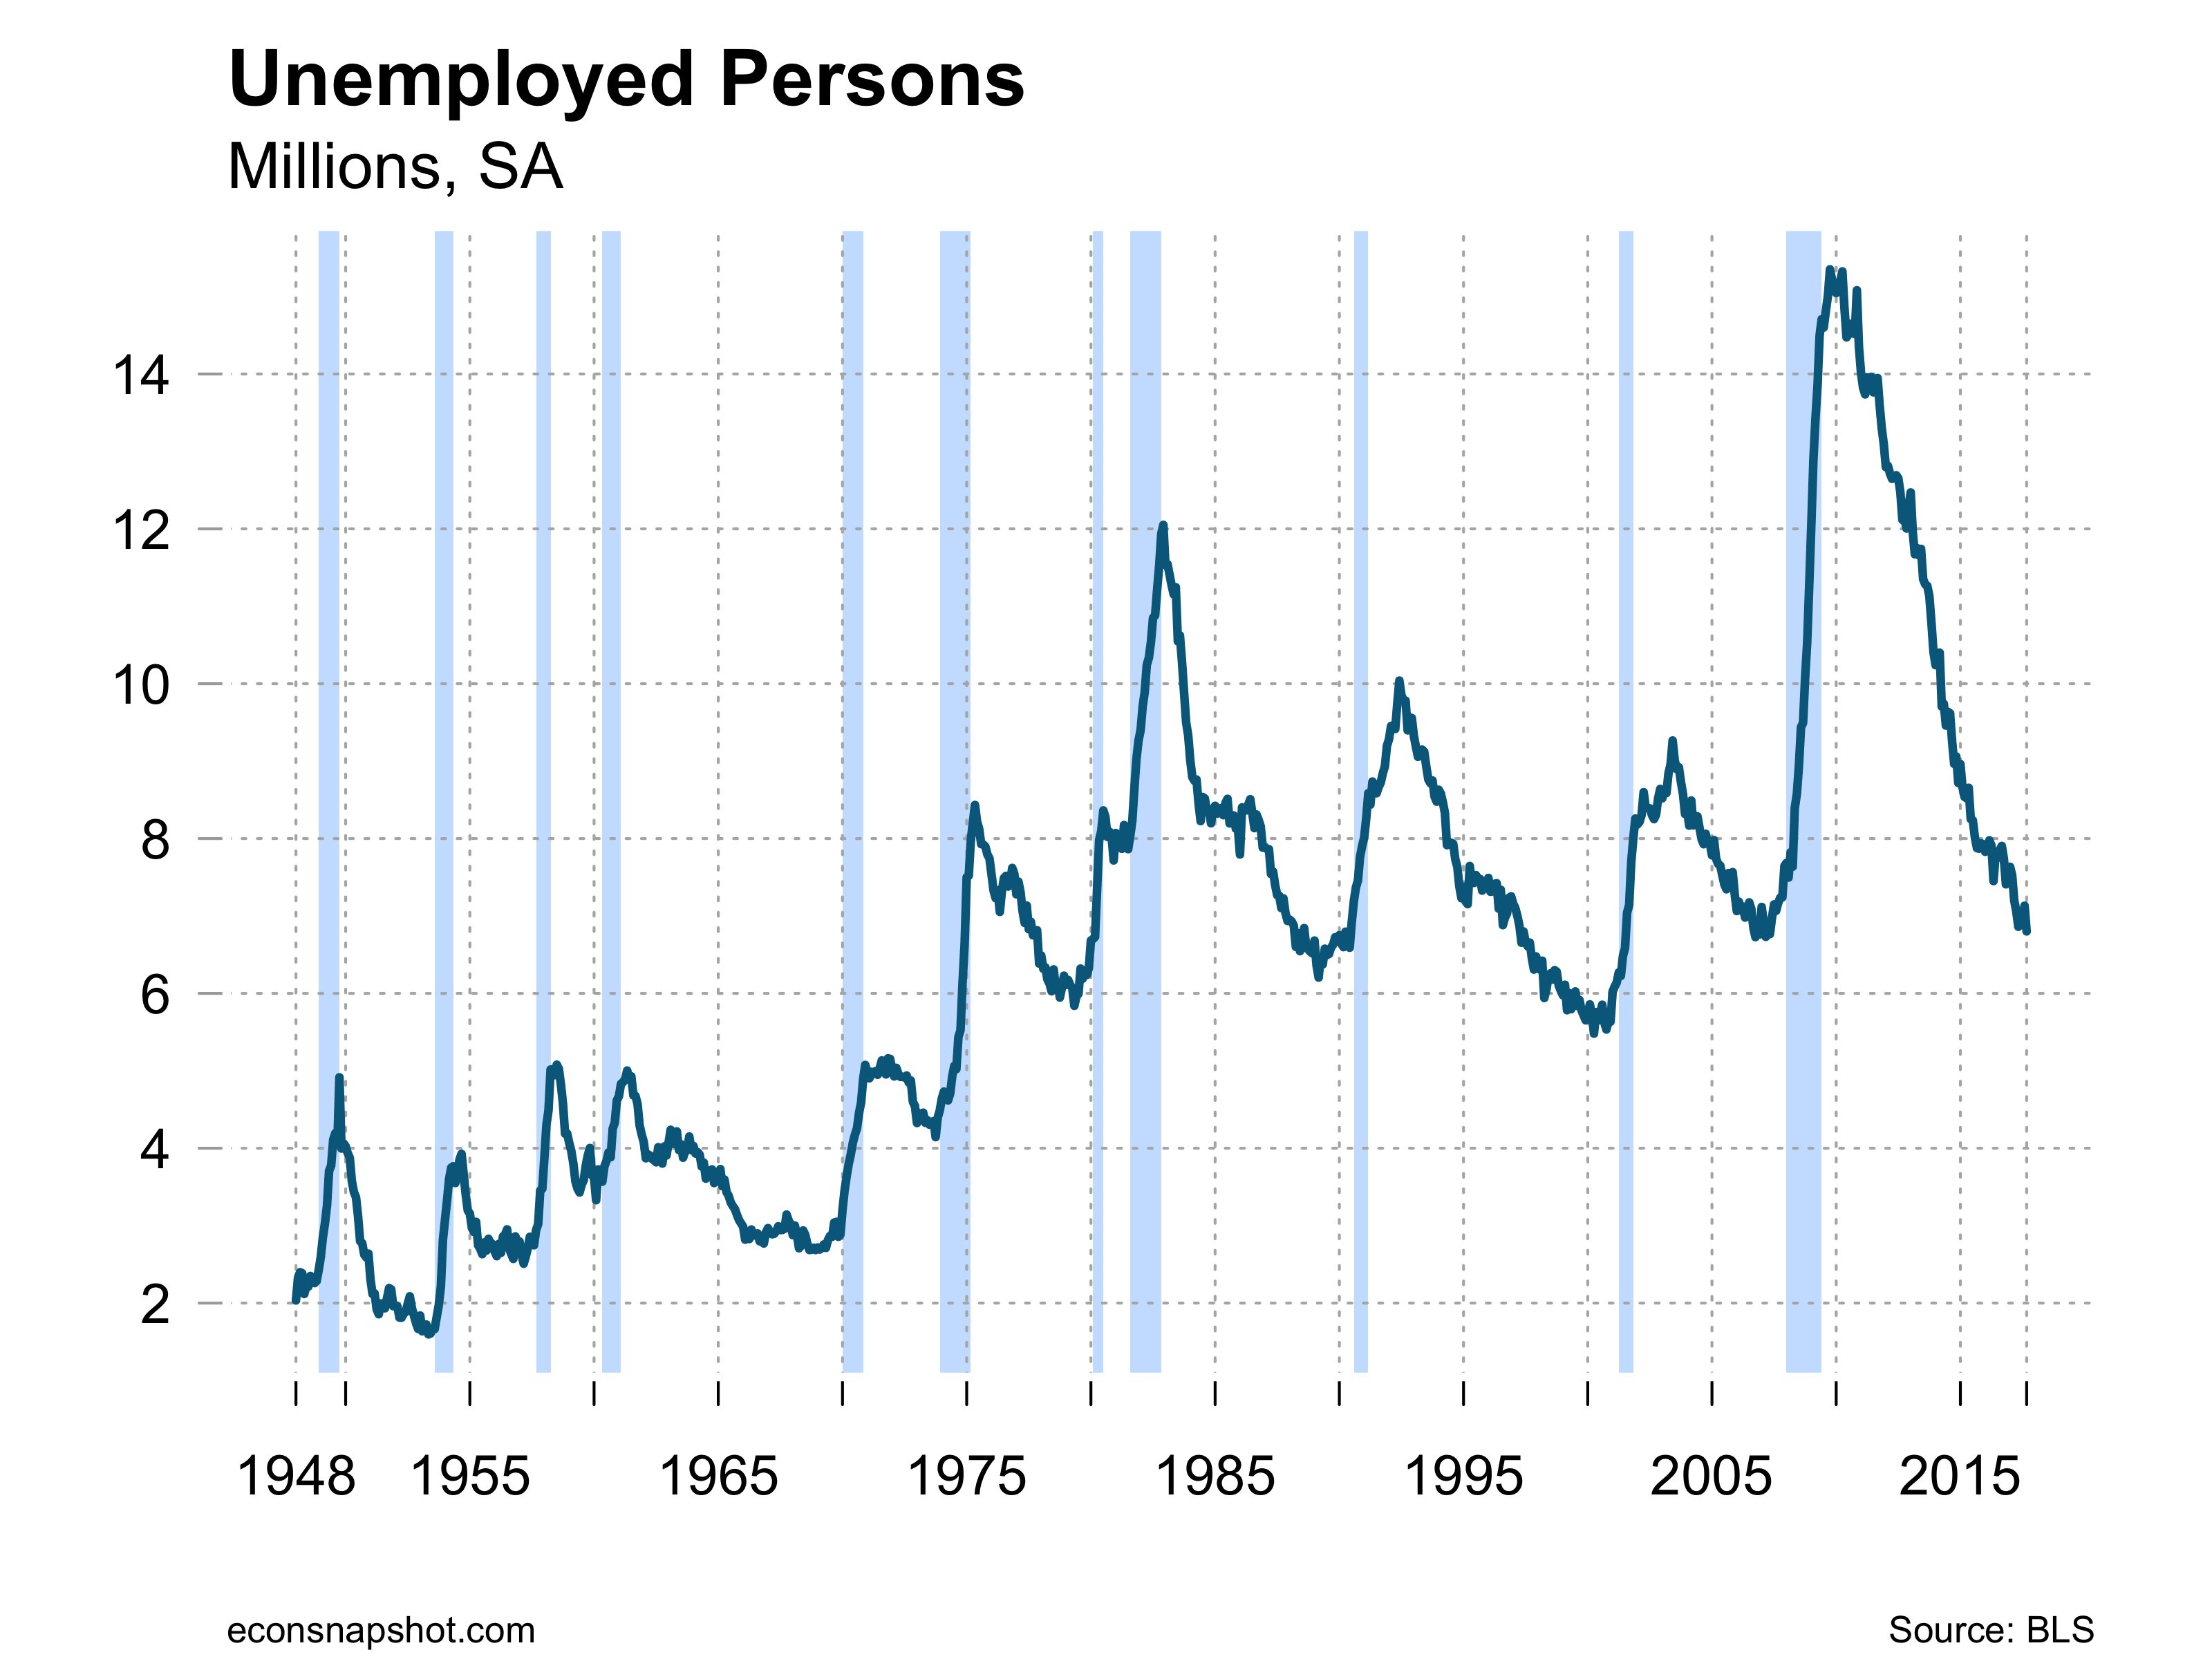
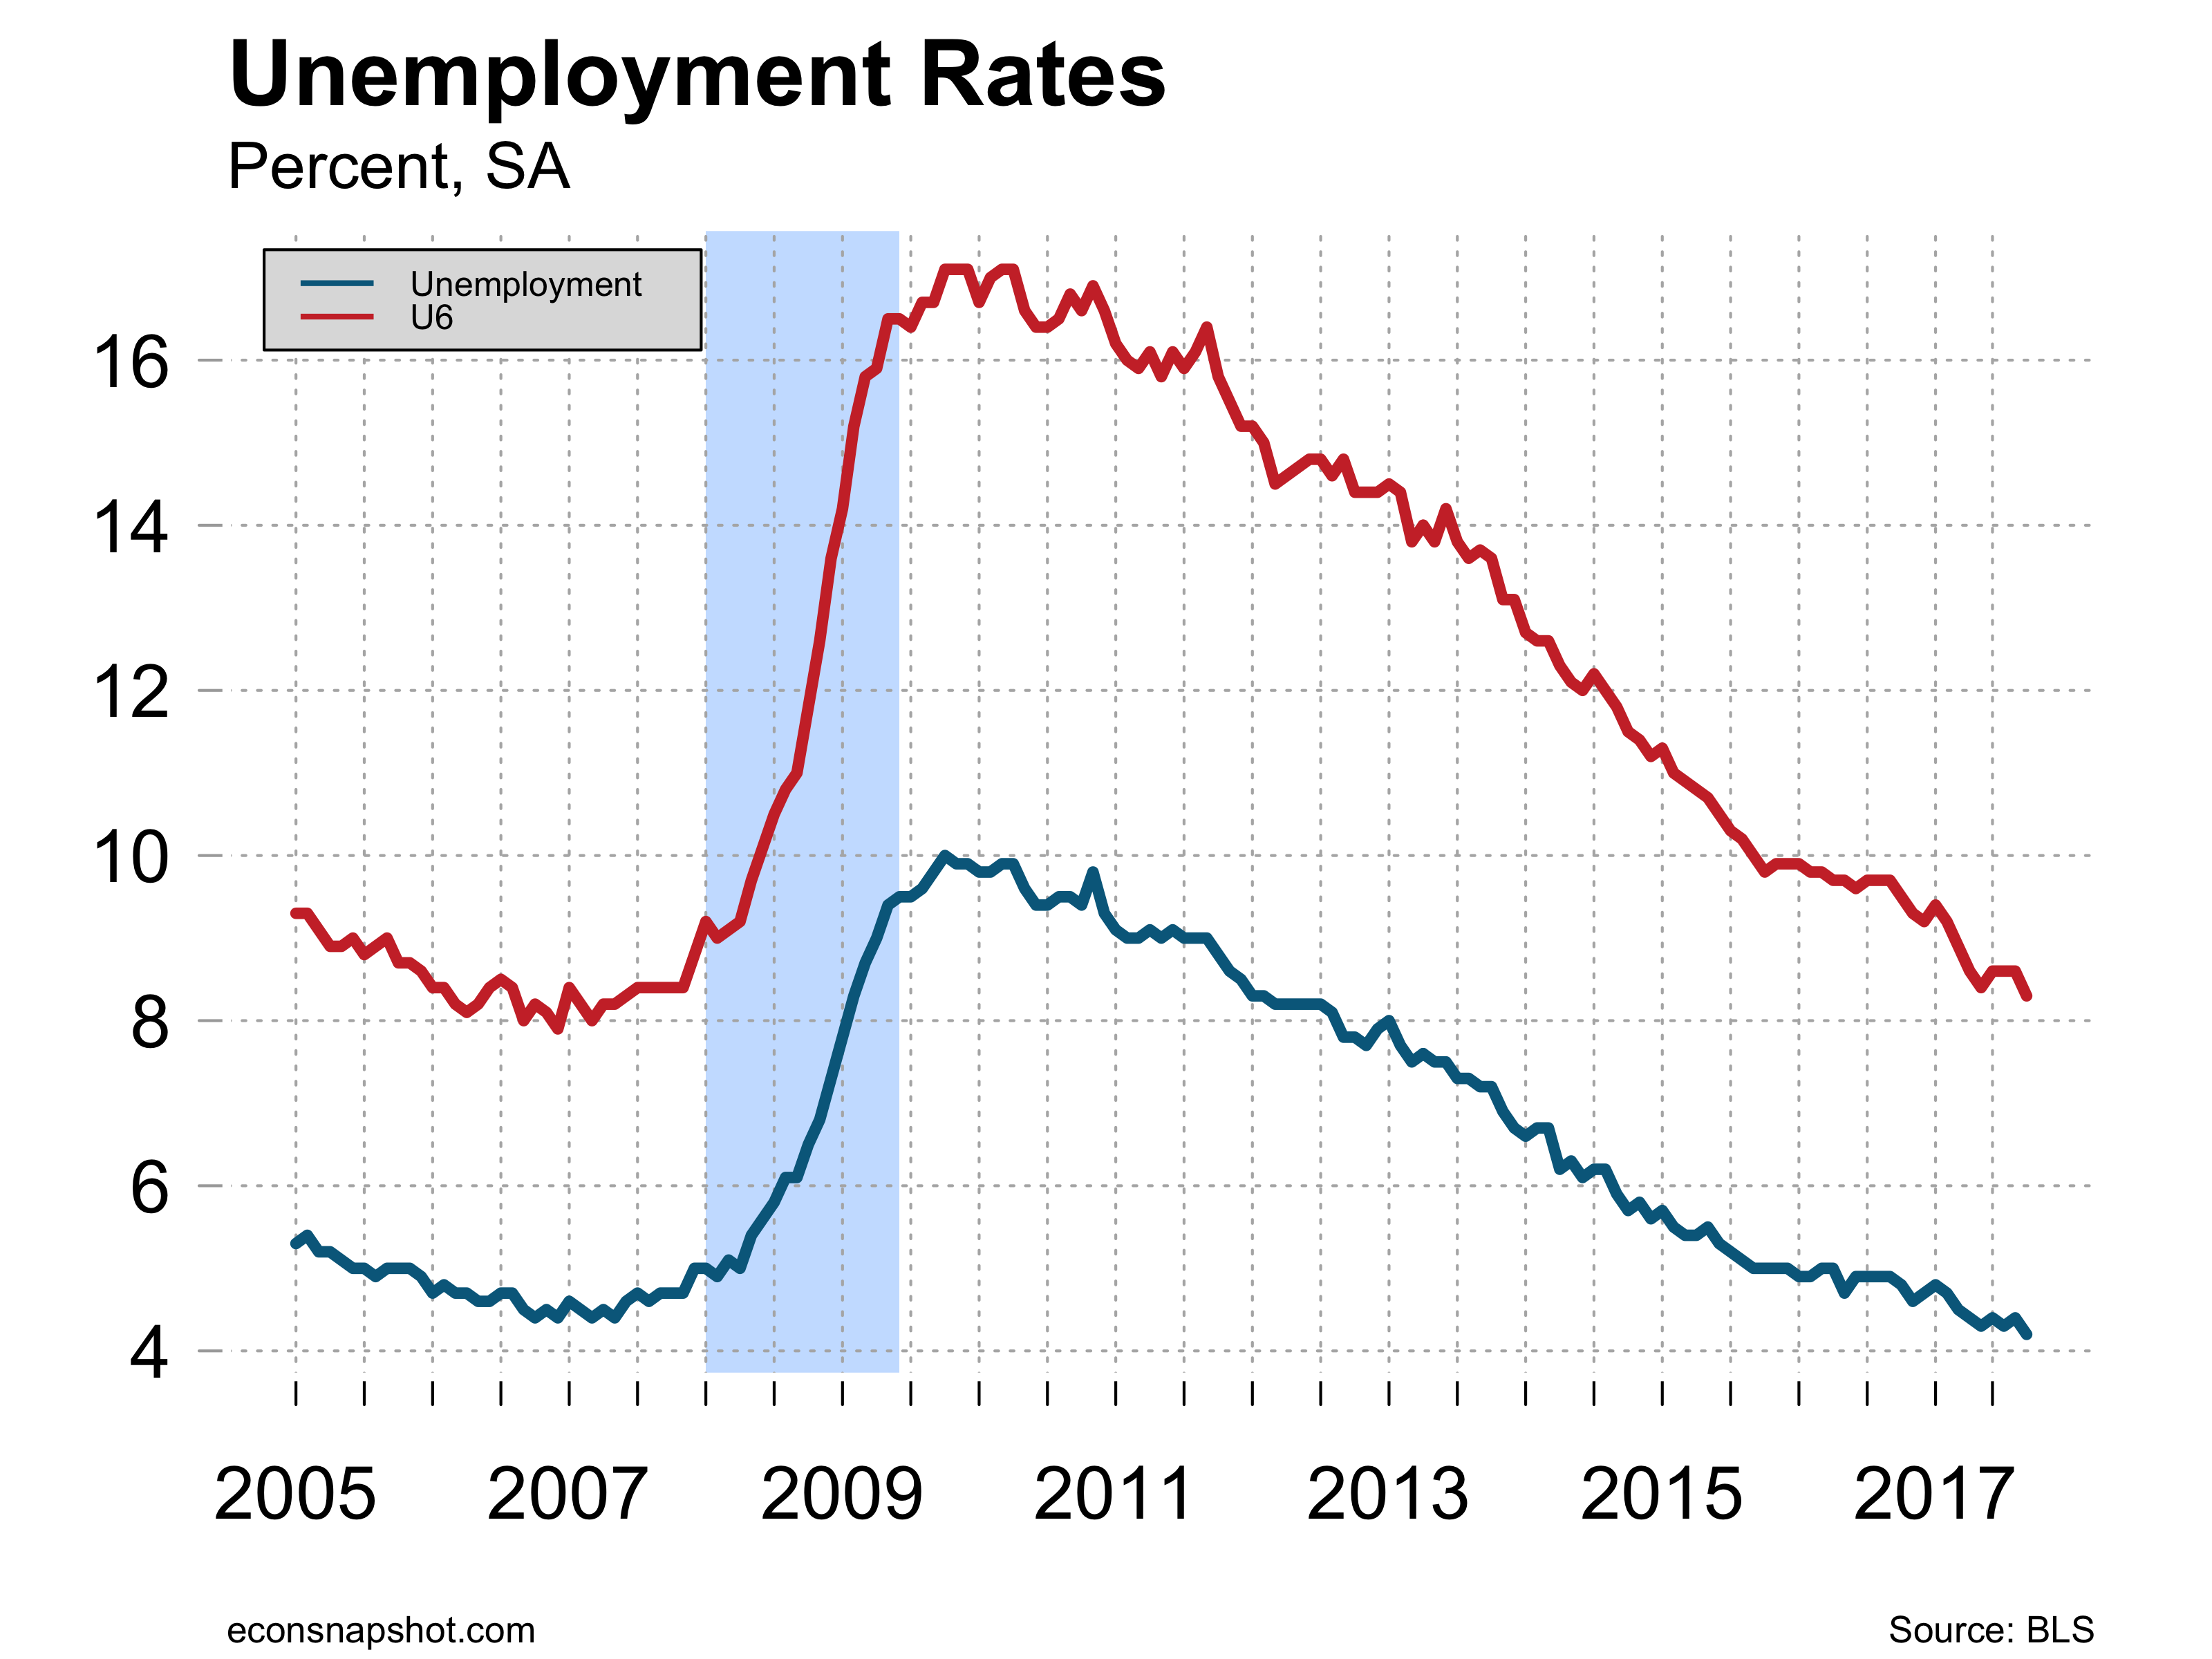
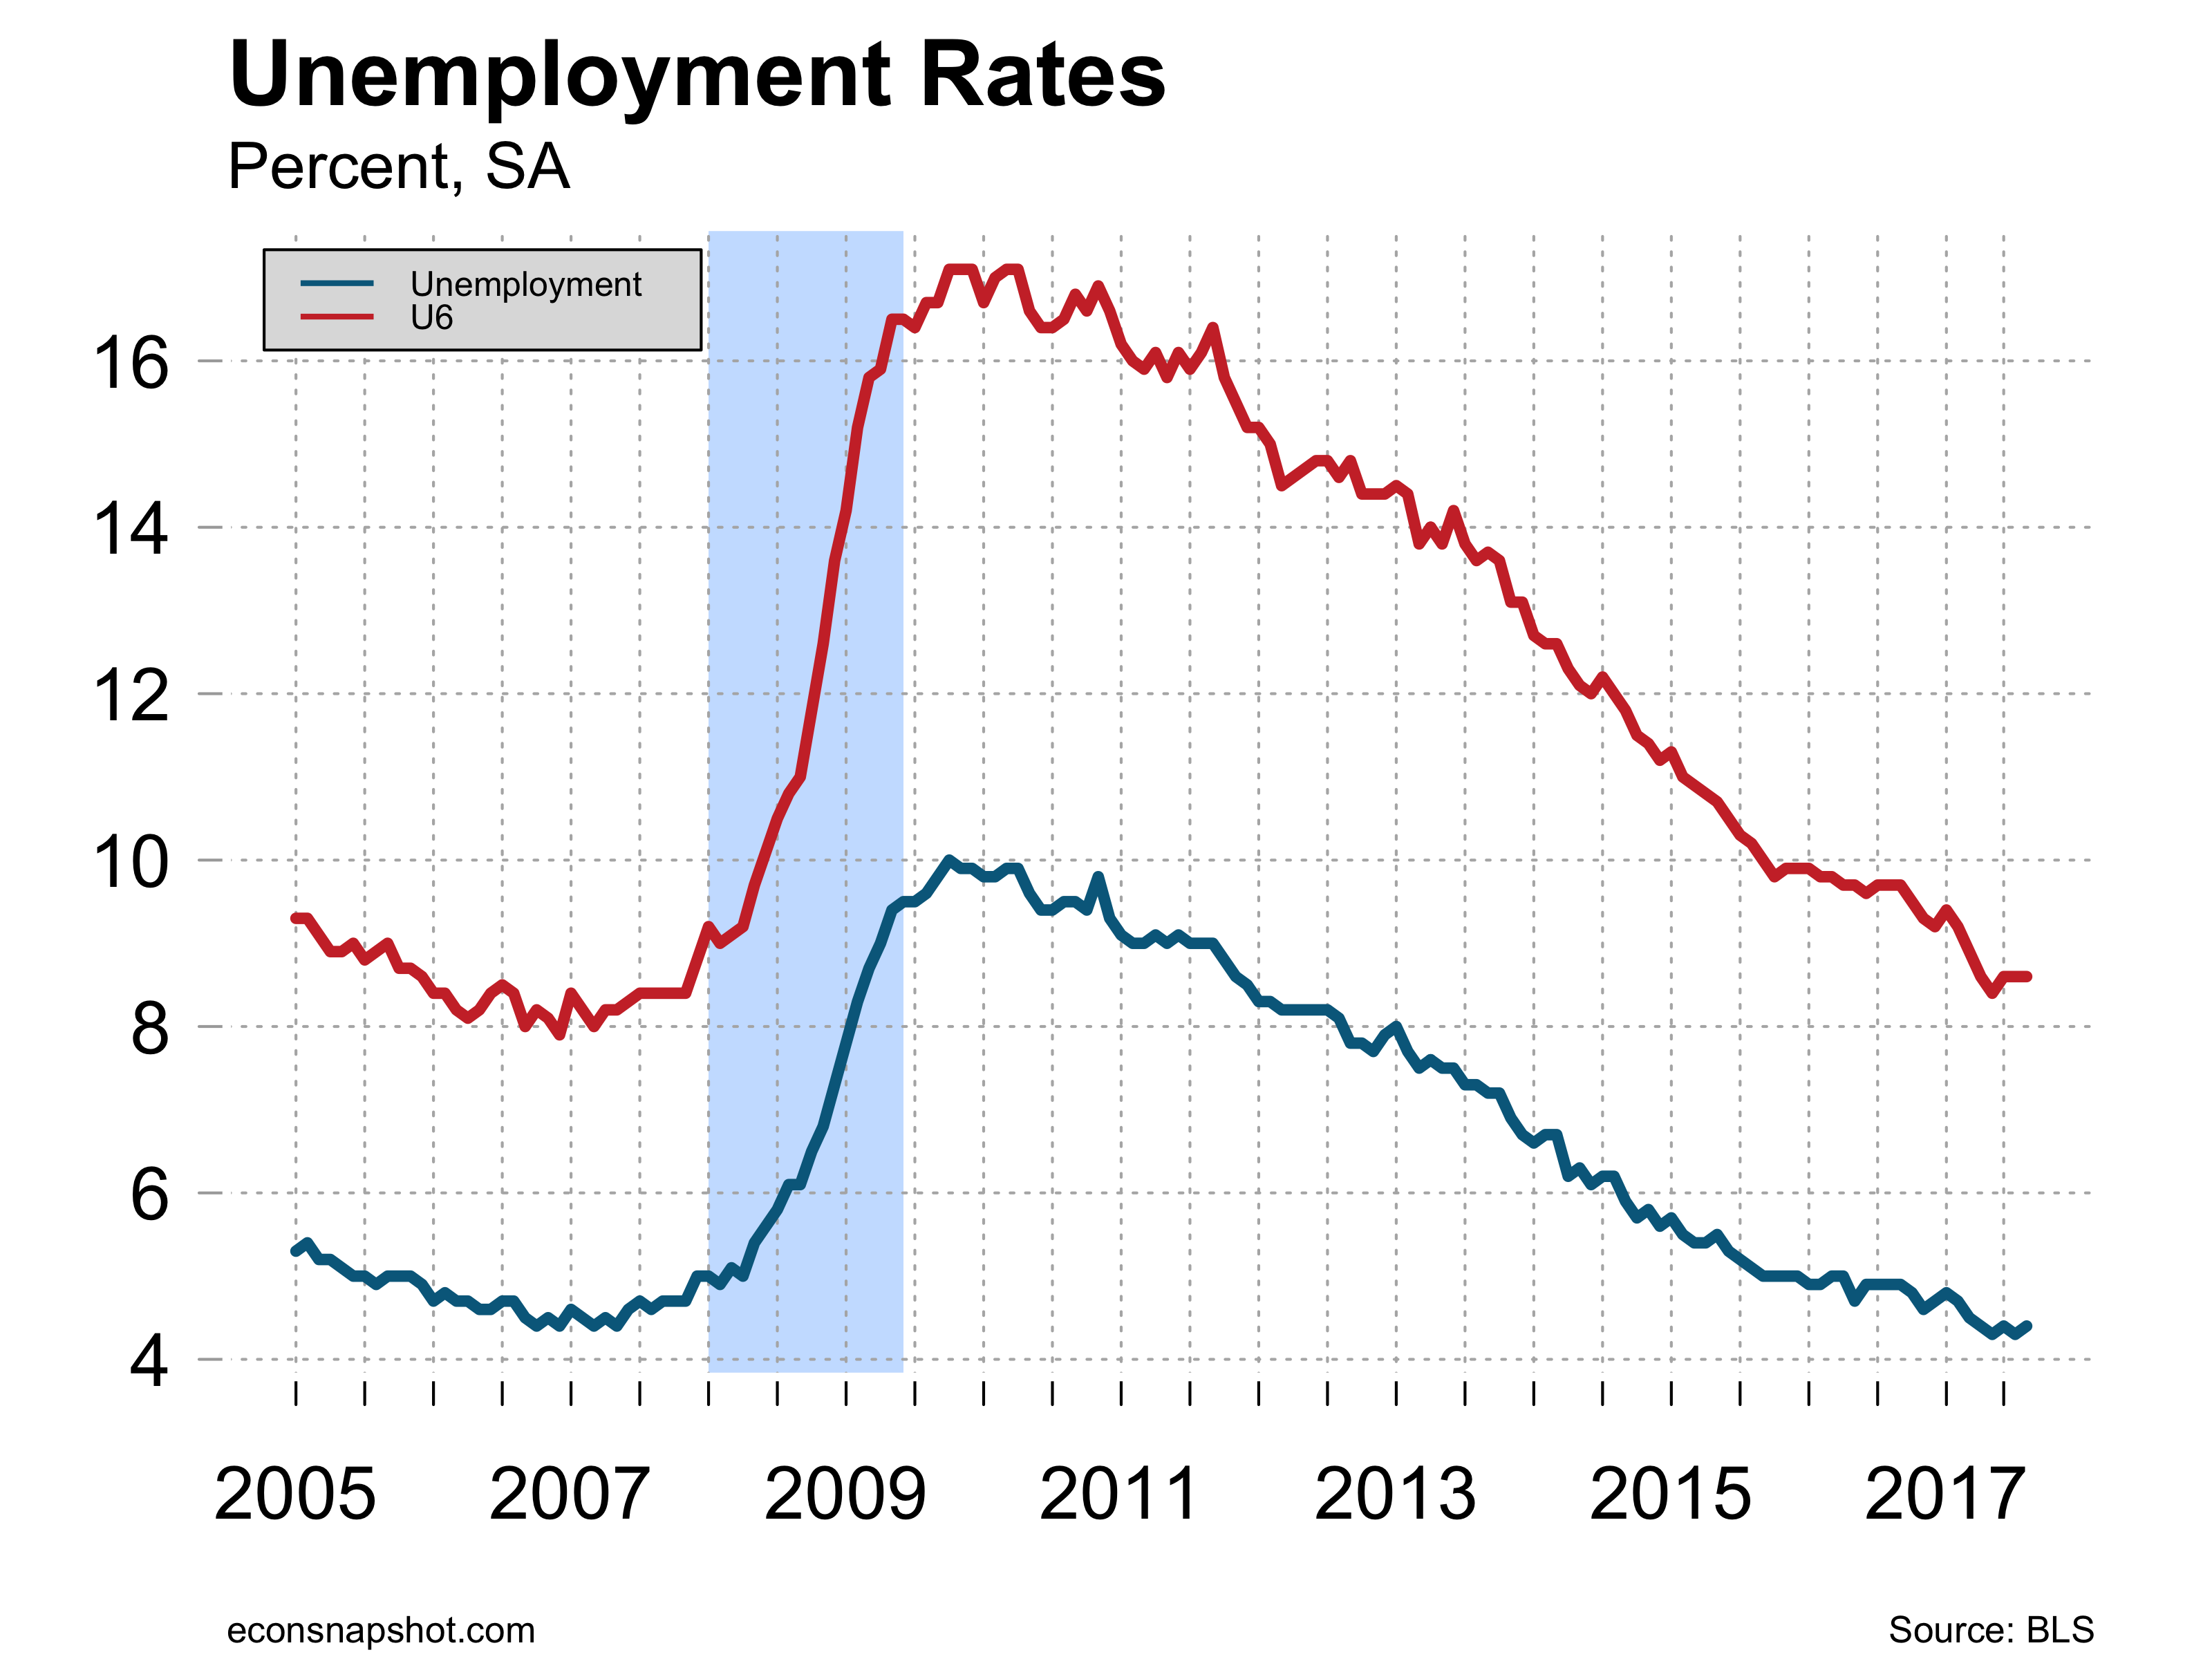
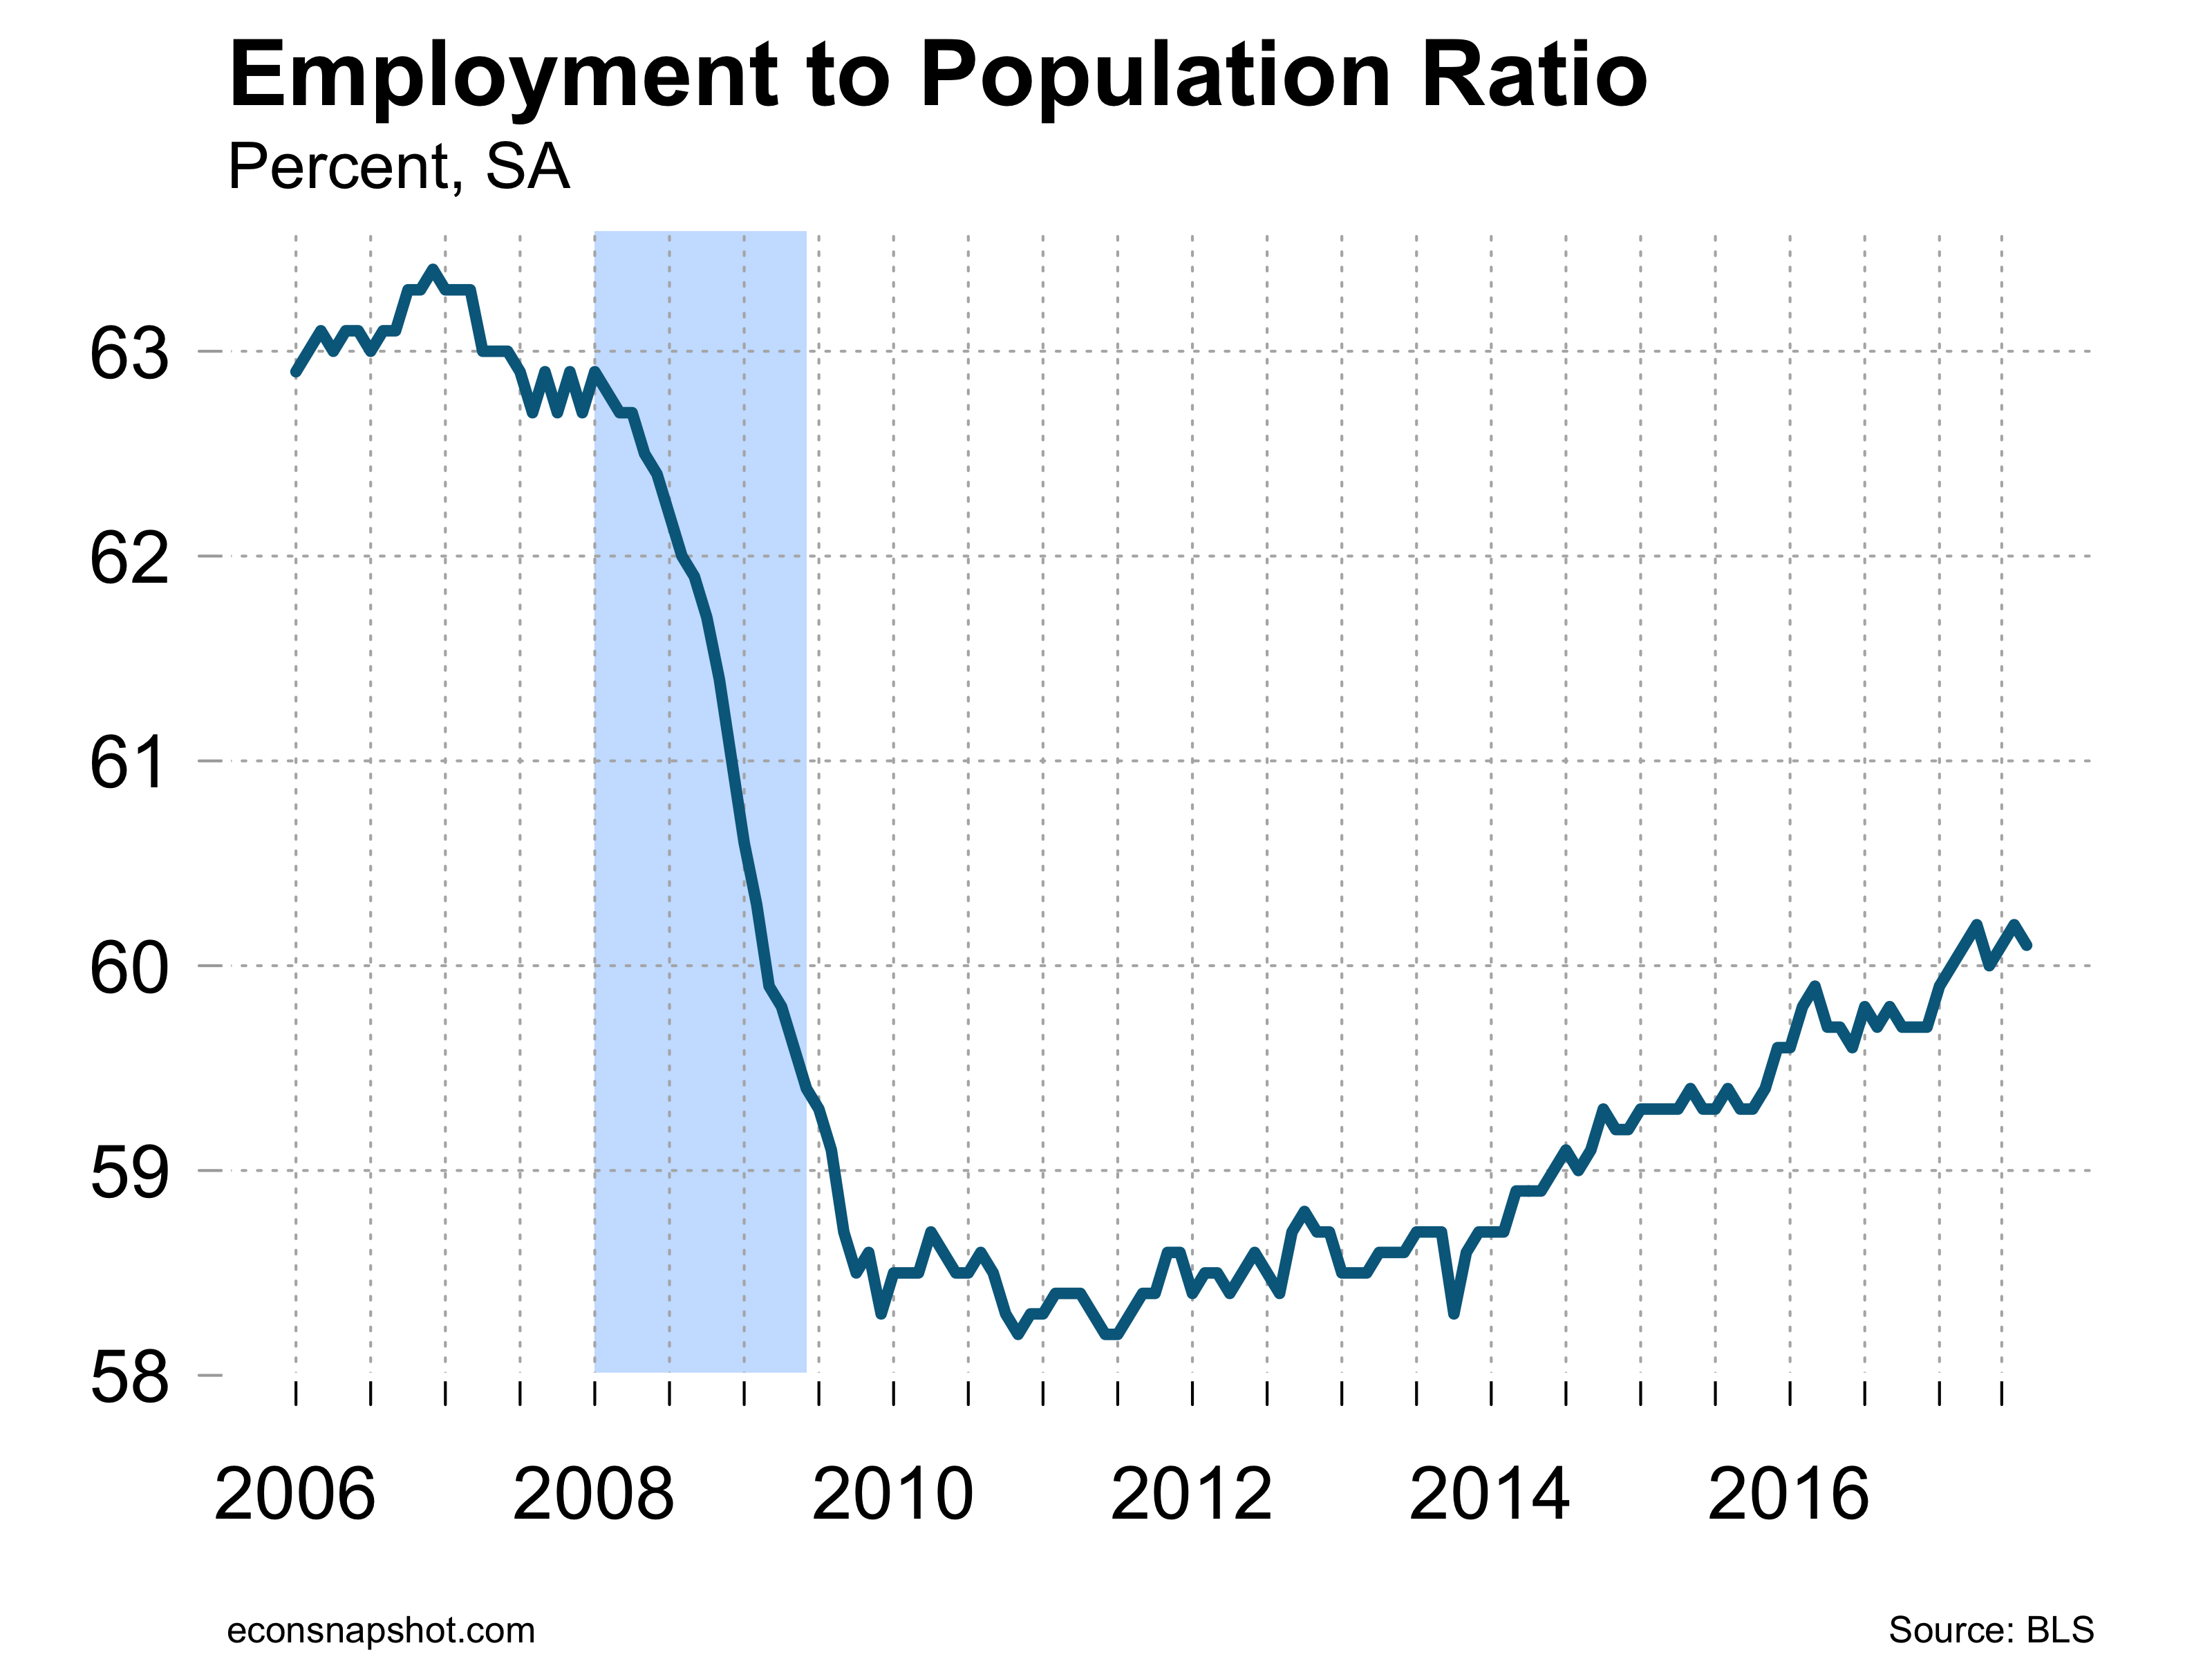
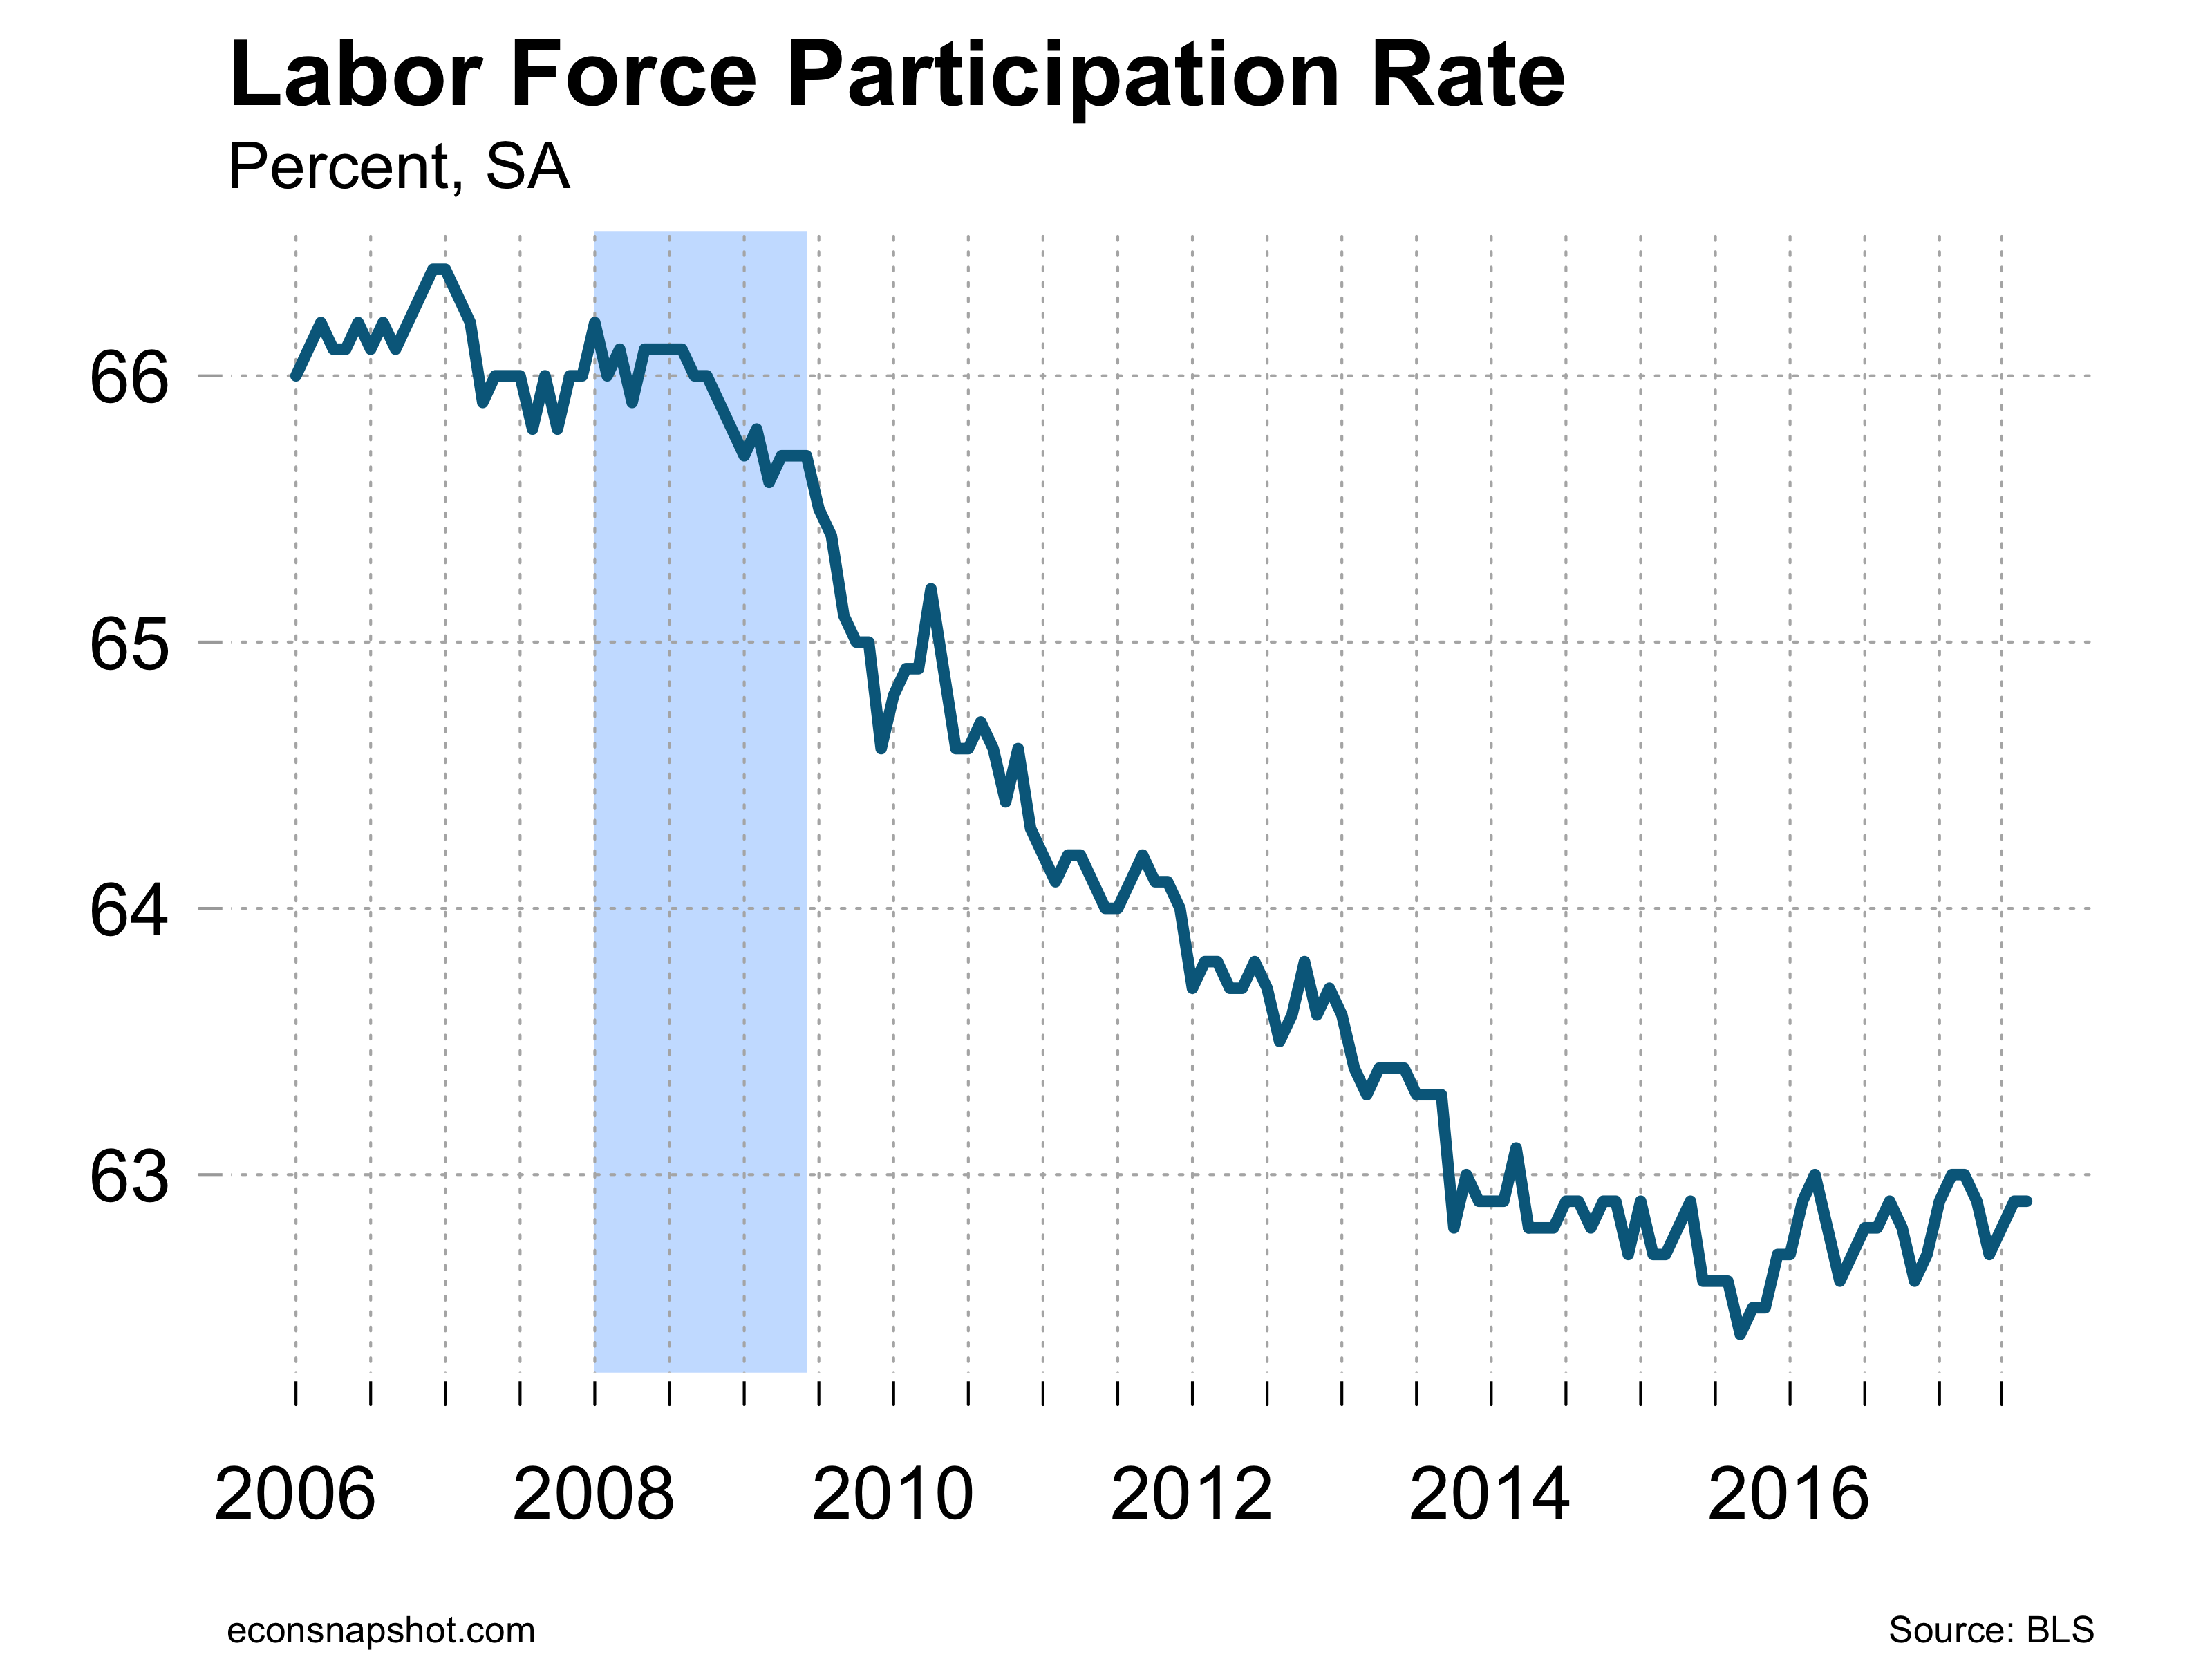
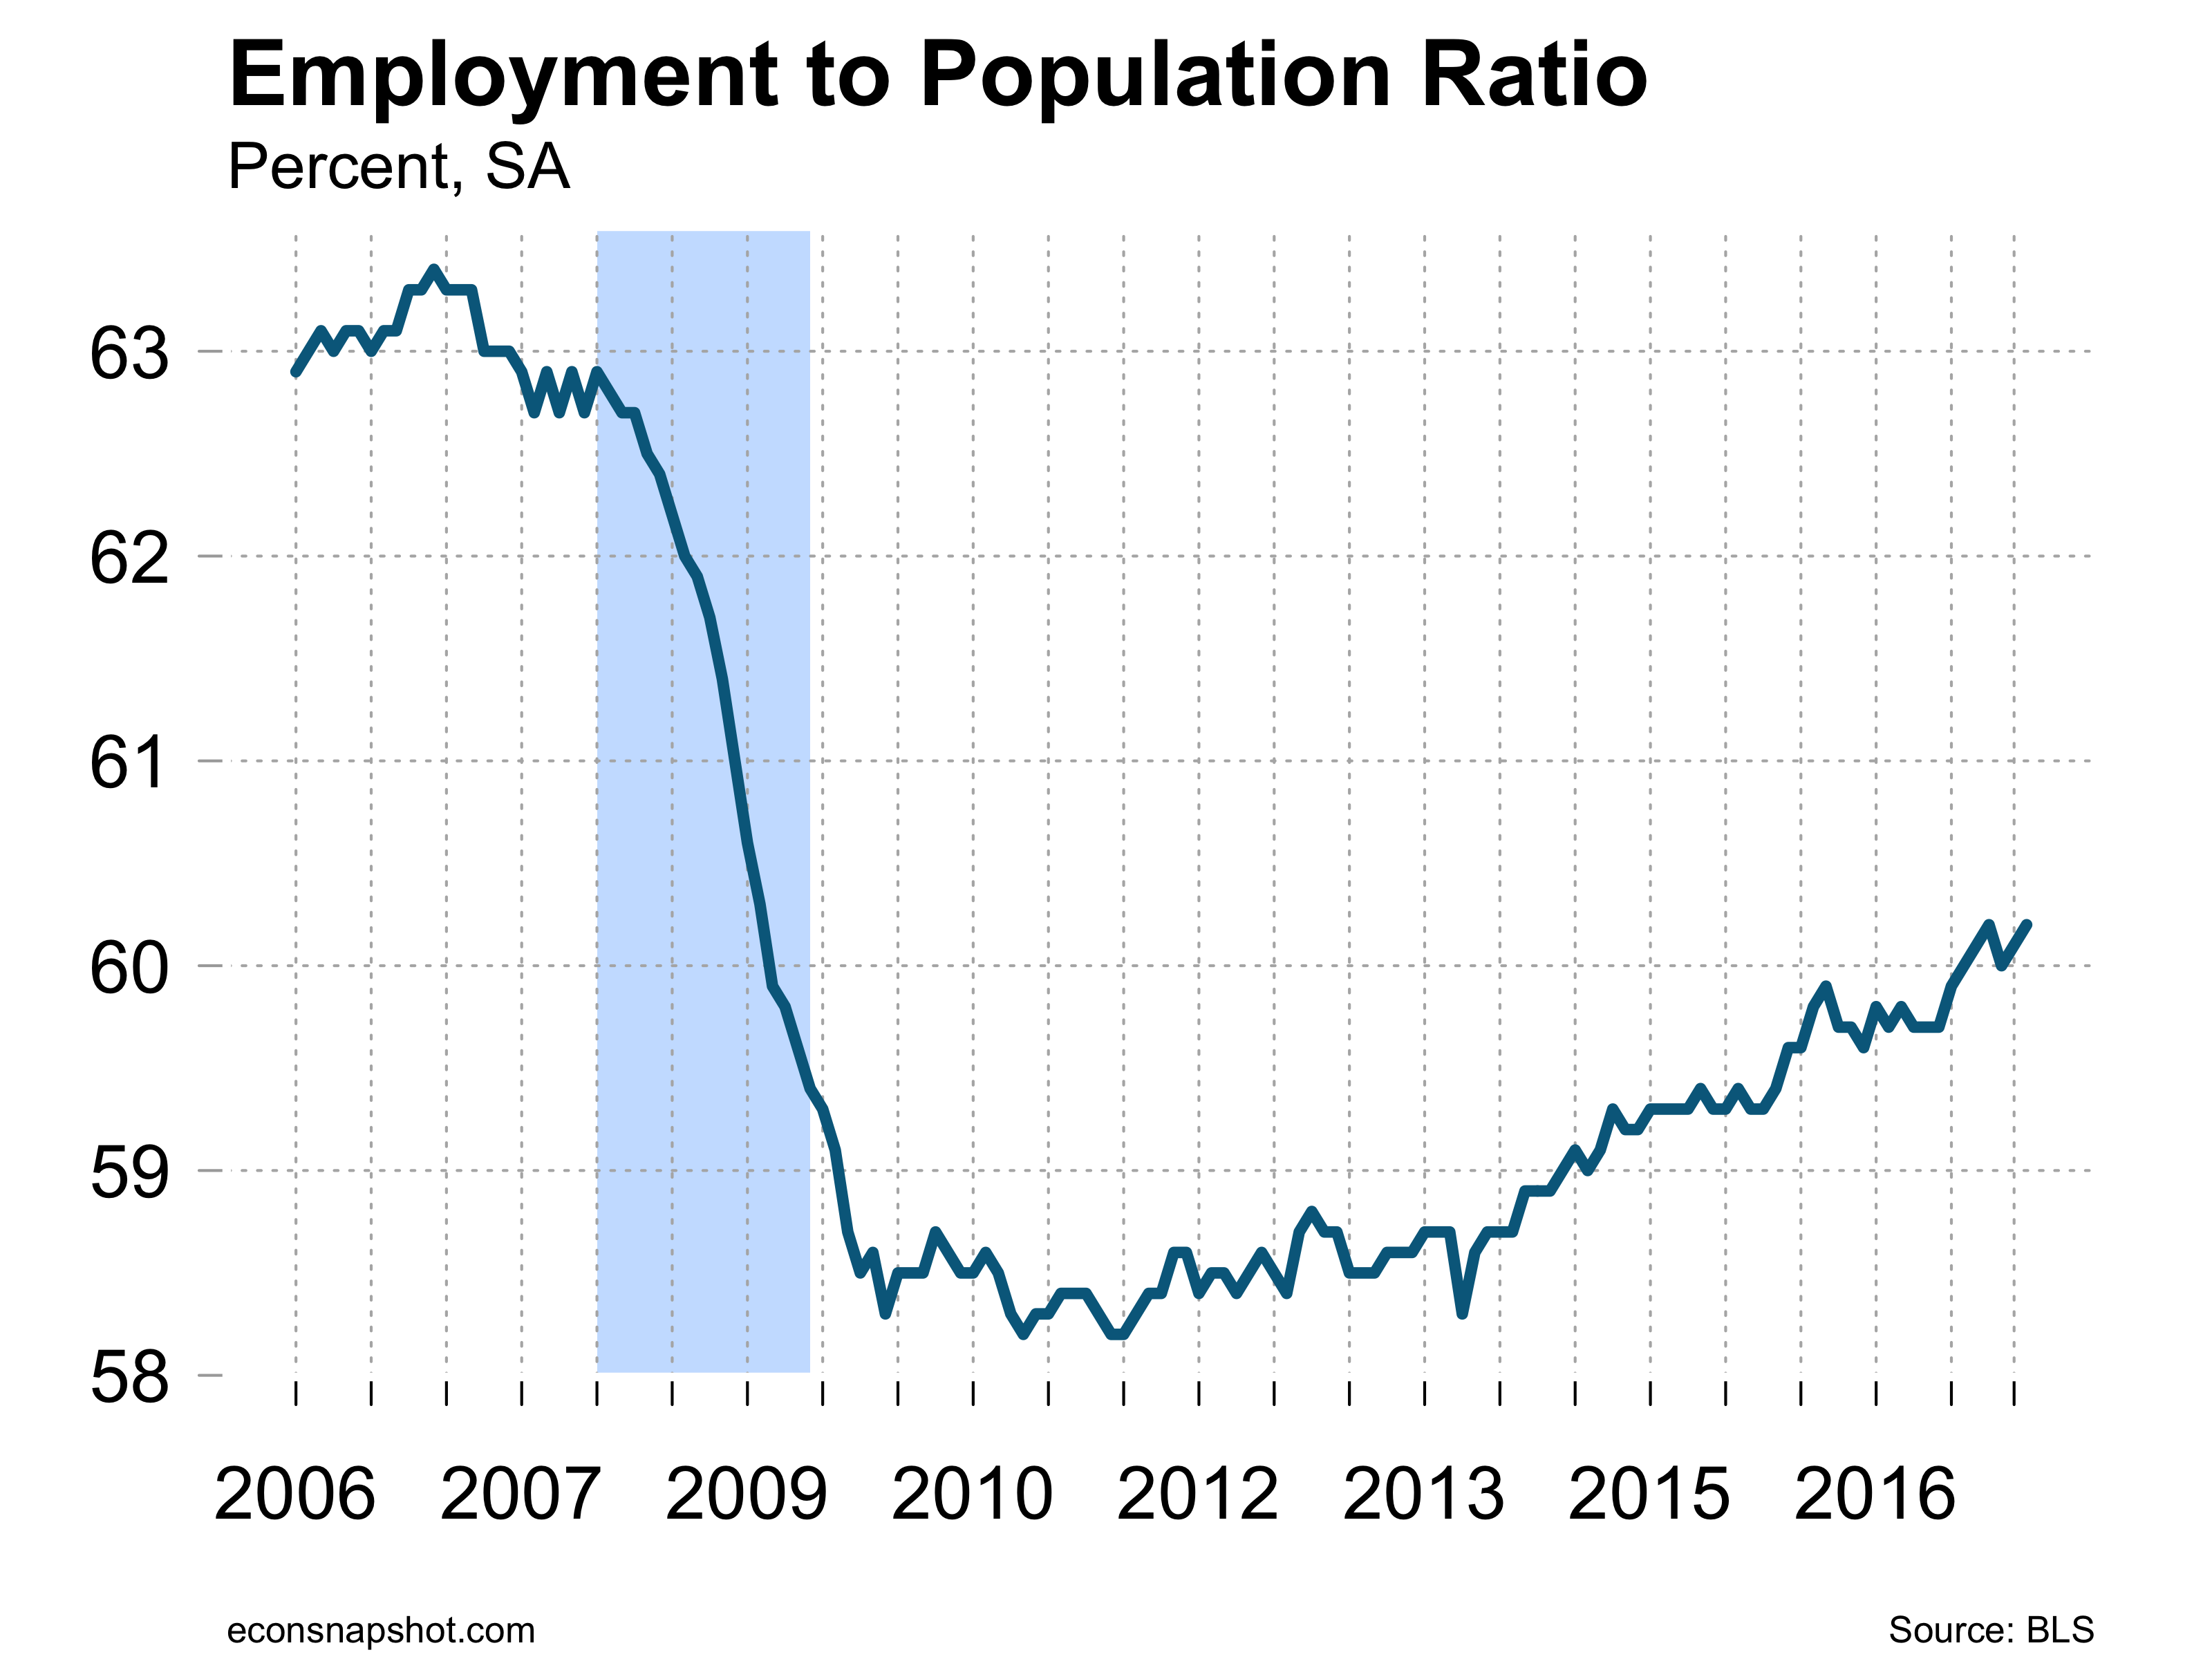
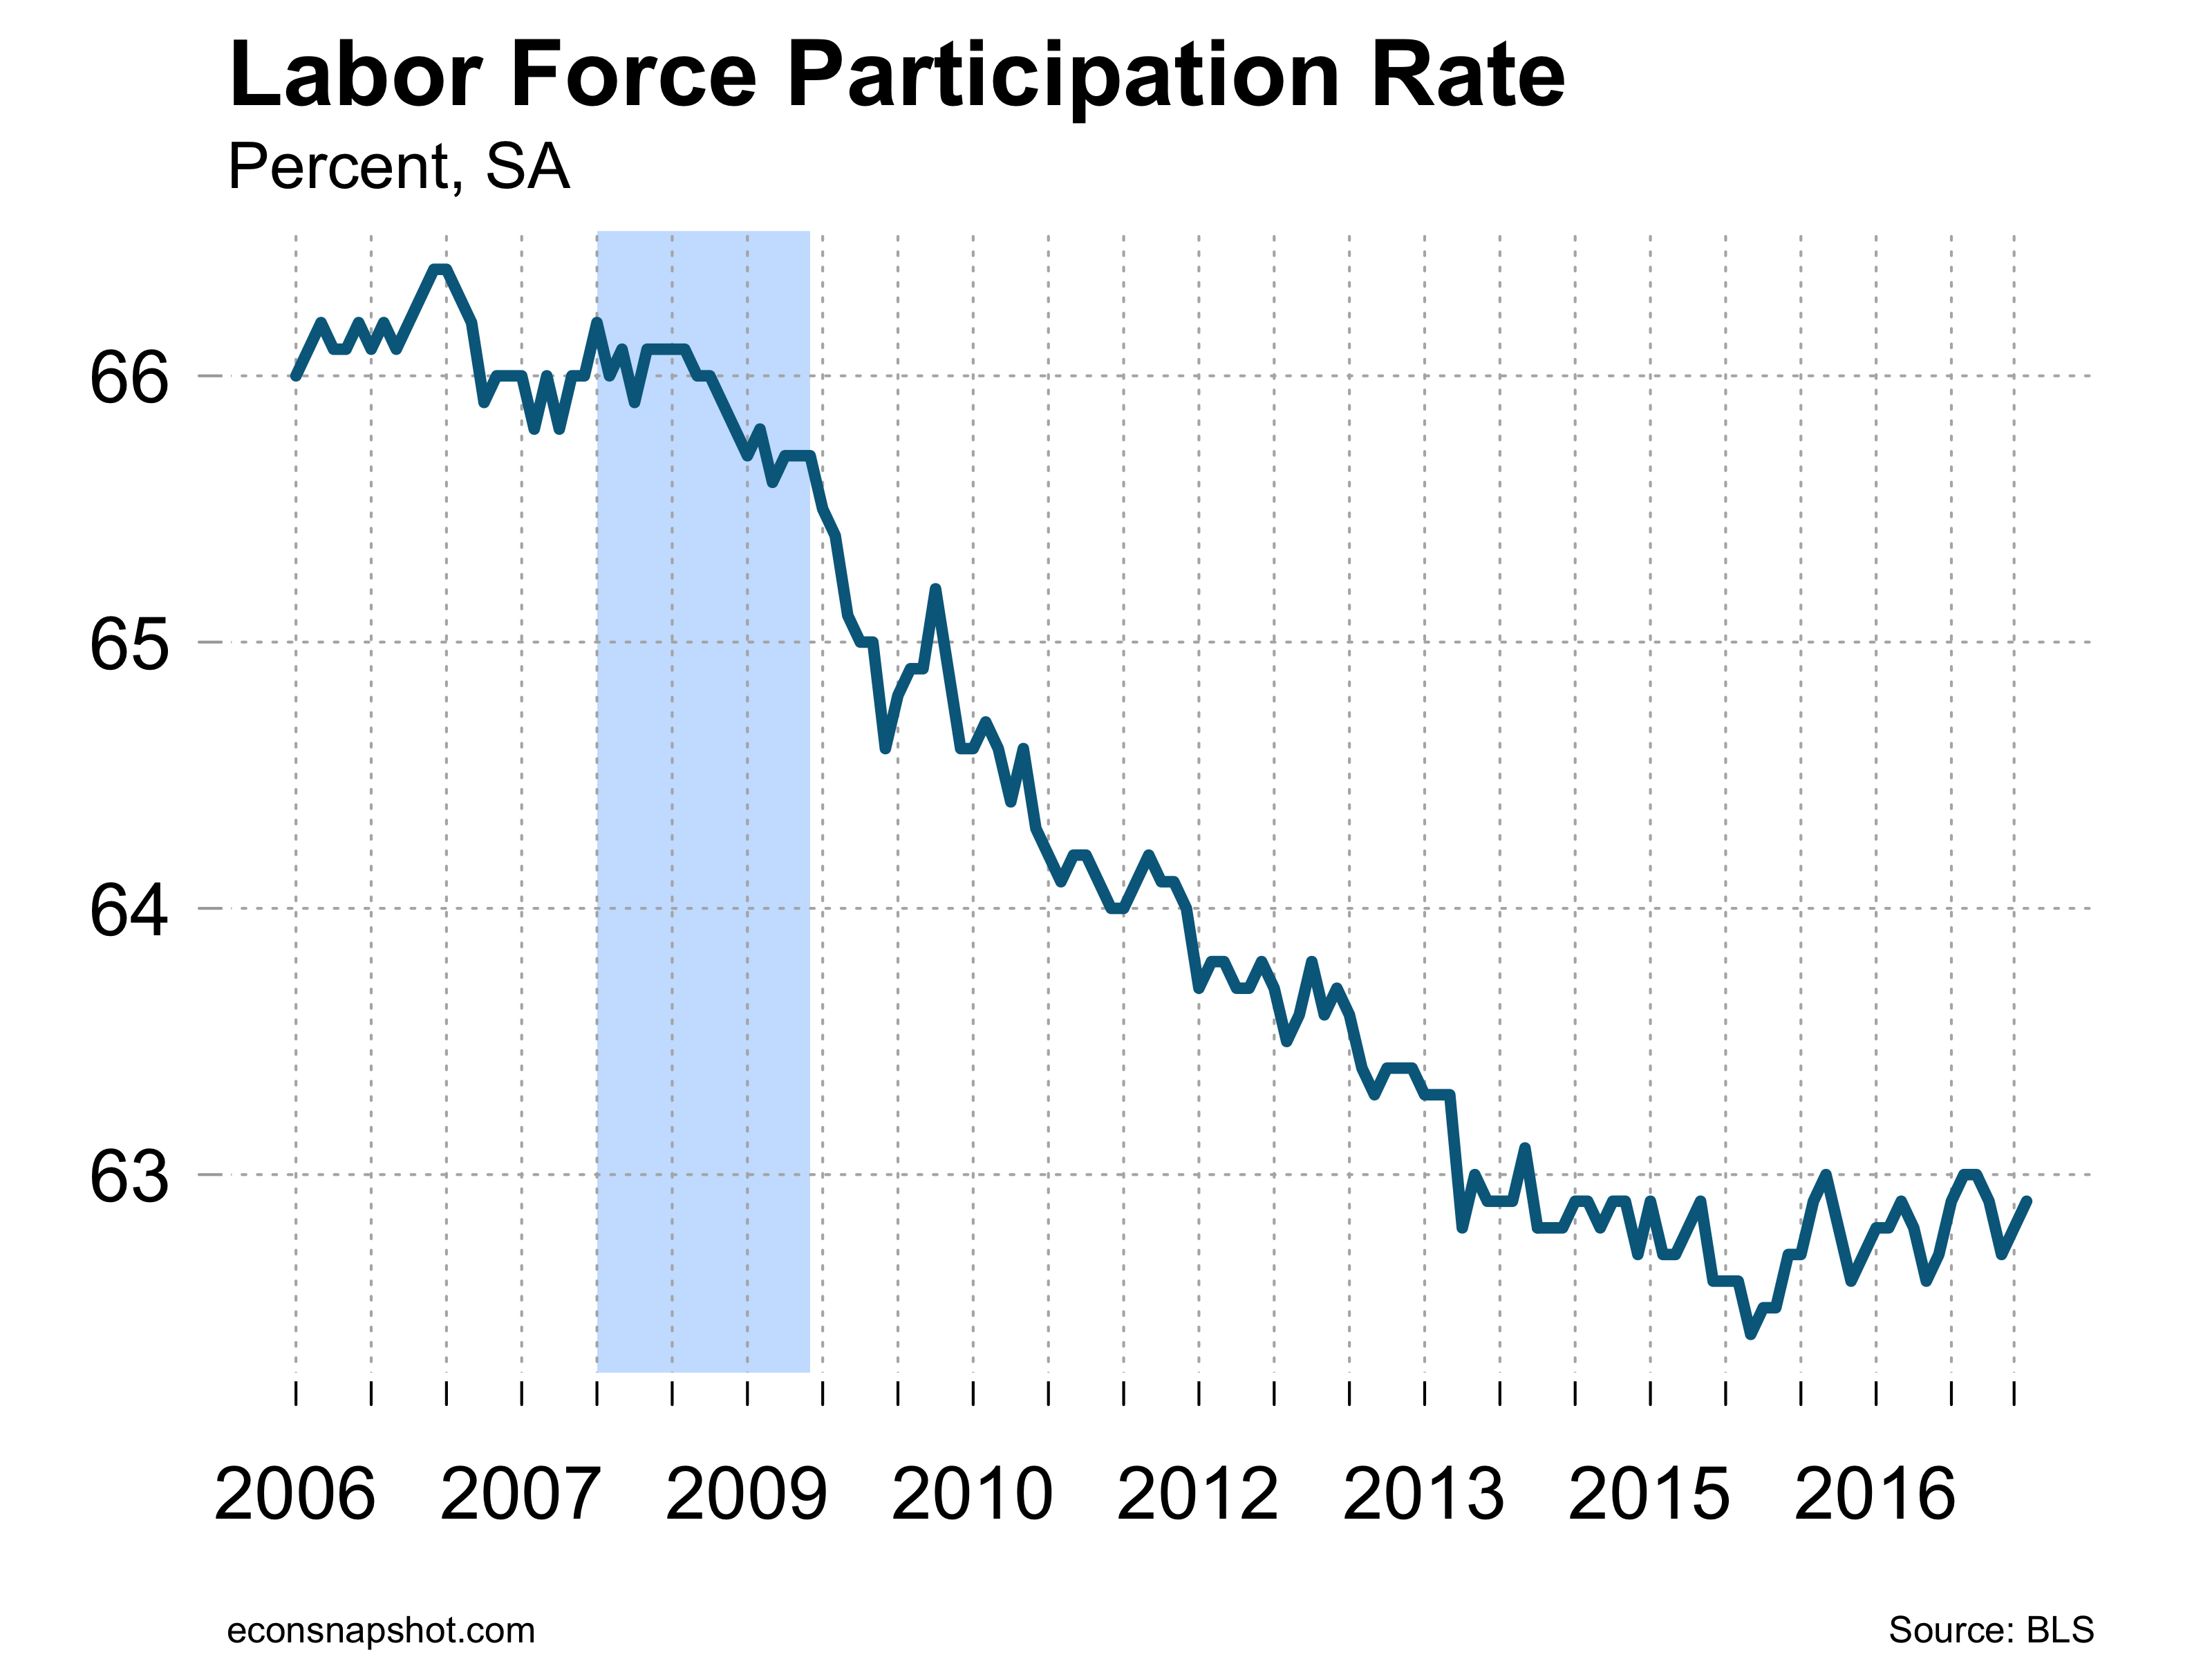
The decline in payroll employment seems to be a little misleading due to the disruptions from the hurricanes. The household survey looks much more positive. The labor force participation rate was up from 62.9 to 63.1. The employment to population ratio was also up, from 60.1 to 60.4. The number of unemployed fell by 331,000 and the unemployment rate fell from 4.44% to 4.22%.

lfp-2017-10-06

epr-2017-10-06

unemploy-2017-10-06

uu6rate-2017-10-06

While the “headline” employment decline shows up first in most reports, a deeper look shows continued strength in the labor market. The coming months are likely to show a bounce back from the hurricane’s effects and a stimulus as rebuilding gets underway.


Q2 GDP: 3.1% in 3rd estimate

By Thomas Cooley and Peter Rupert

The BEA released the 3rd estimate for Q2 real GDP and hiked it from 3% in the 2nd estimate to 3.1% in the third. Real GDP increased 1.2% in Q1, unchanged from the previous estimate. The 3.1% increase is the largest since Q1 of 2015.


Non-residential fixed investment remained strong for the second quarter in a row, 7.2% in Q1 and 6.7% Q2. These back-to-back increases were the largest over the past three years. Residential investment, on the other hand, dropped 7.3%, the largest decline since 2011.

resnonres-2017-09-28


Hurricane Harvey created a lot of uncertainty for the future. On the one hand it foretells a big short term hit to local GDP from lost economic activity and the hit to the oil and gas sector. Hurricanes Irma and Maria will not show up strongly in GDP except insofar as they affected Florida and the U.S. mainland. This is because the GDP from Puerto Rico and the U.S. Virgin Islands does not enter into calculations of U.S. Domestic GDP. Government expenditures on relief will show up.


August employment stalls

By Thomas Cooley and Peter Rupert

The Bureau of Labor Statistics reports employment increased 156,000 in August along with 41,000 in downward revisions over the past two months. The overall picture, highlighted by the continued use of “little changed” by the BLS:

“and the unemployment rate was little changed at 4.4 percent”,

“Among the major worker groups, the unemployment rates for adult men (4.1 percent), adult women (4.0 percent), teenagers (13.6 percent), Whites (3.9 percent), Blacks (7.7 percent), Asians (4.0 percent), and Hispanics (5.2 percent) showed little or no change in August. (See tables A-1, A-2, and A-3.)”

“The number of long-term unemployed (those jobless for 27 weeks or more) was essentially unchanged in August at 1.7 million and accounted for 24.7 percent of the unemployed. (See table A-12.)”

“The labor force participation rate, at 62.9 percent, was unchanged in August and has shown little movement on net over the past year. The employment-population ratio, at 60.1 percent, was little changed over the month and thus far this year. (See
table A-1.)”

Declines in employment were seen in information services and government. Average hours of work fell slightly from 35.4 to 34.4.

empchgm-2017-09-01

uu6rate-2017-09-01

The employment to population ratio has been inching up since 2014 while he labor force participation rate has hovered around 62.9.

epr-2017-09-01

lfp-2017-09-01

avghours-2017-09-01


ahecpi-2017-09-01


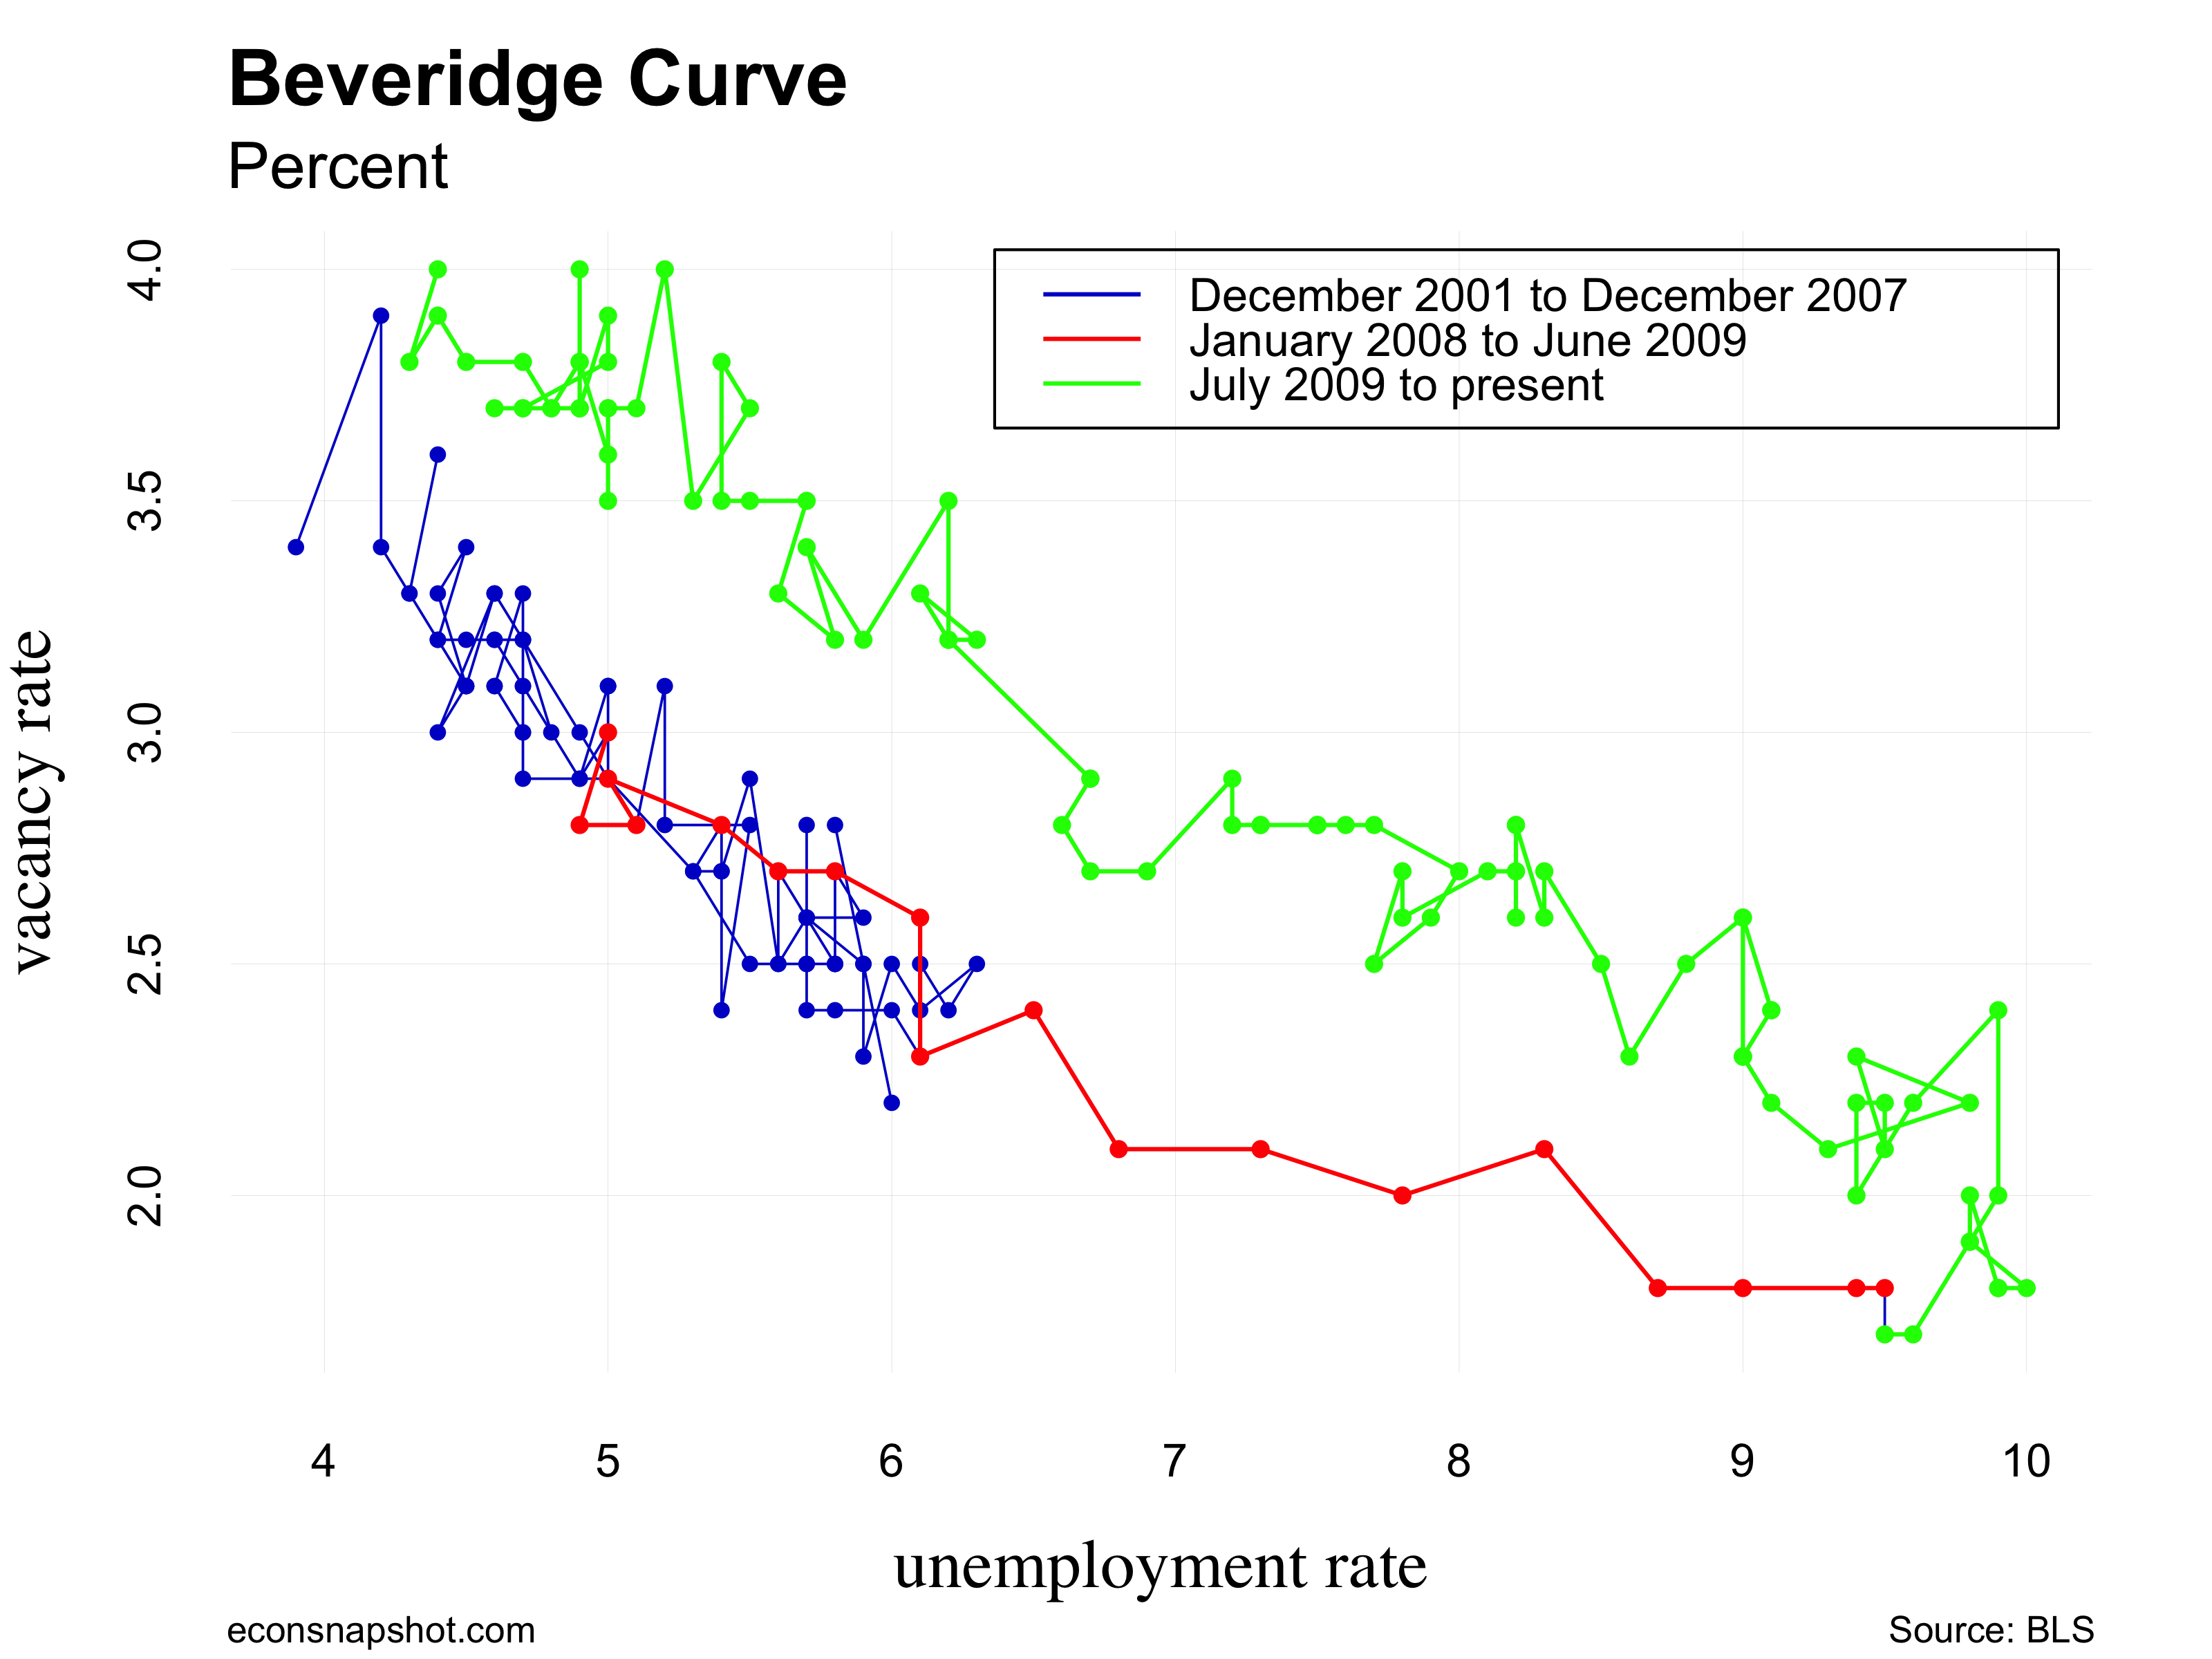
The matching of workers to vacancies, as indicated by the Beveridge Curve, after moving counter-clockwise over the cycle shows a slightly elevated vacancy rate as compared to unemployment.

beveridge-2017-09-01

The weakness from this August report likely gives some pause for the policy moving forward. Nevertheless, it is still a strong labor market with low unemployment rates and  healthy vacancies. The same puzzles that presented themselves in prior months persist – low participation rates and low wage growth. Healthy GDP growth has not translated into gains for most workers.

Q2 GDP: 3.0% in 2nd estimate

By Thomas Cooley and Peter Rupert

The BEA released the 2nd estimate for Q2 real GDP and hiked it from 2.6% in the “advance” estimate to 3.0%. Real GDP increased 1.2% in Q1. The 3.0% increase is the largest since Q1 of 2015. The boost from the advance to the 2nd estimate came largely from PCE (up 3.3%) and non-residential fixed investment (up 6.9%) being larger than previously estimated. Residential fixed investment, however, fell 6.5%.

gdprealchgm1-2017-08-30

pcerealchgm1-2017-08-30

resnonres-2017-08-30

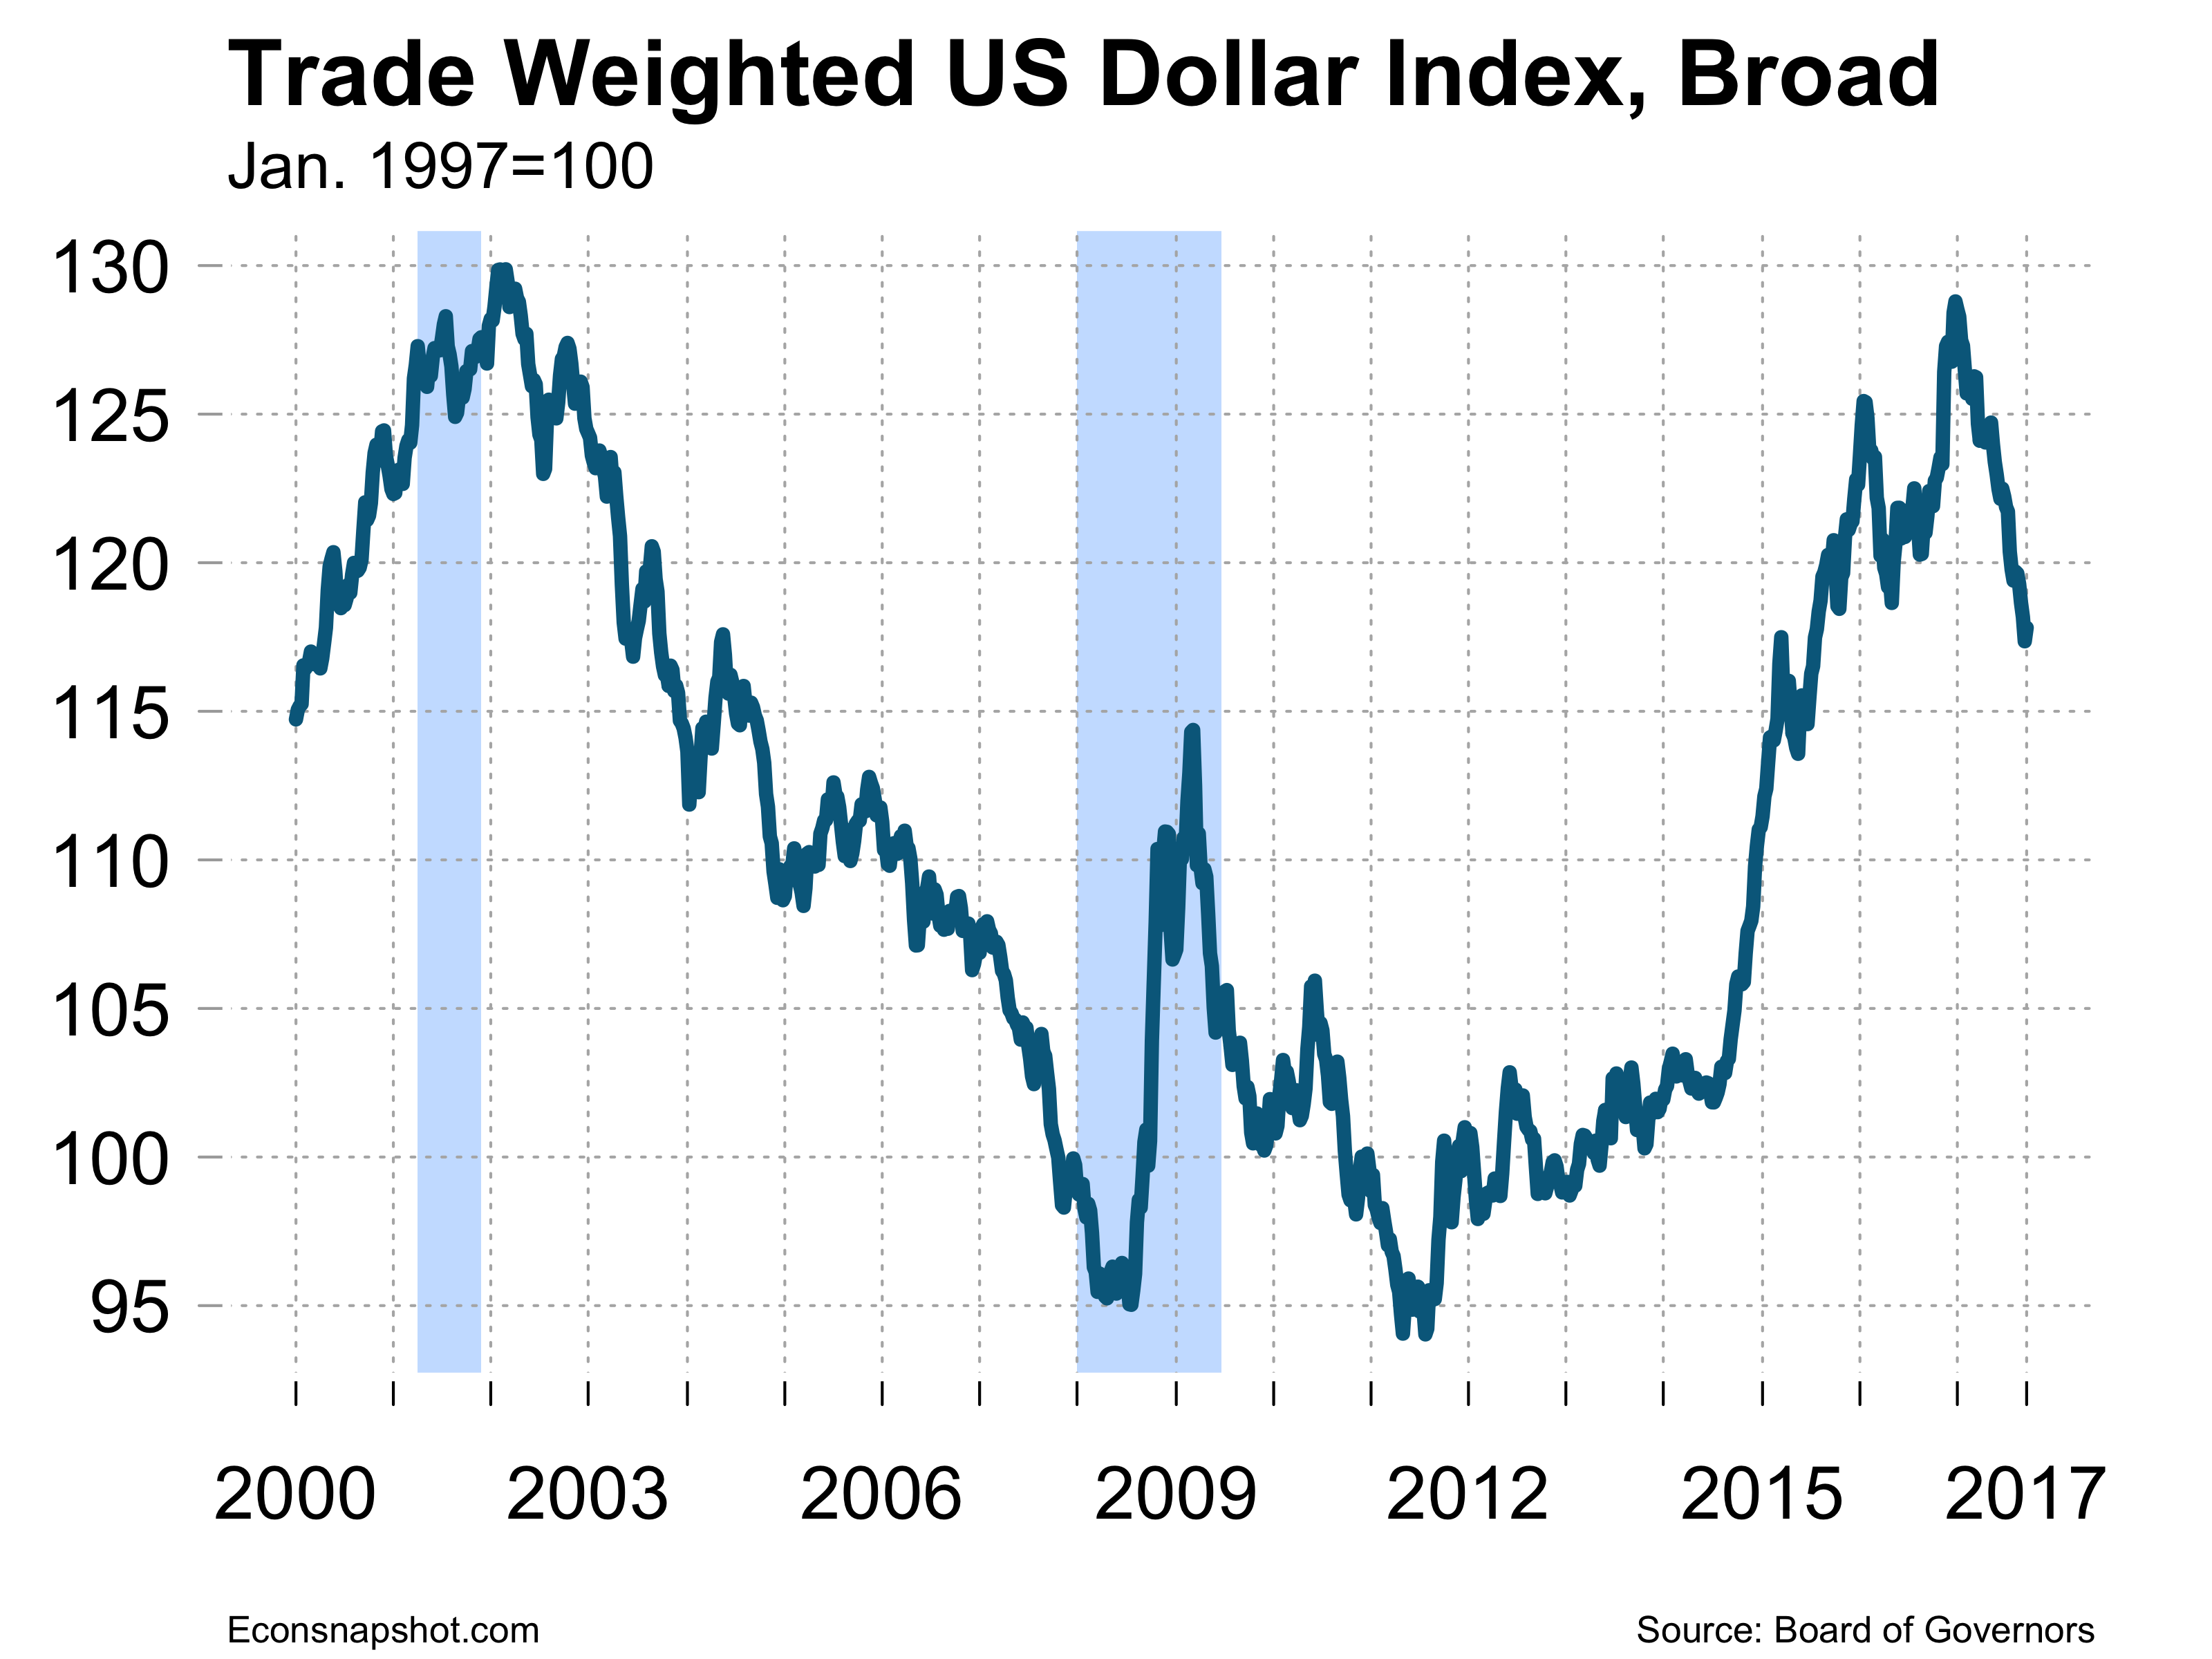
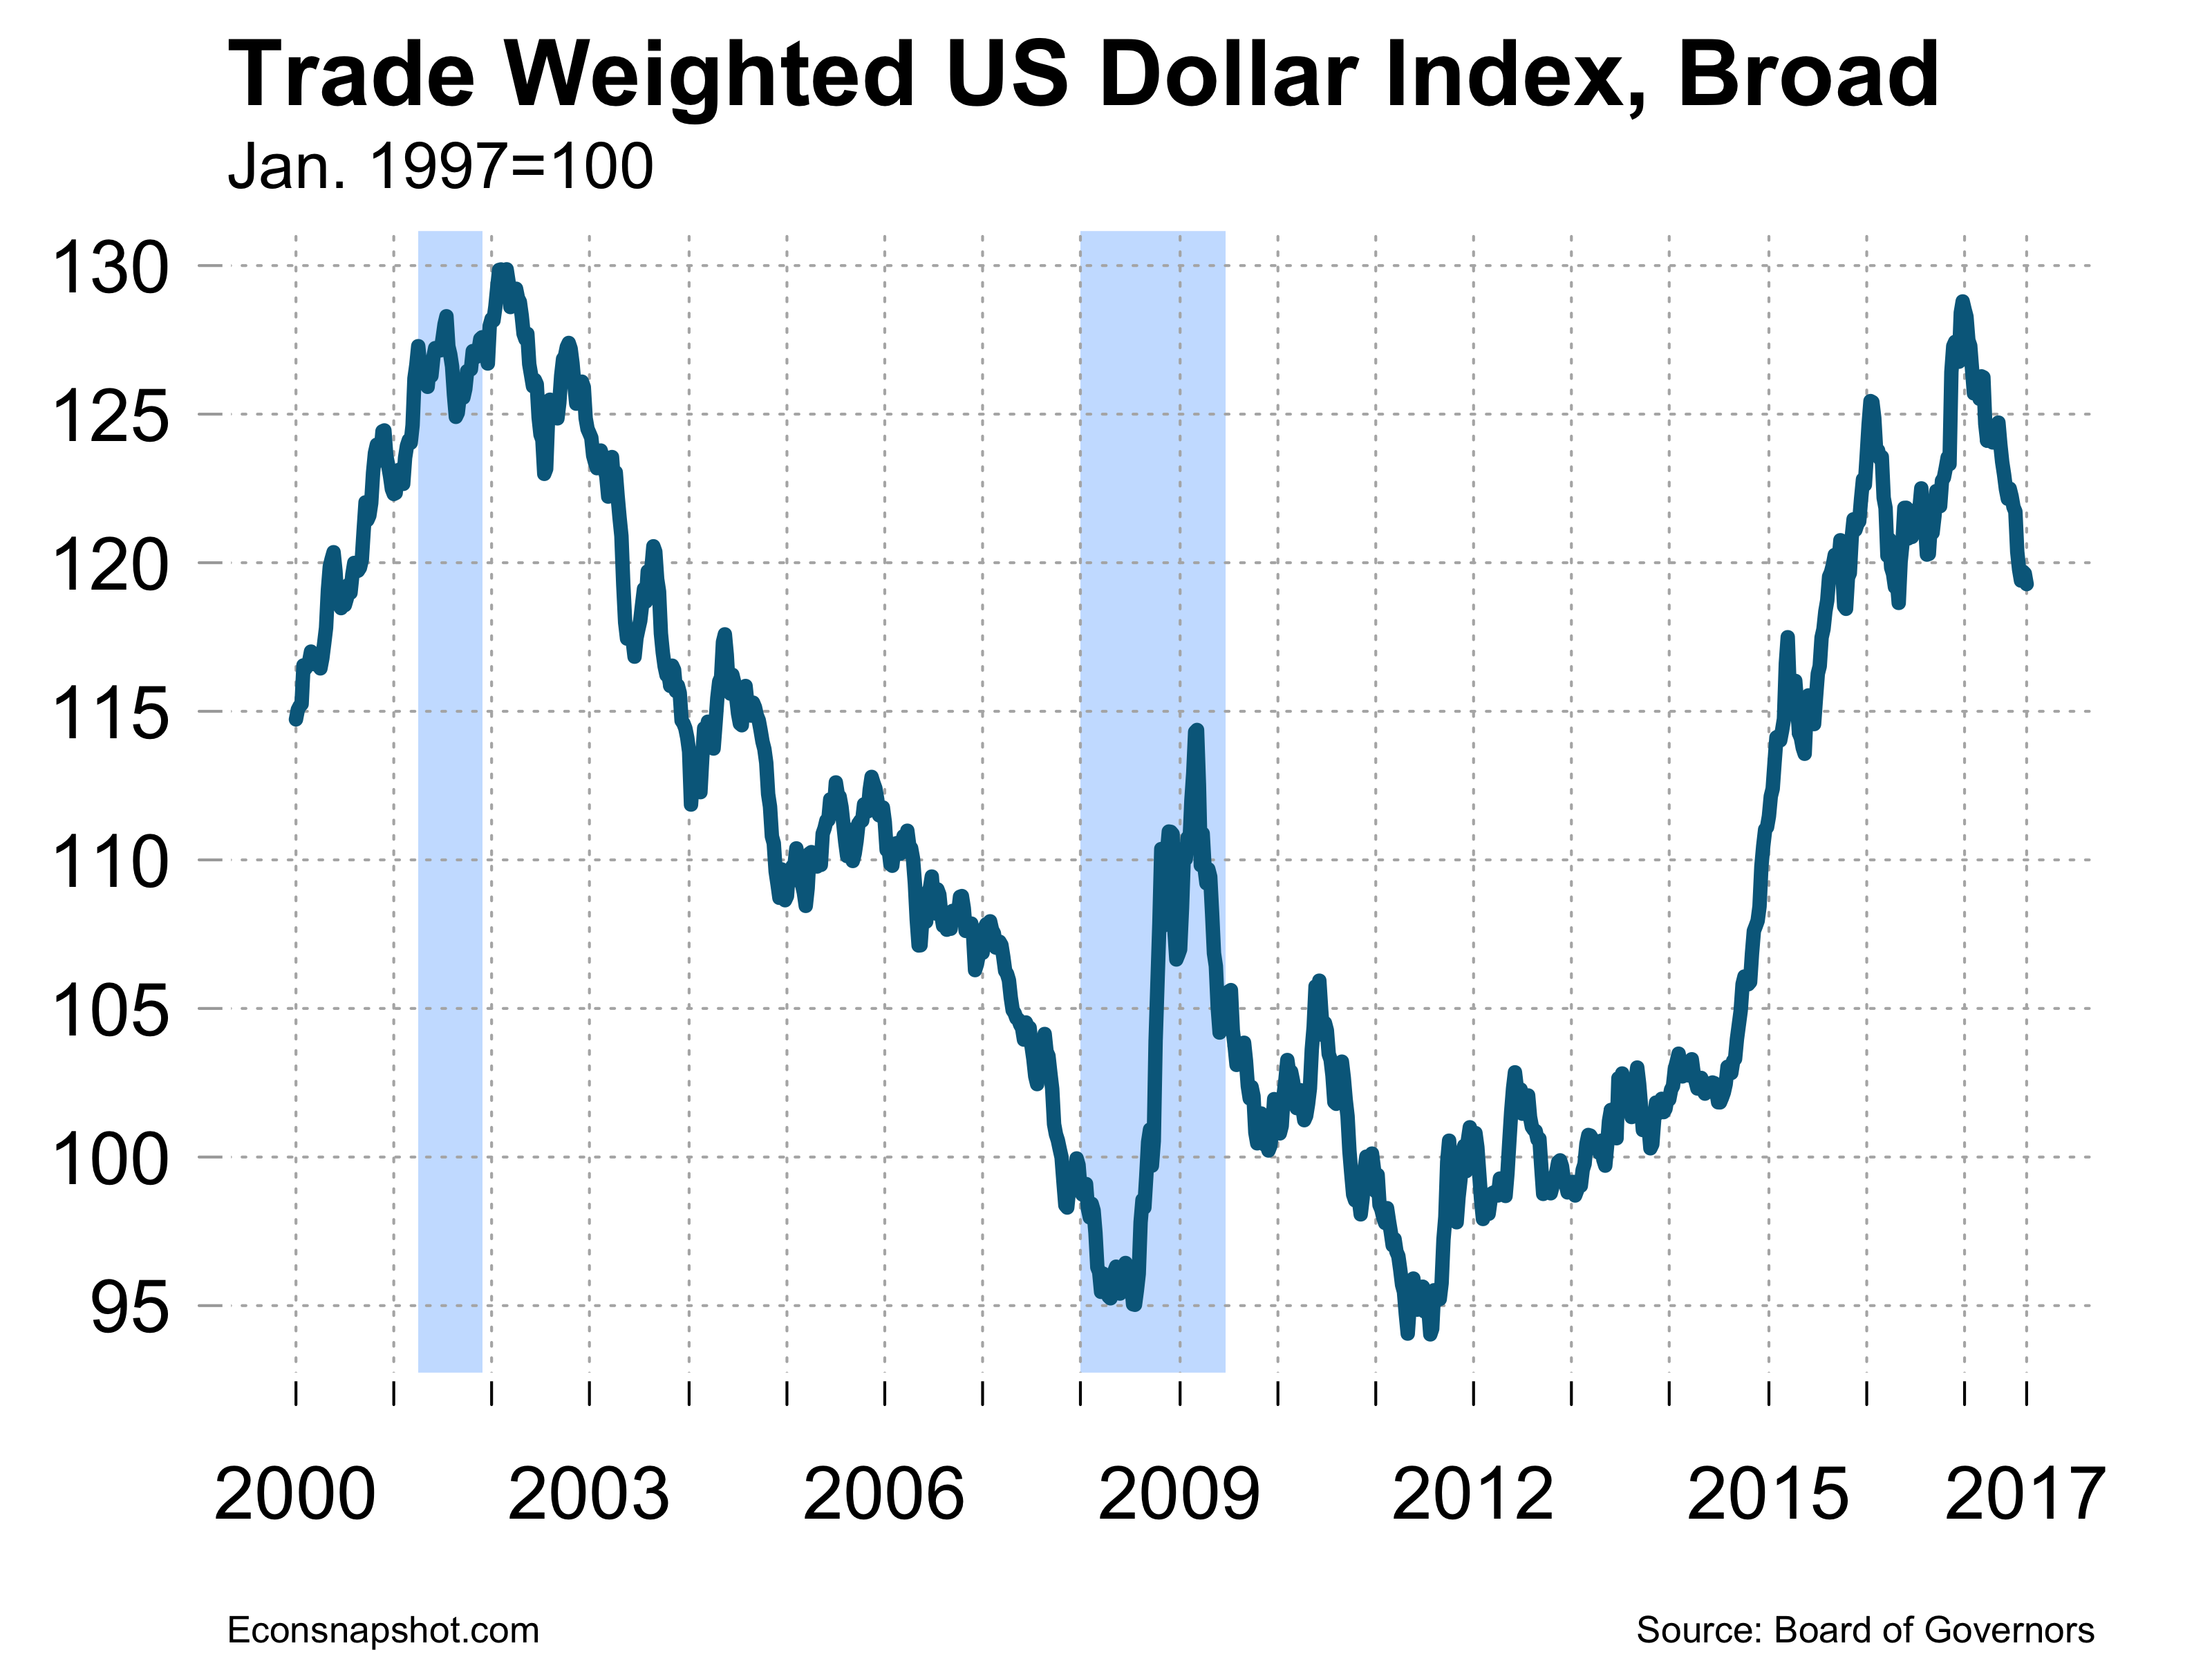
The strong growth in consumption occurred despite continued slow growth in wages and incomes. The rise in equity prices and the strong labor market have increased optimism that fueled more consumption. In fact the Conference Board reported an increase in consumer confidence that is hovering around a 16 year high. Investment growth is driven by a period of strong corporate profits. The US dollar continues to decline against a broad set of currencies, down about 7% since the beginning of the year and the Euro has also gained strength this year, up about 12%, despite increases in interest rates. This may stimulate future export growth which would keep the economy going strong.

trade-weighted-index-2017-08-30

Hurricane Harvey creates a lot of uncertainty for the future. On the one hand it foretells a big short term hit to local GDP from lost economic activity and the hit to the oil and gas sector. This will be balanced against future stimulus from the massive recovery effort. Evidence from prior national disasters – specifically Hurricane Sandy disrupted New York and Hurricane Katrina that devastated New Orleans – showed big short term impacts on the local economies but not a noticeable impact on aggregate GDP.  It seems that it shouldn’t affect forecasts of Q3 and Q4 growth very much.


July Employment Stays Warm

By Thomas Cooley and Peter Rupert

The establishment survey from the BLS showed payroll employment up 209,000 in July. The revised increase, up 9,000, in payroll employment in June was 231,000. Private sector employment was almost solely responsible for the increase as government employment was up only 4,000.  The labor market is continuing to add jobs at a healthy rate in spite of the length of the expansion.

empchgm-2017-08-04


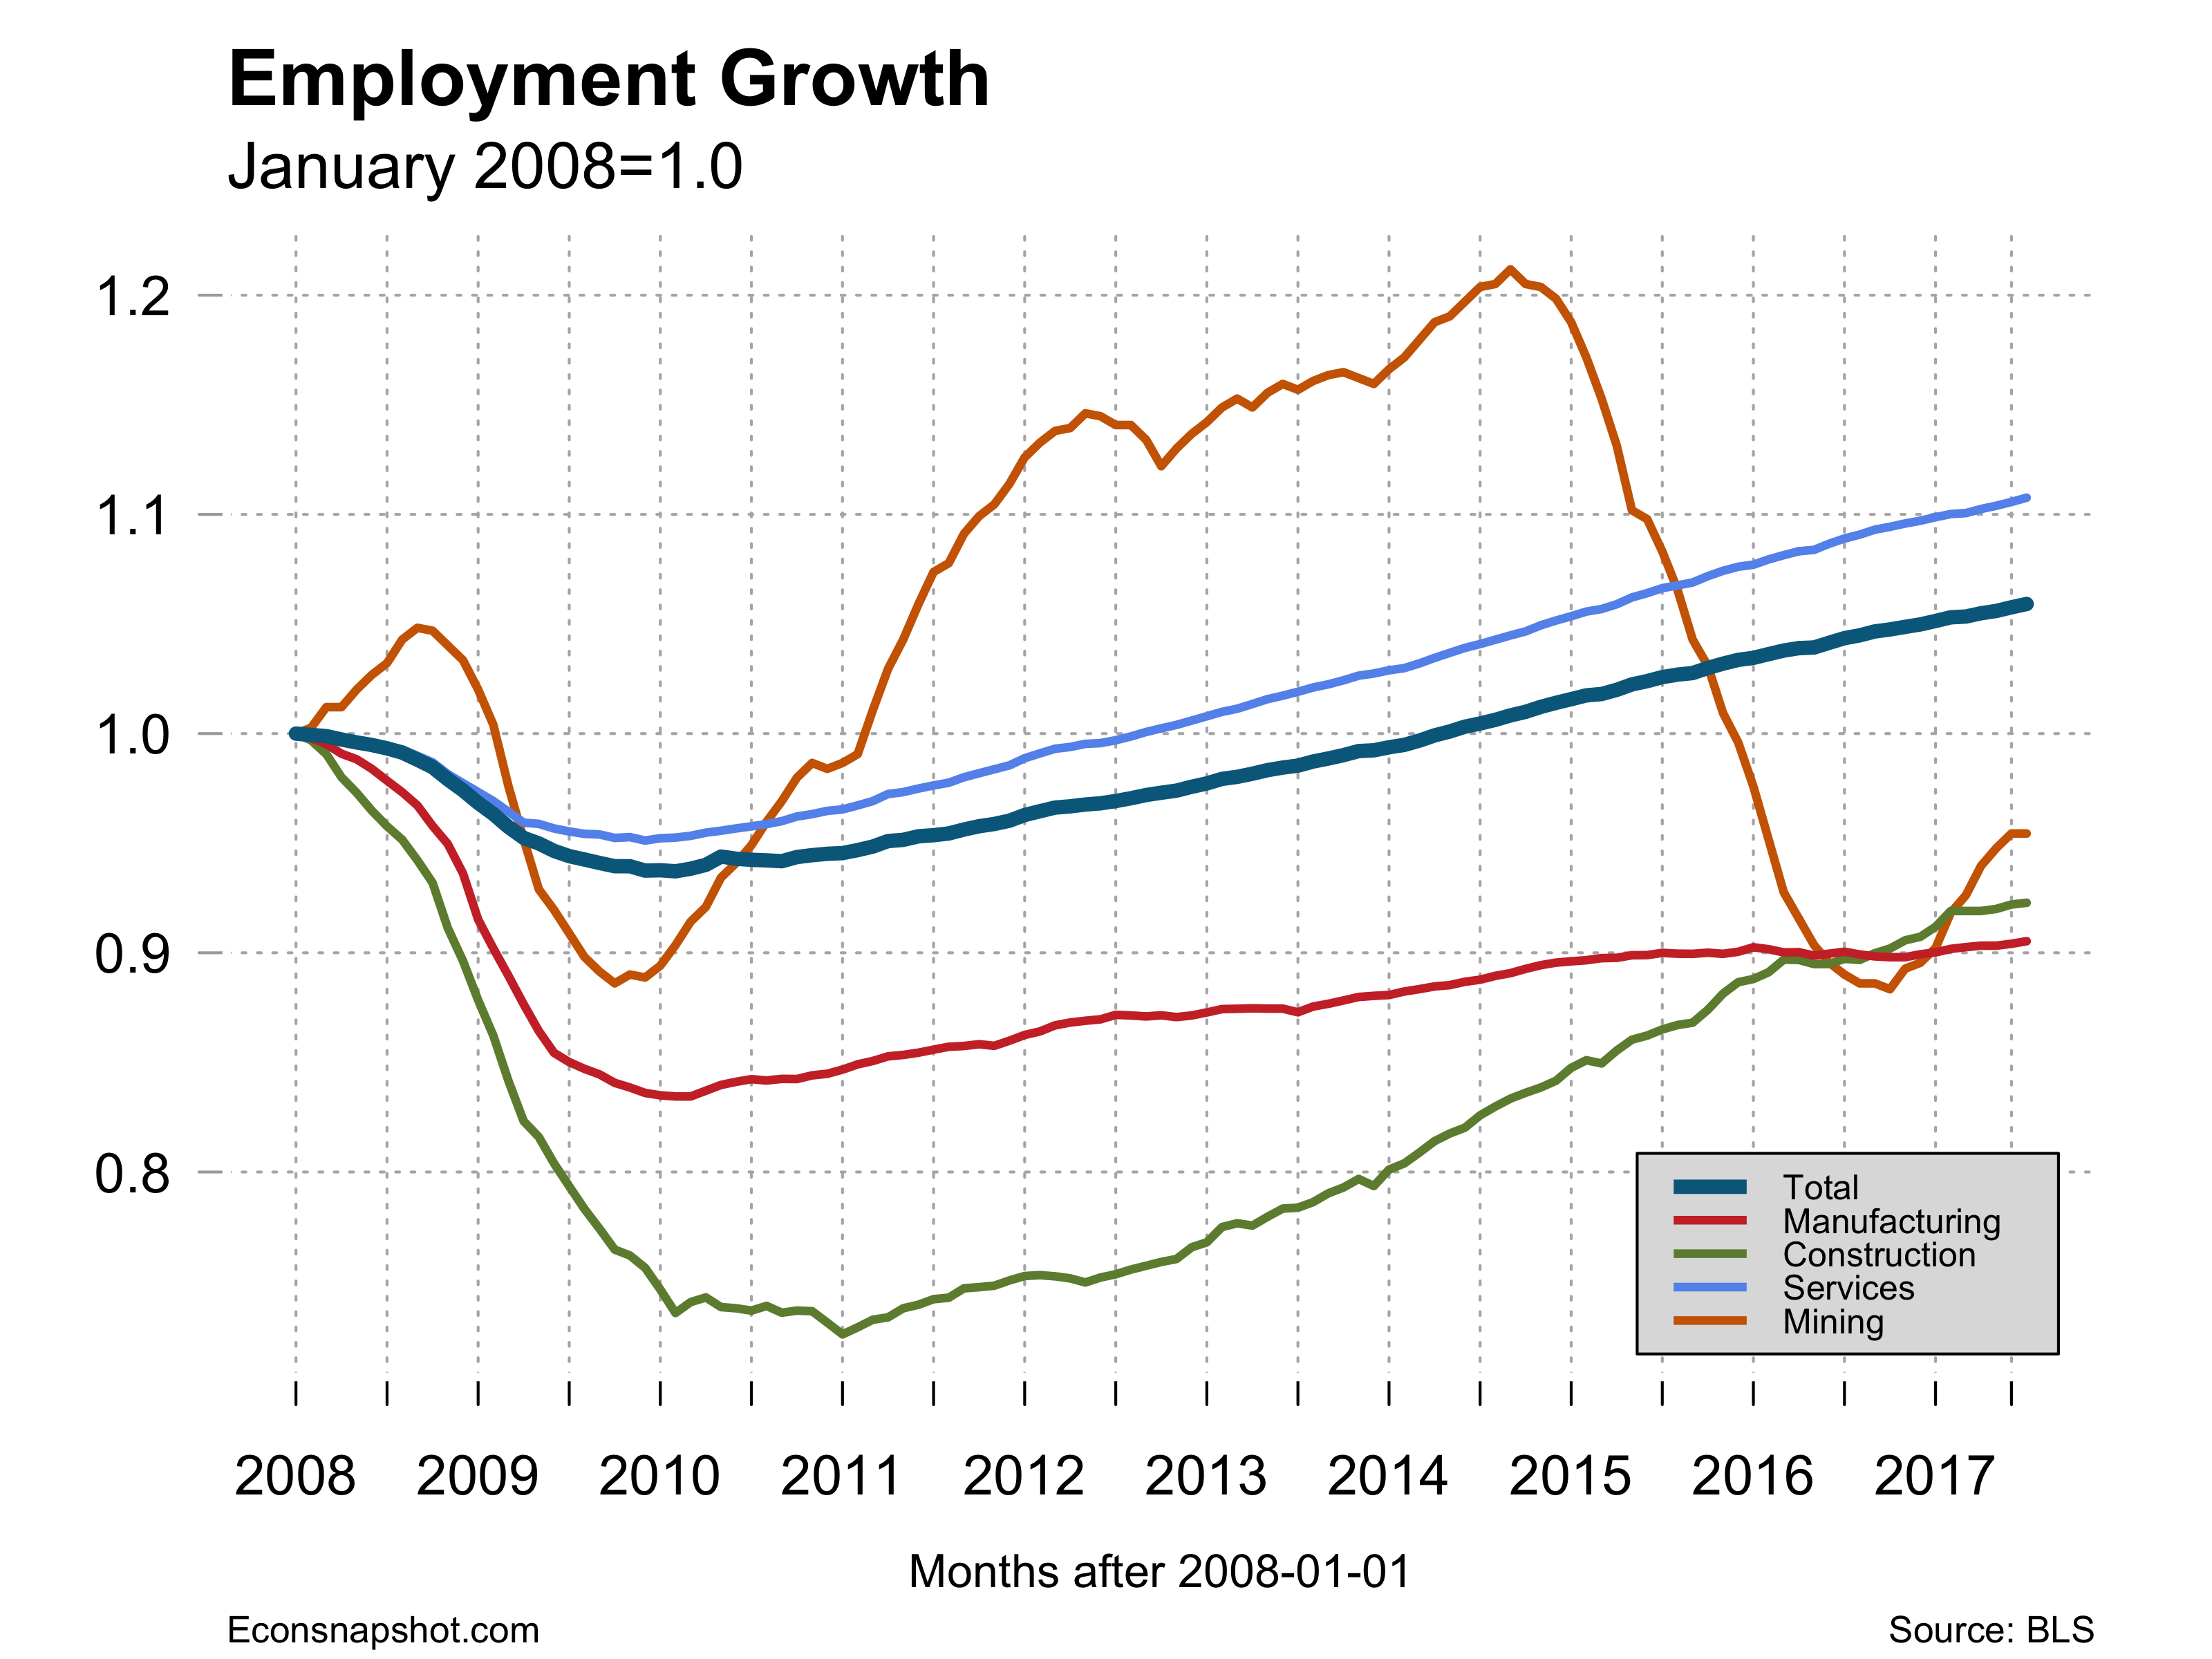
As in previous months most of the job growth is occurring in the service sector with some minor added employment in mining and construction.

Average hours of work remained at 34.5 for the second month in a row.

avghours-2017-08-04

Average hourly earnings increased 0.3% (9 cents) to $26.36 and have increased 2.5% year over year while the CPI has increased 1.6% year over year, leading to an increase in real hourly earnings. This is a good sign, but no evidence that the labor market is going to be putting upward pressure on inflation anytime soon.

ahecpi-2017-08-04

The Beveridge Curve continues to show low unemployment and a high vacancy rate, sometimes the recipe for increased wage pressure. But, in this economy, the employment to population ratio and labor force participation are still notably below their recent peaks…meaning a lot of possible workers are on the sidelines. There are two accounts for why this is so. In one, people are staying on the sidelines because of the increased value of leisure. The other, that we have emphasized, is that there is a mismatch of skills slowing down the matching in the labor market.

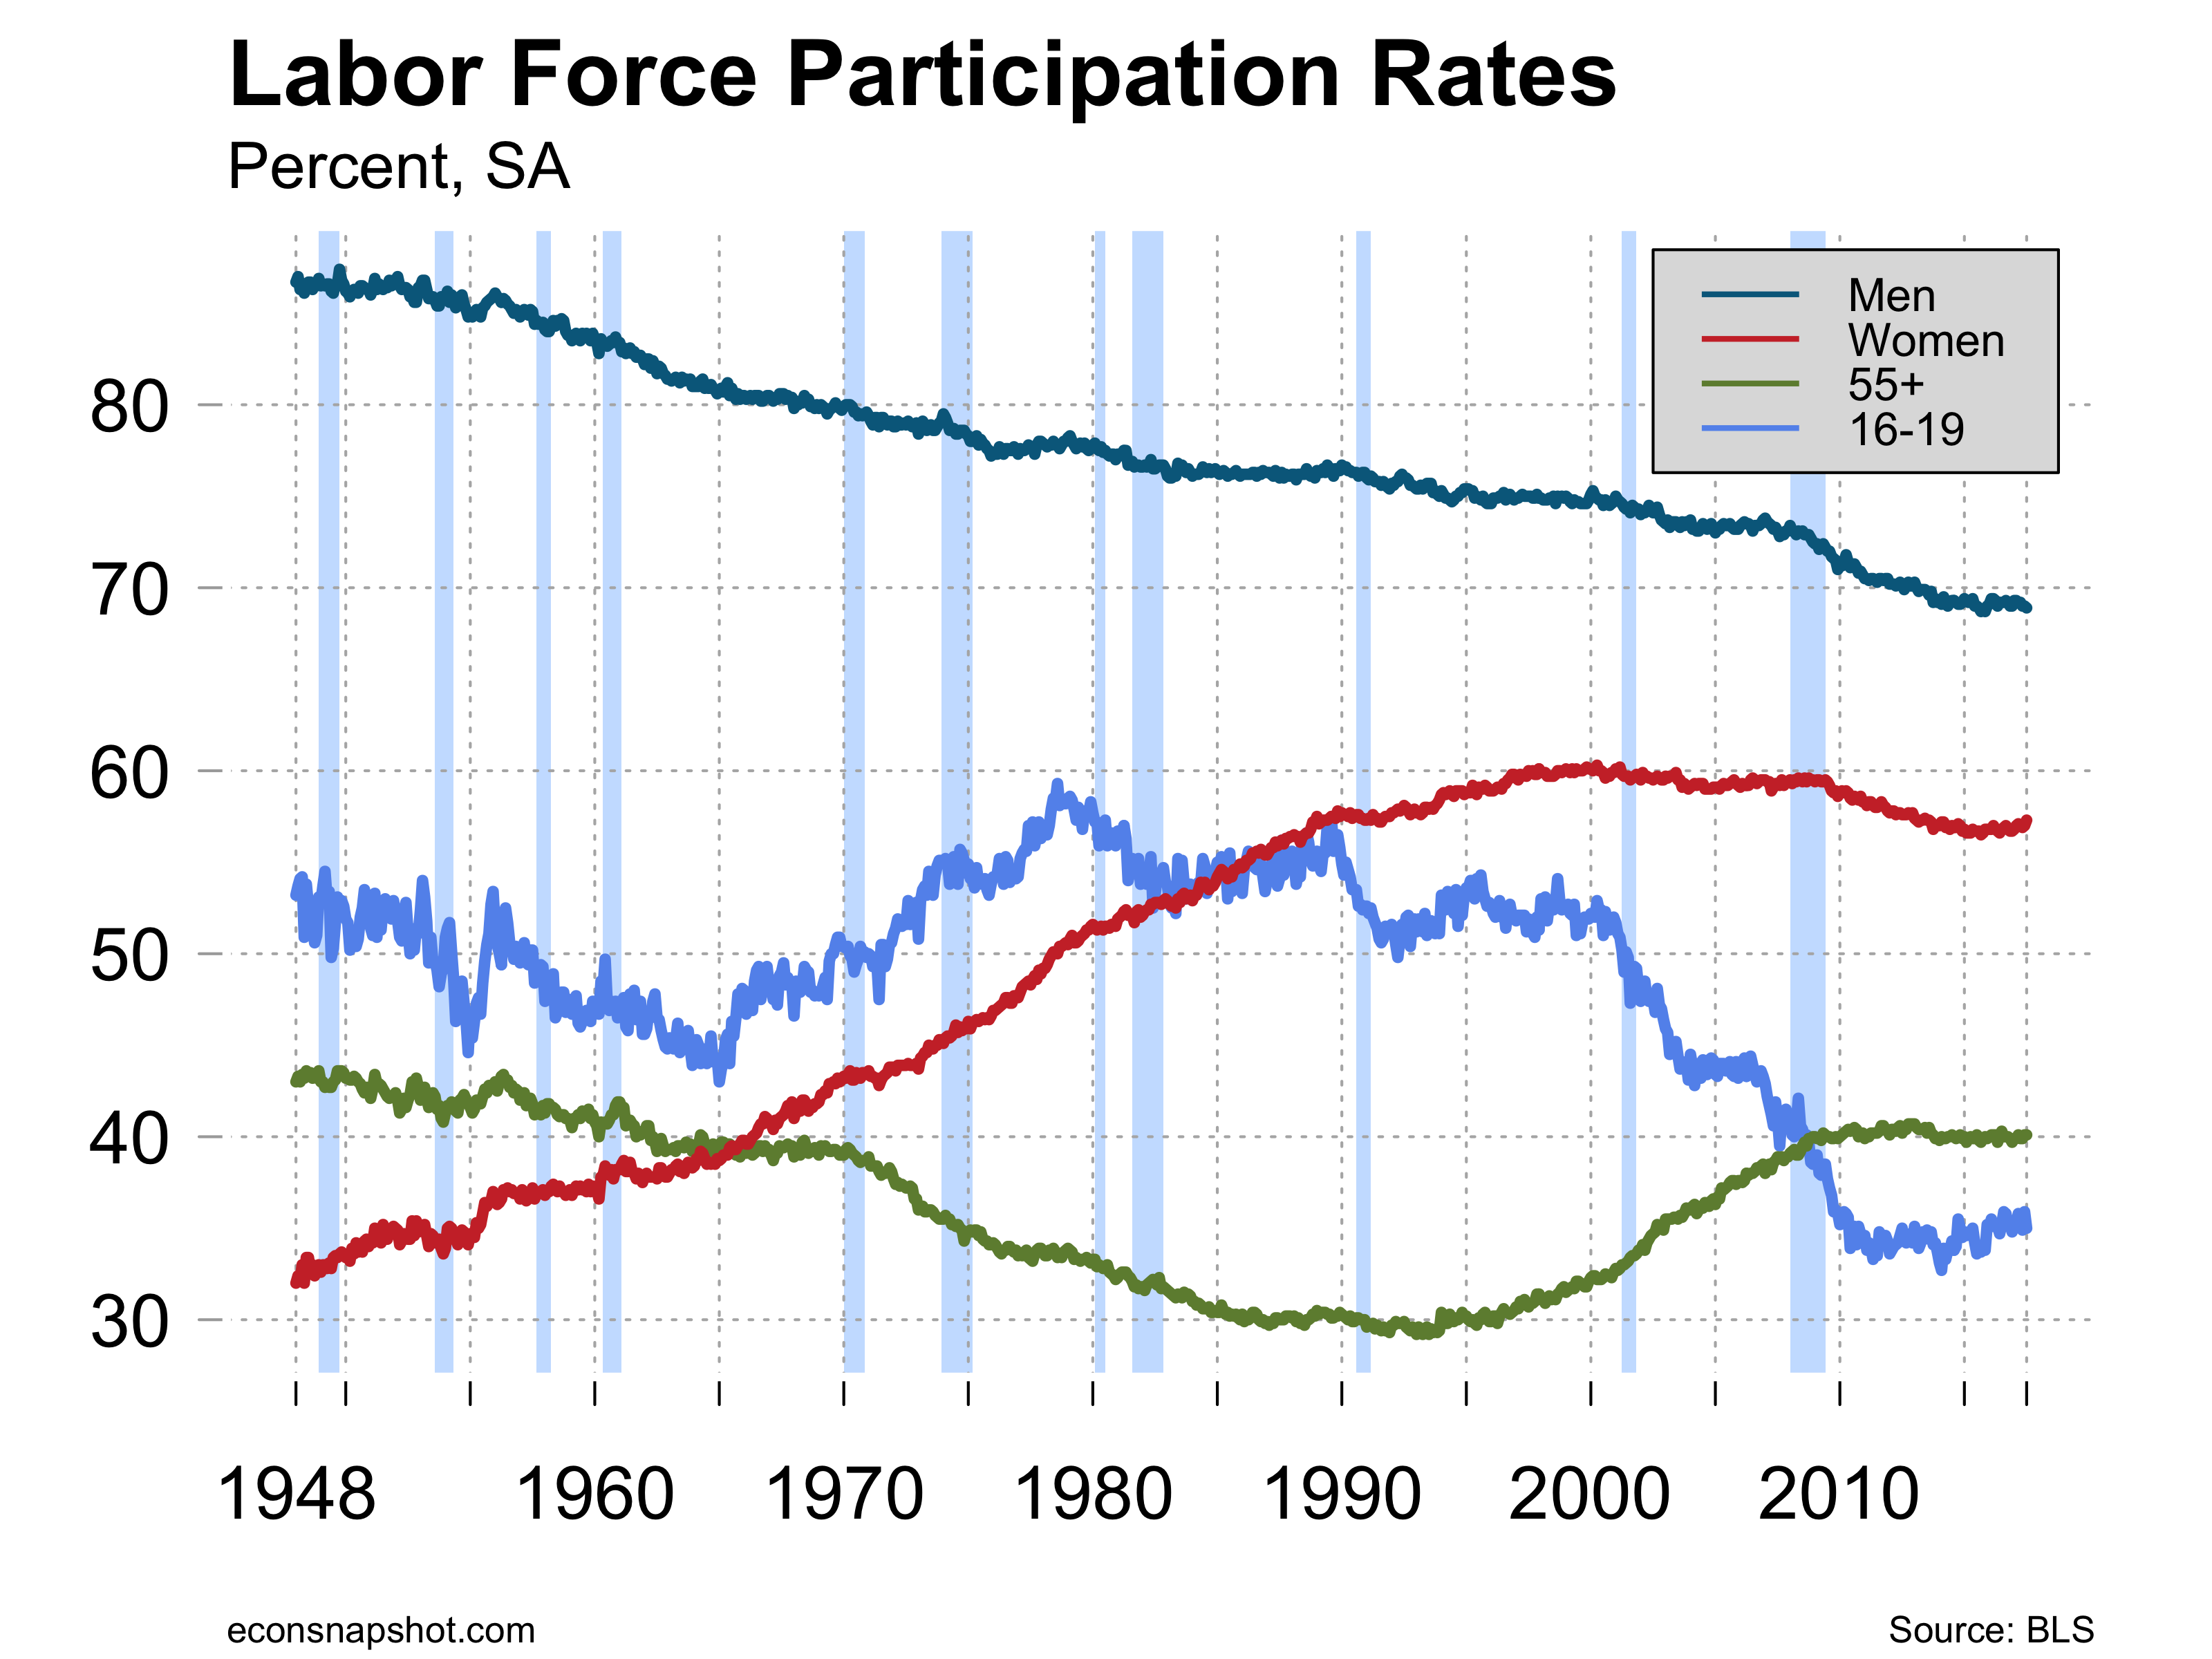
The employment to population ratio showed a modest up-tick as did labor force participation, although the labor force participation remains at a relatively low level. Moreover, trends in labor force participation are now very flat for many different types of workers and have been over the last several years. The most remarkable is that of teens, now at the lowest level since the data was recorded back in 1947.

lfp-2017-08-04

lfpsexage-2017-08-04


Q2 GDP Shows Solid Growth

By Thomas Cooley and Peter Rupert

The advance estimate for Q2 shows a 2.6% annualized growth rate for real GDP. The largest contributor to that increase was consumption, real PCE increased 2.8% on an annualized basis. gdprealchgm1-2017-07-28

pcerealchgm1-2017-07-29

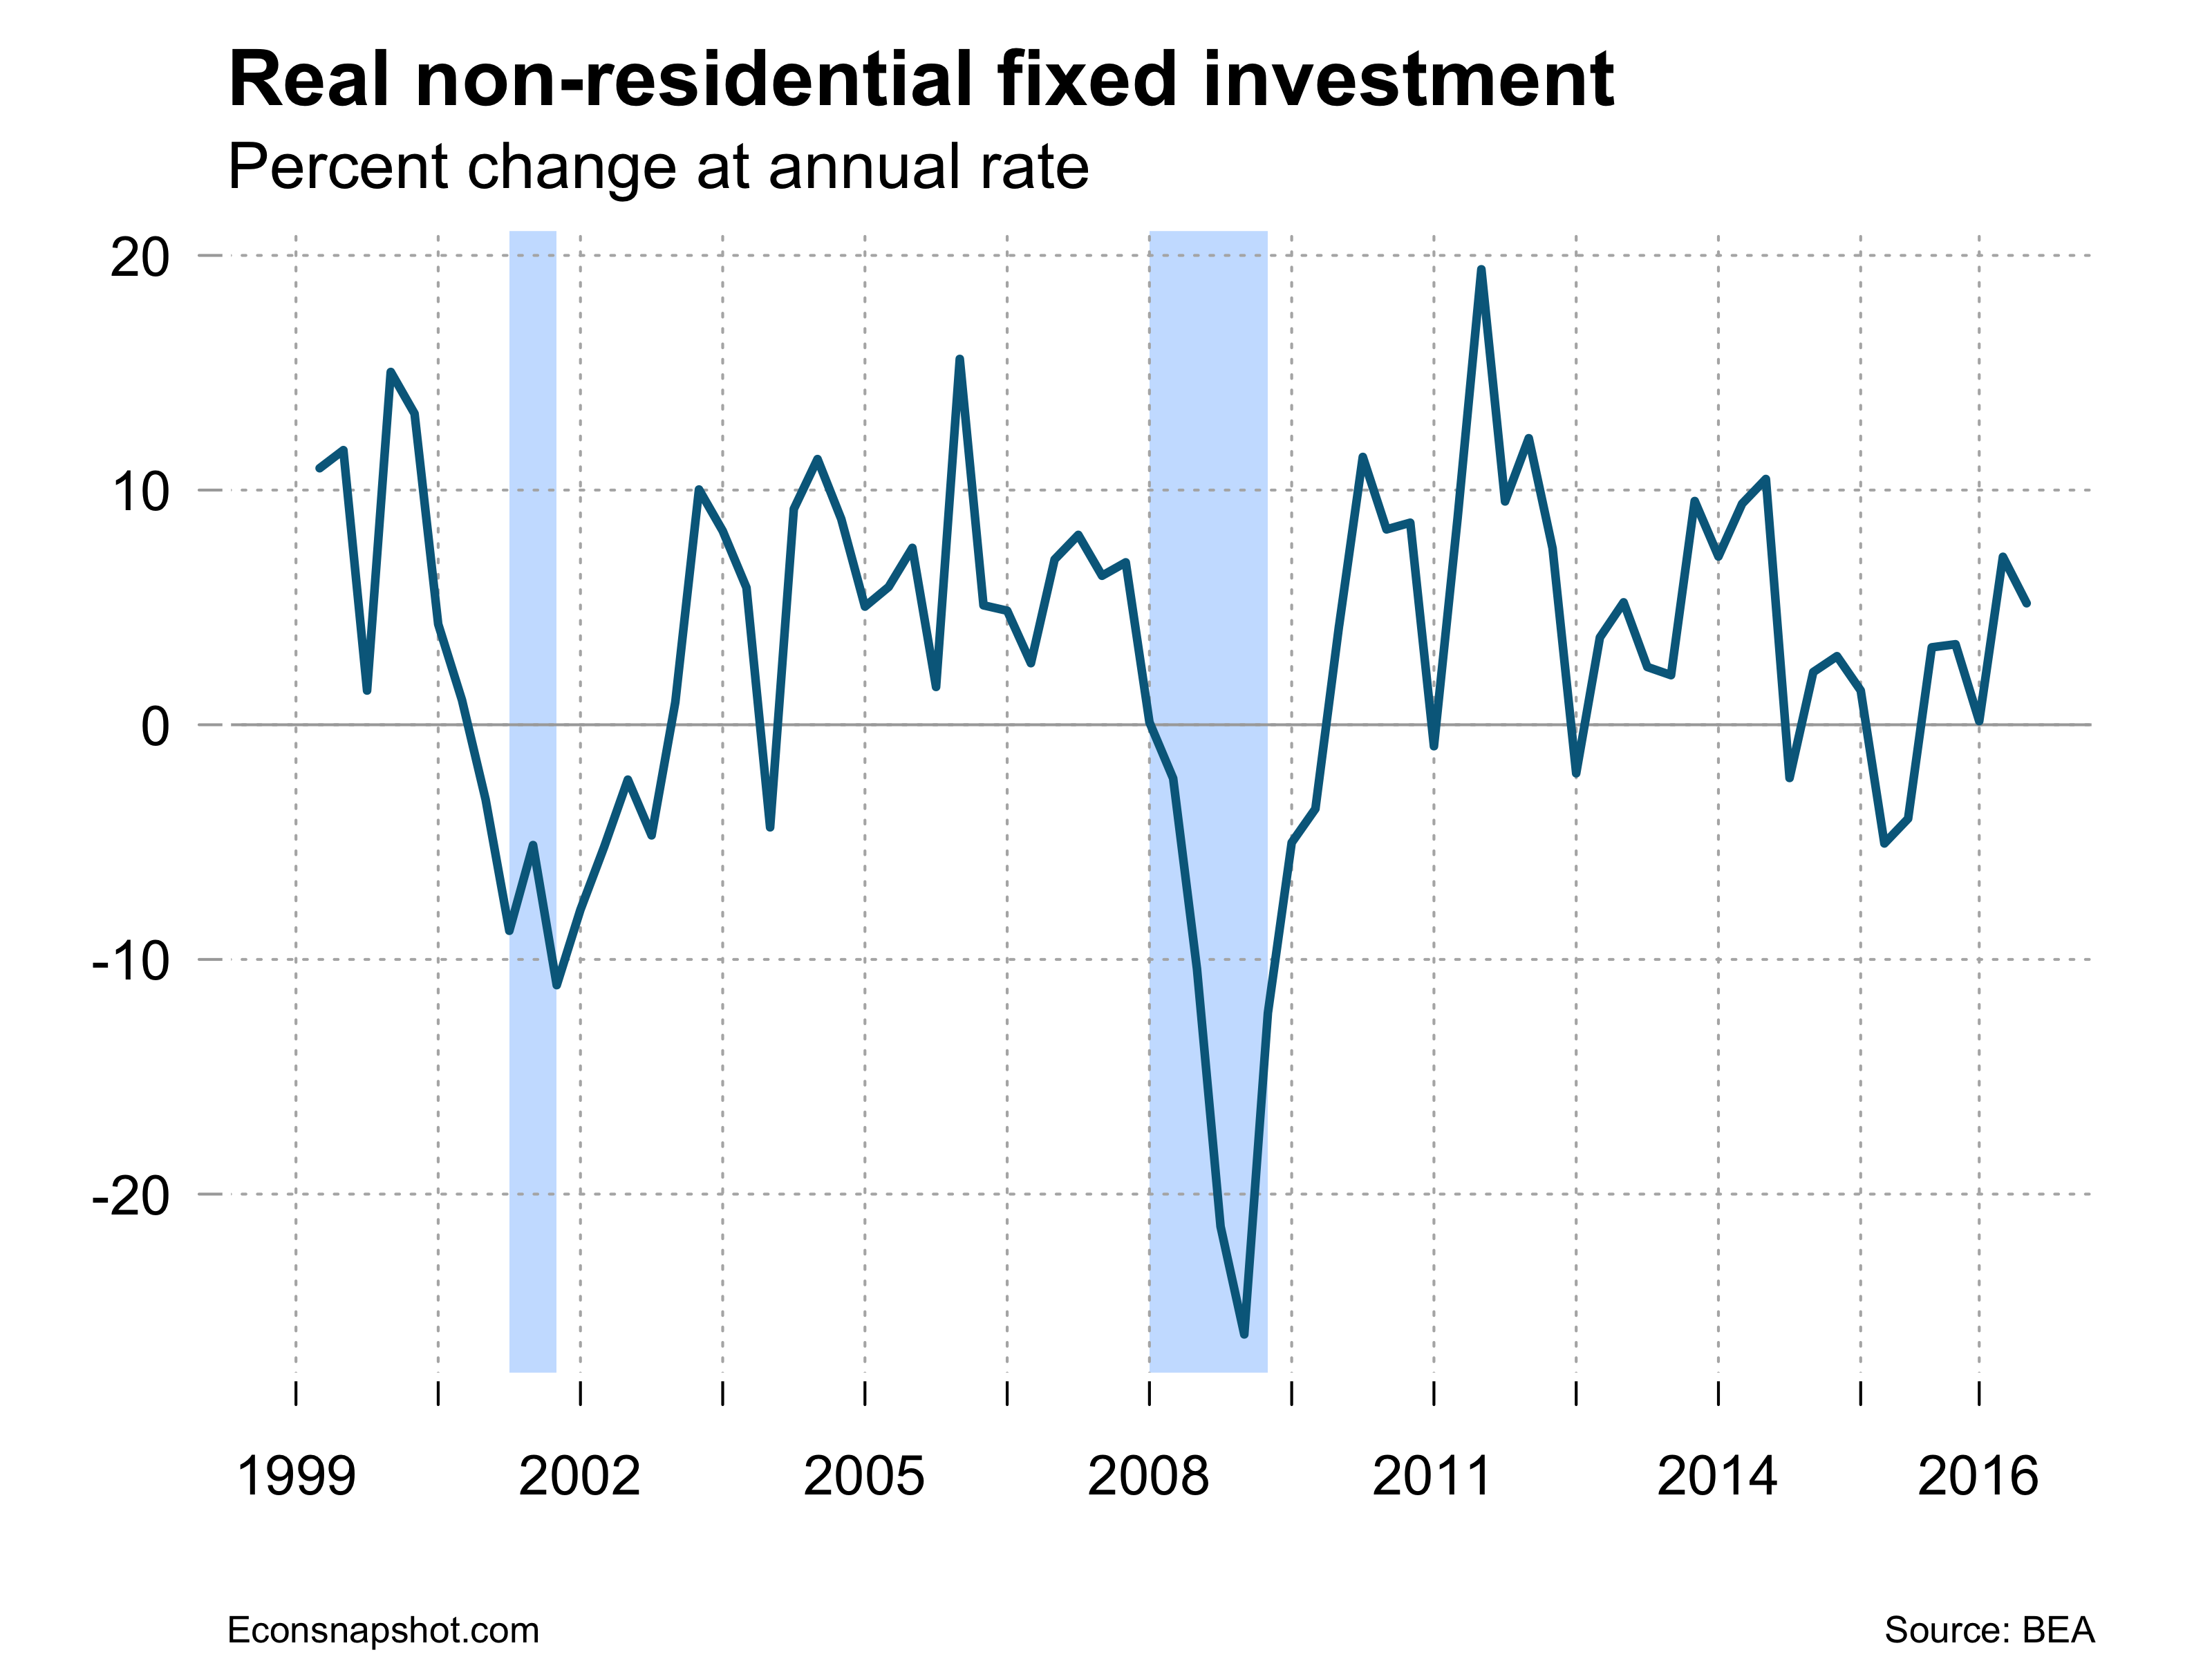
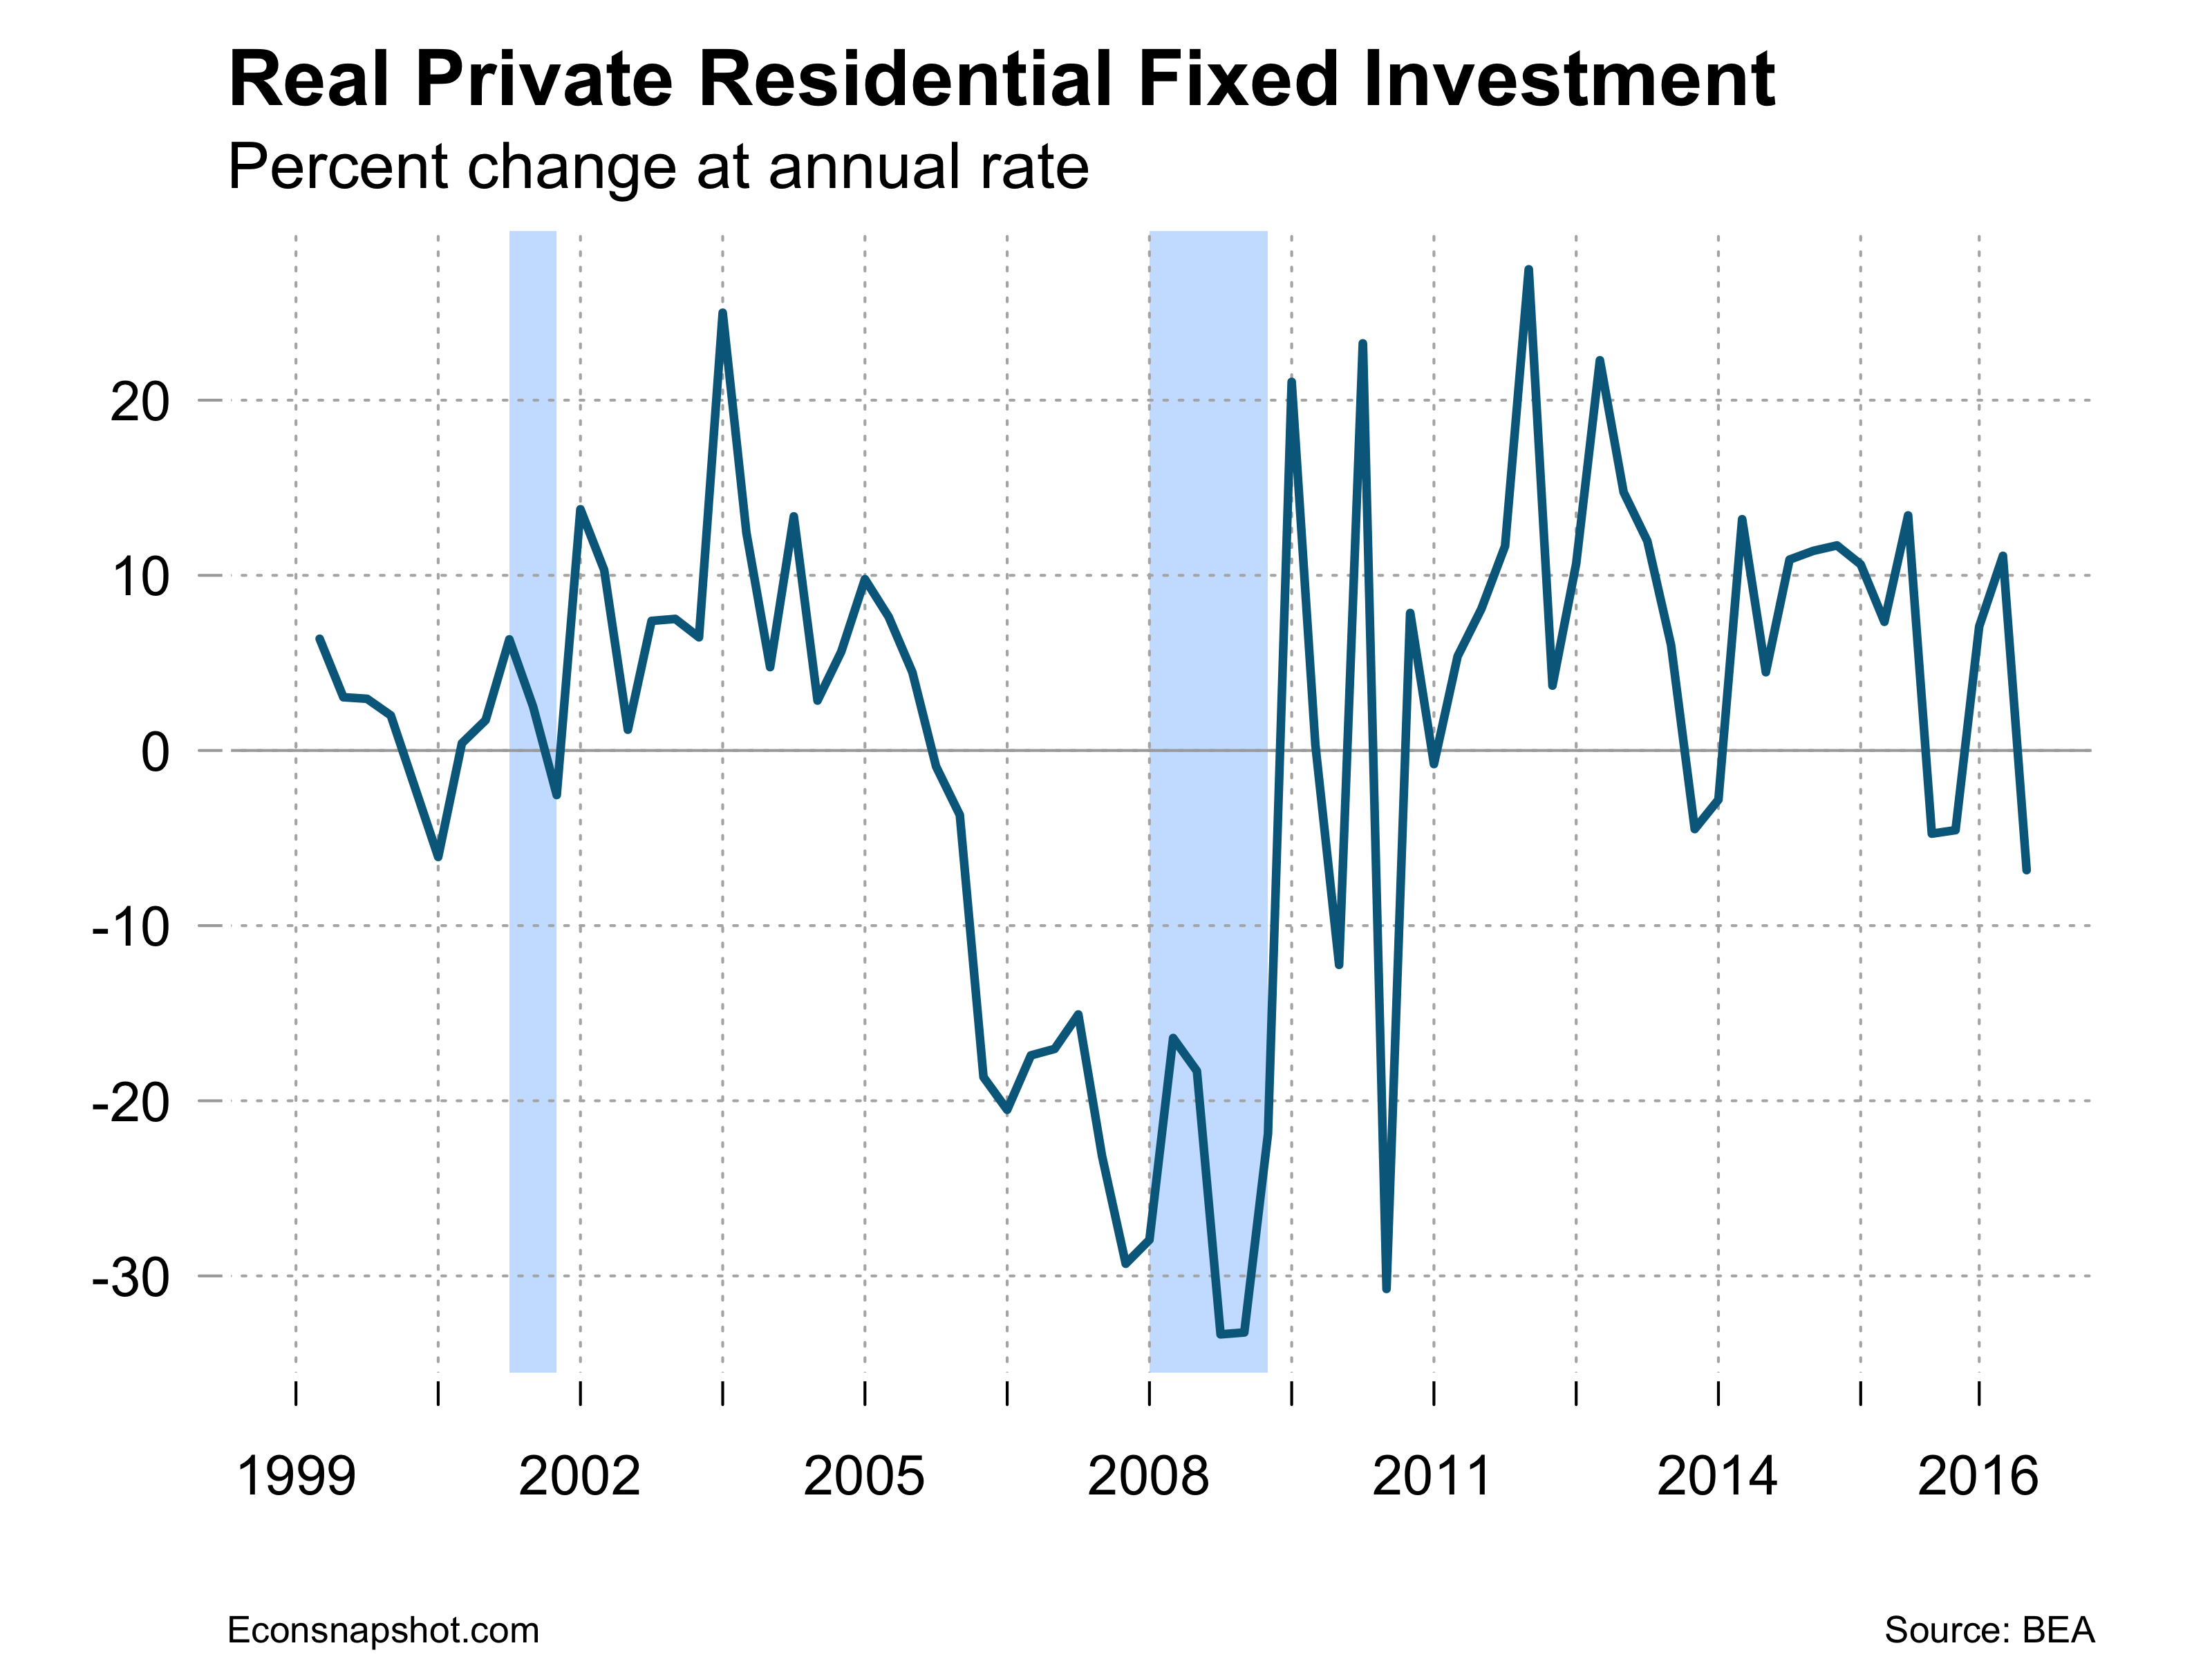
Several other sectors showed large increases, equipment up 8.2%, the largest increase since Q3 of 2015. Durable goods up 6.3%. Nonresidential fixed investment rose 5.2% following a 7.2% increase in Q1, the two highest growth rates since 2014 Q3. Residential fixed investment, however, declined 6.8%.

nrfireal-q-2017-07-29

residentialinv-2017-07-29

July is typically the month the BEA does annual updates. The timespan of the revisions is the first quarter of 2014 through the first quarter of 2017. Q1 of 2017 was revised down to 1.2% from 1.4%. The PCE price index was also revised down in Q1, from 2.4% to 2.2%. Overall, from 2013 to 2016 average annual growth was revised up slightly, to 2.3% from 2.2%.

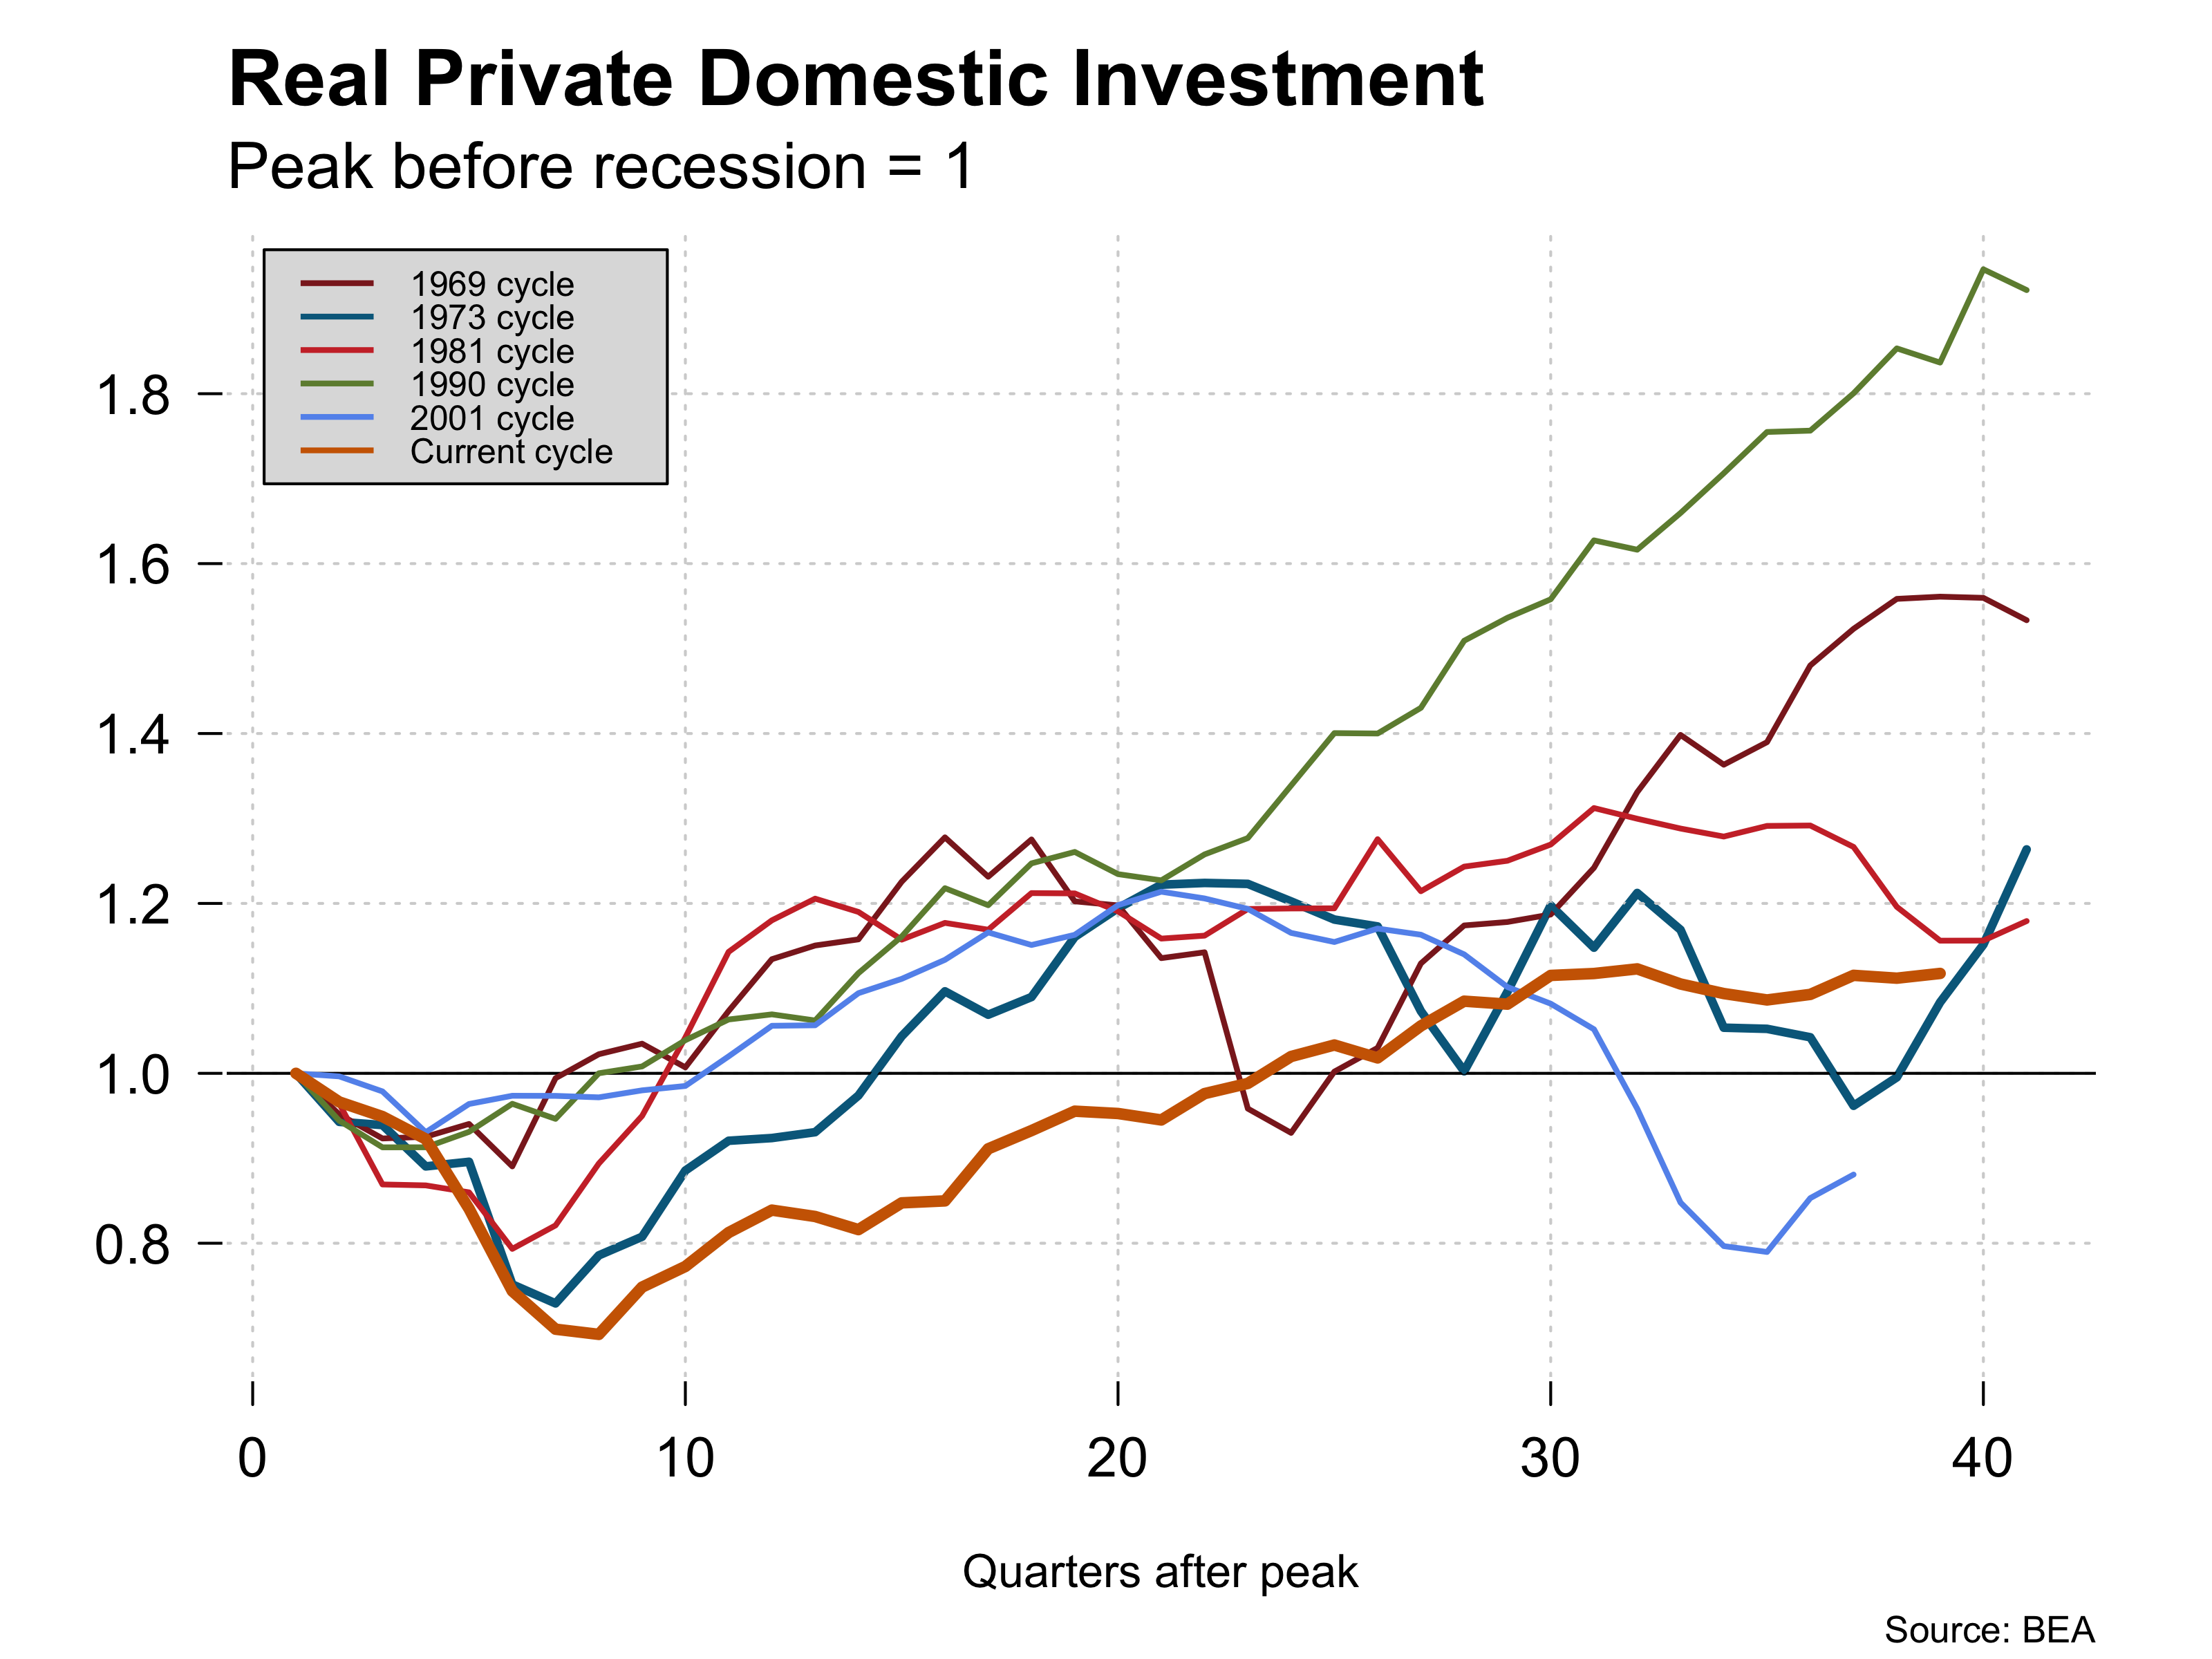
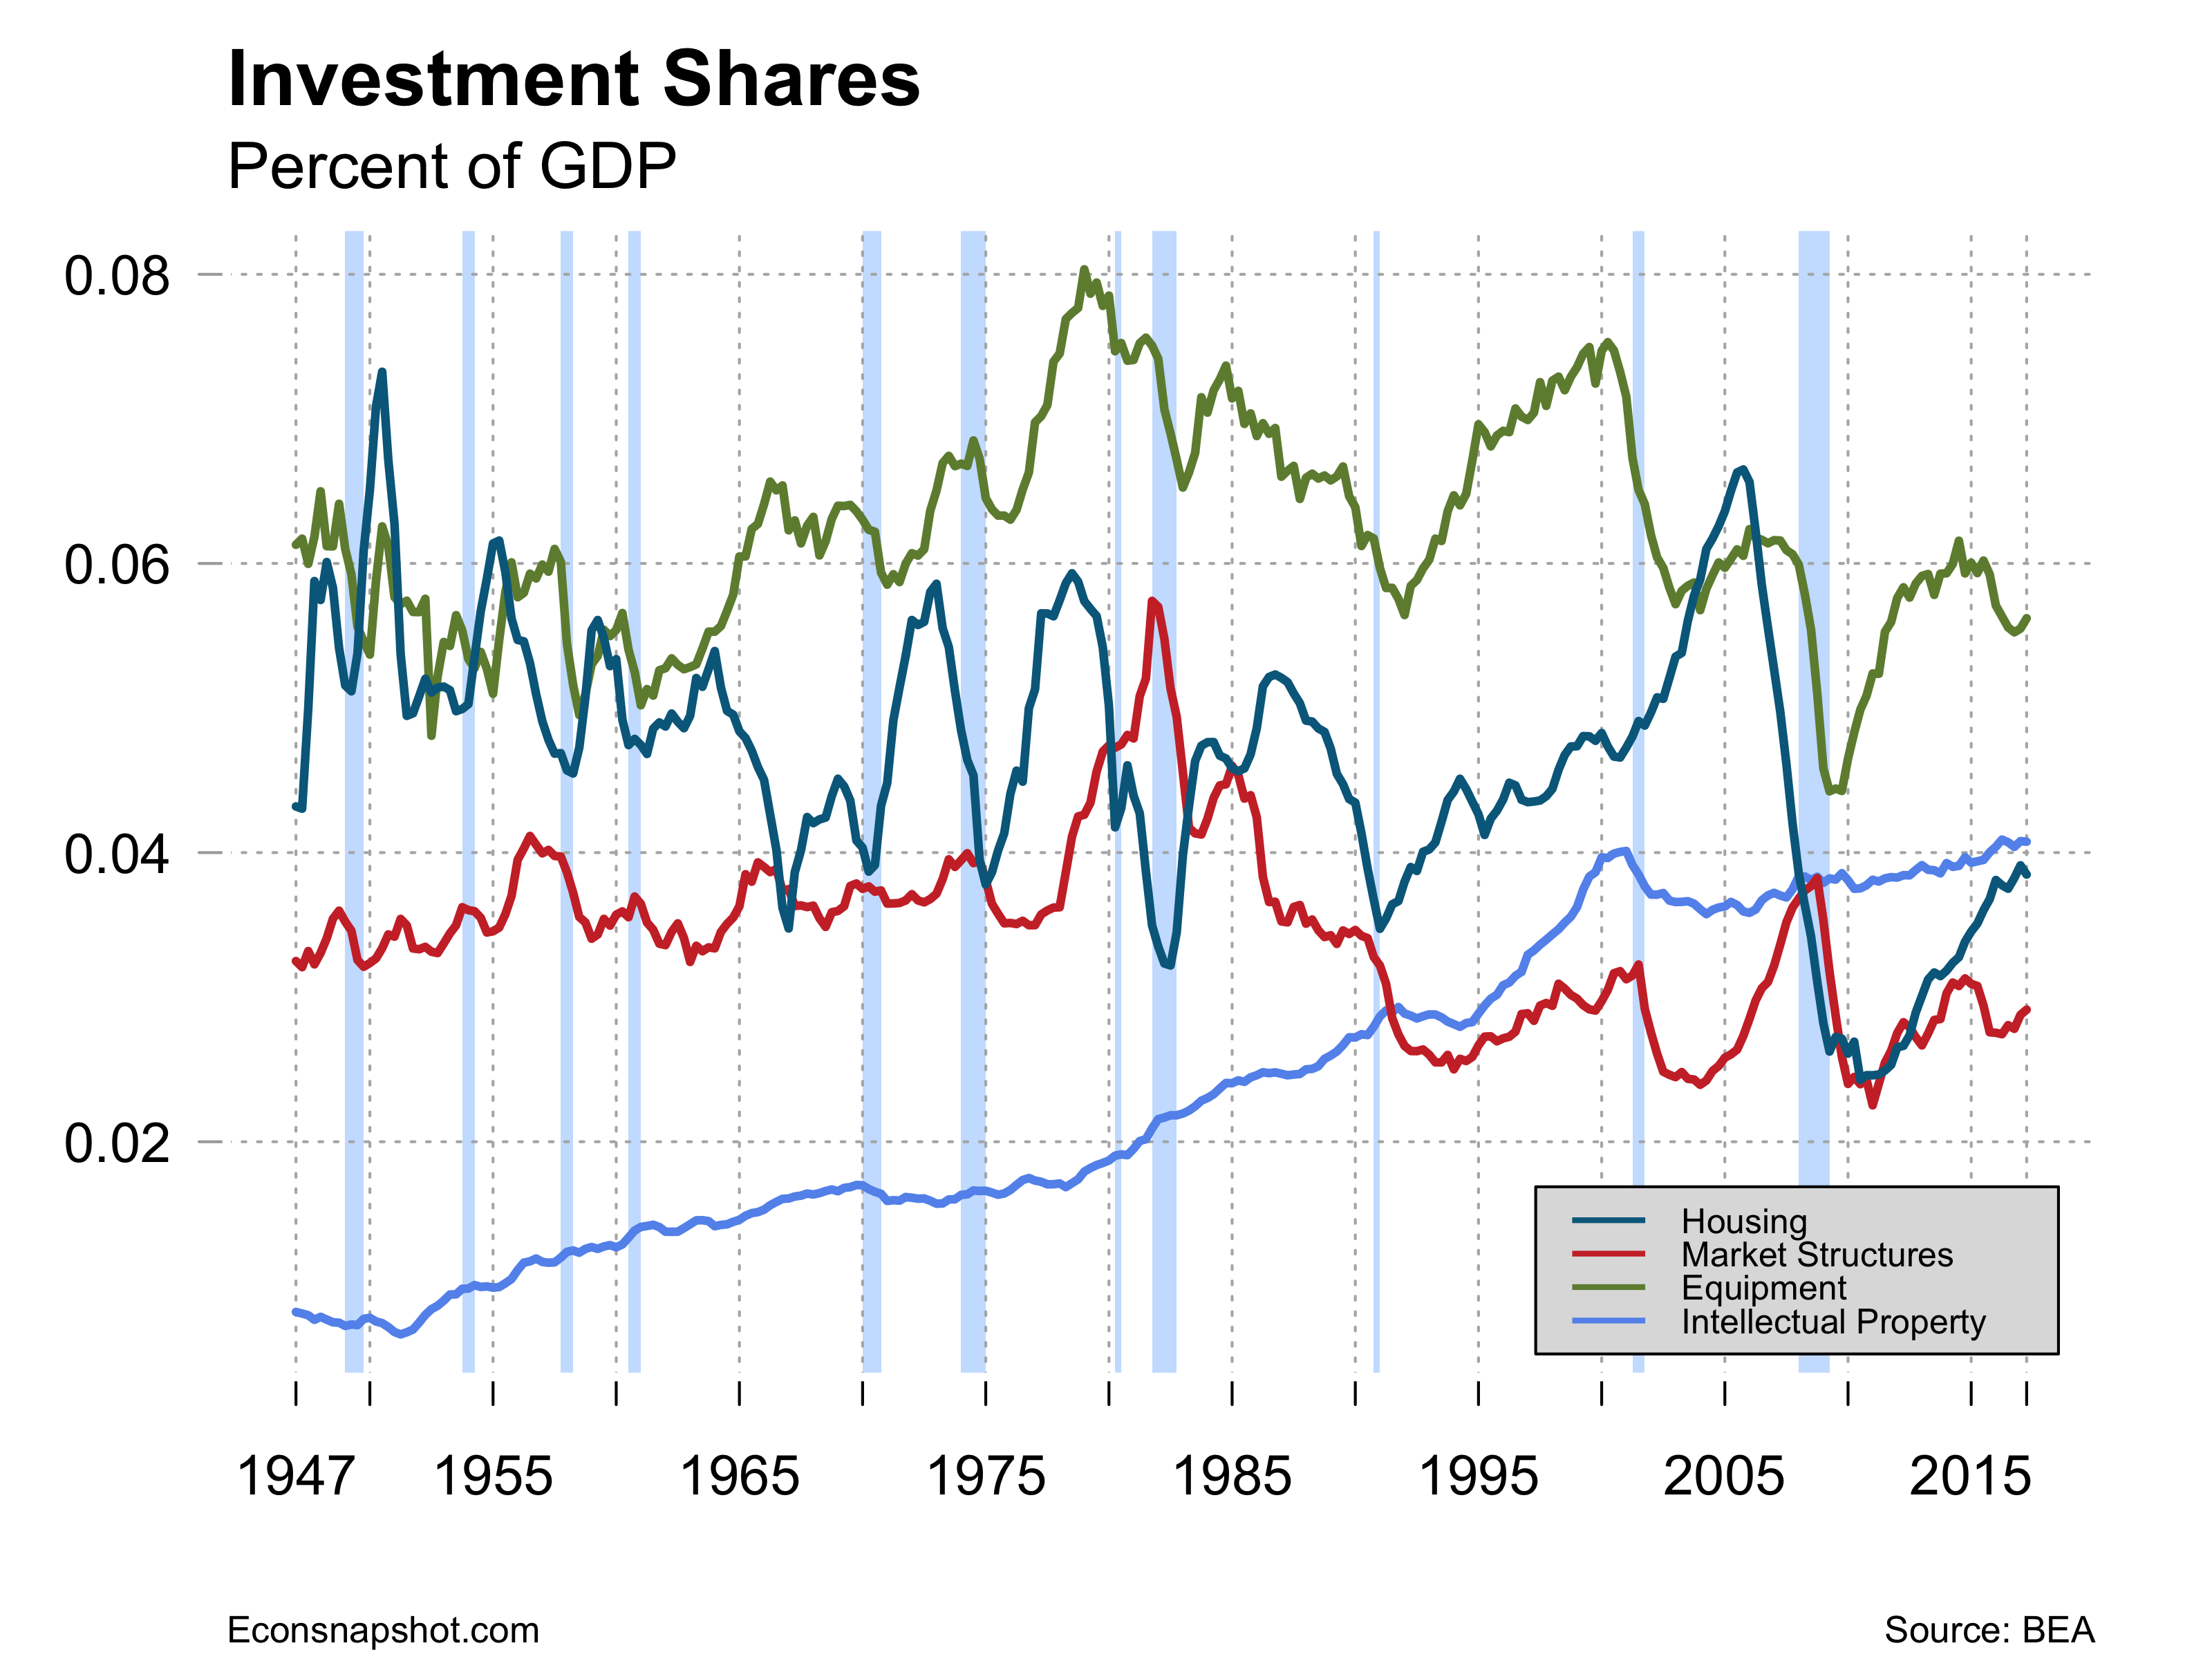
Q2 was expected to come in stronger than Q1 and it was expected that consumers would drag the numbers up. Still, the picture is of modest, unspectacular growth.  This is now a very mature expansion and it could turn down at any time.  What has been missing throughout is the stimulus that would come from increased investment.  A big infrastructure program could turn that around but it does not seem to be likely in the near future. The current recovery, compared to earlier recoveries, has been remarkably weak for investment. It took about six years to get back to the pre-recession investment levels. inv-cyc-2017-07-29investment_shares-2017-07-29

Employment Continues To Grow – Wages Stay Behind

By Thomas Cooley and Peter Rupert

The June jobs report was stronger than many people expected given that other economic indicators for the second quarter have been soft.  The BLS data show an increase in payroll employment of 222,000 with upward revisions of 14,000 for May and 33,000 for April. The average number of jobs added in the private sector is 180,000 per month in 2017, just slightly less than the 187,00 per month added in 2016.  The service sector provided 162,000 additional jobs. The largest contributors in the service sector were Health Care and Social Assistance which added 59,000 jobs, and Professional and Business Services, up 35,000.

The volatile Mining sector continues to expand, up 8,000. Manufacturing and Construction employment are still nearly 10% below the level back in January, 2008.

emp-sector-growth-2017-07-09

The household data indicates average weekly hours remained at 34.4 and average hourly earnings ticked up by only 4 cents last month and is up 2.5% since June of last year. With inflation up 1.87% since June of last year, real average earnings are up only slightly.

ahecpi-2017-07-07

The labor force jumped up 361,000, leading to a small increase in the labor force participation rate to 62.8 percent about where it has been for the past year. The labor force participation rate for teens has been ticking up slightly, now at 35.9 compared to a series low of 32.7 in February of 2014. The labor force participation rate for men, women and those over 55 all have pretty much flattened out over the past couple of years.

lfpsexage-2017-07-07

The number of persons unemployed was stable at 7 million. The employment to population ratio was also stable at 60.1 percent. The unemployment rate ticked up slightly, from 4.29% to 4.36%.

The Jobs Opening and Labor Turnover Survey shows that openings are at an all time high although the rate of hiring has slowed somewhat.

joltsjol-2017-07-09joltshir-2017-07-09joltsho-2017-07-09

Where does this leave us? The Fed has mentioned at least one more rate increase for the year, yet the labor market is giving somewhat mixed signals. Employment continues to grow, sure, but wages continue to stagnate. There is much talk about the unemployment rate being at a record low but there is little reason to boast about this when labor force participation, and the employment population ratio remain at sucet.h low levels.  This together with the stagnant wages and unfilled vacancies gives some support to the notion that there is a serious degree of mis-match in the labor market.
Weak(ish) May Jobs Report

By Thomas Cooley and Peter Rupert

The May jobs report was certainly on the weaker side. The BLS data show an increase in payroll employment of 138,000 with downward revisions totaling 66,000 (down 29,000 in March and 37,000 in April). The service sector provided 131,000 additional jobs. The largest contributors in the service sector were Education and Health services, up 47,000, and Professional and Business Services, up 38,000.

empchgm-2017-06-02

The volatile Mining sector continues to expand, up 6,000 and the 7th straight month adding employees. Manufacturing and Construction employment are still nearly 10% below the level back in January, 2008.

emp-sector-growth-2017-06-02

Average weekly hours remained at 34.4. Average hourly earnings ticked up slightly.

avghours-2017-06-02

The household survey showed a large decrease in the labor force, down 429,000, leading to a decline in the participation rate, from 62.9 to 62.7.  The number of employed persons was down 233,000 and the number of persons unemployed was down 195,000. The employment to population ratio fell from 60.2 to 60.0. The unemployment rate fell slightly from 0.044 to 0.0429.

epr-2017-06-02

lfp-2017-06-02uu6rate-2017-06-02

The  next two charts indicate there is something missing in the labor market picture.  Vacancies are at record levels and the unemployment rate is at a decade low and yet average hourly earnings have barely budged.  This, combined with low and falling participation rates, suggests that there is indeed something missing.  That something is human capital.  Jobs that can be routinized and require low levels of human capital are being replaced by technology. The education system is not producing the kinds of workers that are  needed in many parts of the economy.  The loss of jobs to robotics and AI is more likely to speed up than slow down and changing our human capital is a slow process.

Although there has been a lot of chatter about the Fed downplaying the previous GDP report and feeling confident the economy about the continued strength of the economy, there are certainly some signs the economy has deep seated weakness. Maybe not enough to dissuade the Fed from a June increase, but certainly to give some pause in their commentary.

Upward Q1 Revision to Real GDP

By Thomas Cooley and Peter Rupert

Today’s release of the 2nd estimate for Q1 GDP from the BEA brought a large increase, nearly double, in real GDP, compared to the advance estimate. The revised real GDP growth is 1.2% in the first quarter while it was 0.7% in the advance estimate. The positive revision has been a feature of first quarter estimates for several years and has sparked a lot of attention to the  seasonal adjustment.   There were significant revisions to final sales and some modest downward revisions to inventories. In addition, real personal consumption expenditures only grew at 0.6% (but were revised up from 0.3%), the weakest growth in over 5 years. .

There were downward revision to Q4 income growth which pushed the savings rate lower. Most of the markets’ attention was focused on the April report on durable goods issued this morning as well. It was very soft and some of the details were disappointing.

gdprealchgm1-2017-05-26

pcerealchgm1-2017-05-26

Both residential and non-residential fixed investment showed strong growth in the quarter, gaining 13.8% and 11.4%, respectively.

resnonres-2017-05-26

At the moment, the revised estimates will not do much to change the current thinking as to the state of the economy. The revision was a bit higher than expectations by many forecasters. We are just going to have to wait a little longer to see how the economy evolves as we near mid year. The Atlanta Fed’s GDPNow has revised down its forecast for Q2, from 4.1% to 3.7% after some of the latest releases, including today’s GDP and durable goods…still, 3.7% would be a very welcome outcome!