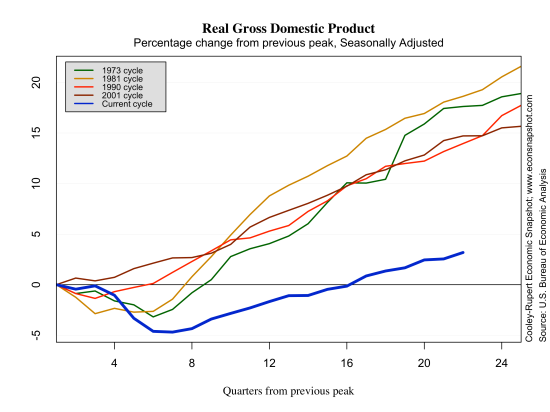
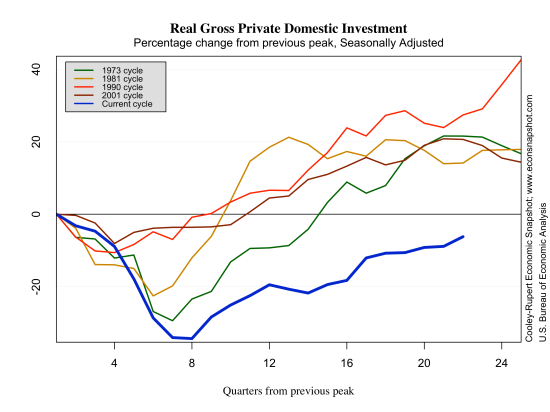
The Bureau of Economic Analysis announced here that real GDP increased by a seasonally adjusted annual rate of 2.5%. The increase was fueled largely by personal consumption expenditures (contributing 2.24 percentage points to the overall 2.5 percentage point increase).
What worked against the increase in real GDP growth was a large decline in government spending along with a big rise in imports. Although this report represents yet another quarter of growth below the long run trend, it was positive growth in contrast to Europe which is sinking back into recession.
On the bright side, the economy continued to generate positive growth without the boost from Government spending. Signs that housing markets contributed to the positive growth represent an encouraging phase in the recovery–historically, housing has led the economy out of contractions.
The bar graph shows another way of looking at the recent behavior of real GDP. The bars in the graph show the quarter-to-quarter change (s.a.a.r.) in real GDP while the blue line indicates the year-over-year change (s.a.a.r.). The first thing that stands out is the very large decline in real GDP during the last recession. The recession in the earlier part of the decade hardly looks like a recession at all in comparison. And, while the quarterly change in Q1 was 2.5%, the year-over-year change between 2013Q1 and 2012Q1 was 1.8%. Moreover there appears to be somewhat of a decline in the average year-over-year change: the average pre-2001 recession year-over-year change was higher than that in the years between the 2001 recession and the recession beginning in 2007 and that is higher than the recovery phase starting in June, 2009 (according to the NBER business cycle dates).
An alternative way to think about long-term economic growth is to decompose real GDP into a trend component and movements around this trend, that is, the cyclical component of the business cycle. Many economists use the Hodrick-Prescott (HP) filter to do this decomposition. The HP filter, however, has some issues that we have pointed out previously here about estimating the growth trend at the end of the data series.
If one believes we will eventually get back to 2% real growth, the trend line will be something like the dashed red line in the following two graphs. The green line represents the HP filter’s trend which equates to about 0.8% annual GDP growth.
The implication of this is that the recent recession and recovery will appear much worse if we believe that GDP will grow at 2% over the long term. The red dotted line in the graph below has shown no signs of returning to the historical trend, and won’t, as a long as the quarterly report consistently comes in below 2 percent. On the other hand, if you believe that the financial crises and Great Recession inherently altered the growth potential of the US economy and that the long-term growth trend has shifted down, as the green line shows, then the recovery doesn’t look nearly as anemic. In fact, with this view GDP has already recovered and is above trend.
Many may be aware of what has been called the Great Moderation, a period where the volatility of real GDP declined markedly–between the mid 1980’s and 2007. While some have mentioned that this may be the result of better policies, the recent episode may suggest that the great moderation was nothing but a series of smaller, or less consequential shocks.
 If one believes that we will once again move to the sustained 2% growth path, then the graph above leaves plenty of room for concern in the short-term.


