GDP: Q4 and 2012

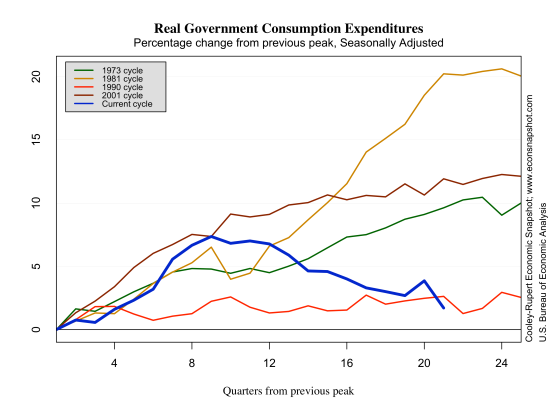
The third estimate of Q4 Real GDP, released today indicates anemic output growth of 0.4% (saar), although it was revised up from 0.1%. The estimate for 2012 annual growth stands at 2.2%, higher than the 1.8% growth seen in 2011. Government consumption continues to fall, down 7.0% overall, with federal government consumption down 14.8%.

rgdp-2013-03-28

govcons-2013-03-28

The higher revision came mainly from fixed investment: (advance: 9.7%, second: 11.2%, third: 14.0%) and exports:  (advance: -5.7%, second: -3.9%, third: -2.8%). Consumption expenditures, on the other hand, were revised down (advance: 2.2%, second: 2.1%, third: 1.8%)

cons-2013-03-28

inv-2013-01-30

Continue reading “GDP: Q4 and 2012”

February Employment Report Beats Expectations

Solid growth in employment

The increase in total nonfarm employment, +236,000 as seen in today’s Employment Situation, beat most analysts expectations, although January employment was revised down slightly, from +157,000 to +119,000, as seen in the Net Employment Change chart below.

empchgm-2013-03-081
Private sector employment was up +246,000 while the government sector continued to shed jobs, -10,000. State government was responsible for 80% of that decline. The largest gain came from private service workers, +179,000. Professional and business services added +73,000. Goods producing employment was also up, +67,000, led mainly by construction, +48,000, and in that sector the largest gain was in specialty contractors. Total employment continues to grow steadily, but is still not back to its level in December of 2007.

emp-2013-03-08

The unemployment rate ticked down from 7.9% to 7.7%, and at 12,032,000 there were about 300,000 fewer unemployed persons compared to last month. However, those unemployed more that 27 weeks edged up by 89,000. Overall there are about 4.7 million persons who have been unemployed more than 27 weeks.

urate-2013-03-08

The employment to population ratio was unchanged from last month at 58.6%, moreover, it was also 58.6% in February of 2012 and was close to that level three years ago. While this picture reveals no growth over the past year, it is not necessarily a sign that labor market is still under considerable duress. There are many factors that drive this statistic, such as decisions about entering the labor force,  retiring, or staying in school. The point is that while the employment population ratio is indicator of labor market health, there are lots of things that drive it. The ratio at the beginning of the recession in December of 2007 may have been “cyclically” high, and now has adjusted to a new level. This can also be seen in the labor force participation rate, which actually declined slightly over the month, from 63.6% to 63.5%.

epr-2013-03-08

lfp-level-2013-03-08 lfp-2013-03-08

The Beveridge curve depicts the relationship between the reported vacancies and the unemployment rate. As is evident in the graph, the unemployment rate is much higher given the vacancy rate than it was before the last recession. The first red dot to the  left shows that at the beginning of the recession the vacancy rate was about 3% (3 vacancies for every 100 employed) and the unemployment rate was under 5%. Today, the vacancy rate is just under 3% yet the unemployment rate is 7.7%. Why those unfilled vacancies remain unfilled given that level of unemployment remains an open question.

beveridge-2013-03-08

Snapshot: Household and Corporate Finances

Data released by the Federal Reserve shows that household sector debt outstanding rose at a 2.5% annual pace in the last quarter of 2012. It was the first time since the beginning of the recovery that household debt didn’t fall as a percentage of GDP. Households had been steadily de-leveraging until the most recent quarter. Debt to GDP remains 15 percentage points below its level at the peak of the cycle and those levels will not likely be seen again soon. Total borrowing by the household sector also increased in the fourth quarter, indicating that the household sector is willing to take on additional debt in this very low interest rate environment.

hh-debt-gdp2013-03-07

hh-borrow-gdp2013-03-07

In terms of net worth (assets minus liabilities), households’ balance sheets are slowly improving, aided by a recovery in the housing sector and rising equity prices. As a percentage of GDP, the fall in household net worth from the peak in 2007 was 4 times as severe as the fall caused by the dot-com bust that spurred the 2001 cycle. The difference, of course, was the collapse of the housing market. The total market value of real estate assets fell 40 percent more than the fall in GDP. This was combined with a similar fall in the value of household’s holdings of financial assets.

hh-realestate-gdp2013-03-07

hh-financial-gdp2013-03-07

Non-financial business corporate debt rose at an even faster pace in Q4 (8.75% annually). A large portion of the increase was due to increased corporate bond issuance.

bc-debt-gdp2013-03-07

bc-borrow-gdp2013-03-07

There has been a lot of talk (here is one example) about how corporations are hoarding cash and are reluctant to invest earnings. The figure below shows the amount of checkable deposits and currency held by the non-financial corporate sector (only one form of liquid assets corporations hold).

bc-cash-level-2013-03-07

The total size of this cash hoard is now nearly twice as high as it was before the peak of the cycle and nearly $400 billion higher than at the trough. Before you make the call in favor of hoarding though, take a look at the evolution of total currency and deposits as a percentage of total assets.

bc-cash-gdp-level-2013-03-07

As a percentage of total assets, the business corporate sector’s holding of currency and deposits is relatively low and is returning to the levels of the 1980’s. A similar picture can be shown looking at a broader category of liquid assets (including savings, time depots, mmmfs, etc.). There doesn’t seem to be any extraordinary behavior on the side of firms. Similarly, households appear to be carrying relatively low levels of cash and deposits relative to total assets.

hh-cash-level-2013-03-07

hh-cash-assets-level-2013-03-07

Update: Second Estimate of Q4 GDP Shows Slight Improvement

The second estimate of Q4 Real GDP, released yesterday indicates that output grew a tiny bit in the fourth quarter and there was an upward revision in the third quarter. than previously estimated at 2%. On the face of it this seems like good news but it is really insignificant and is much smaller than typical revisions. The fundamentals that we look to for evidence of a robust recovery were not encouraging.

The BEA also released January 2013 personal income and savings. Personal income declined by 3.6% compared to a gain of 2.5% in December and the personal savings rate dropped with it, plunging back down to 2.5%. As we showed last month, the effects of fiscal policies were clearly evident in the December 2012 personal income gain, as companies shifted dividend payments forward to avoid the end of the payroll tax holiday. January’s numbers reinforce this idea.

personal-income-2013-03-02

savings-monthly-2013-03-02

As always, we show the components of GDP measured from the peak of the business cycle.

imports-2013-02-28