The effects of hurricane Sandy on the labor market obviously make interpreting the data more difficult. However, the BLS issued a statement in today’s Employment Situation report stating:
...our survey response rates in the affected states were within
normal ranges. Our analysis suggests that Hurricane Sandy did
not substantively impact the national employment and unemployment
estimates for November.
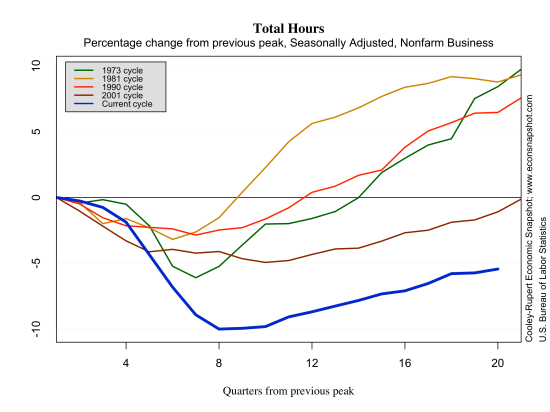
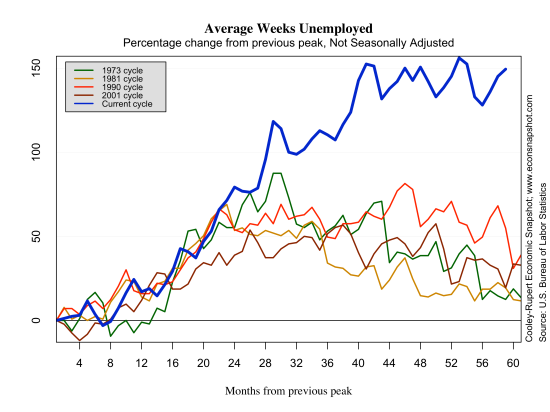
This morning’s report shows non-farm payrolls increasing 146,000 in November with total private employment rising 147,000. The increase is slightly lower than the average monthly employment gain in 2012 of 151,000 and of 2011 of 153,000. As seen in the graph below, both the pace and the level of the recovery of the labor market are still well below the average from the previous four cycles. Employment gains were found in retail trade, professional and business services, and health care.
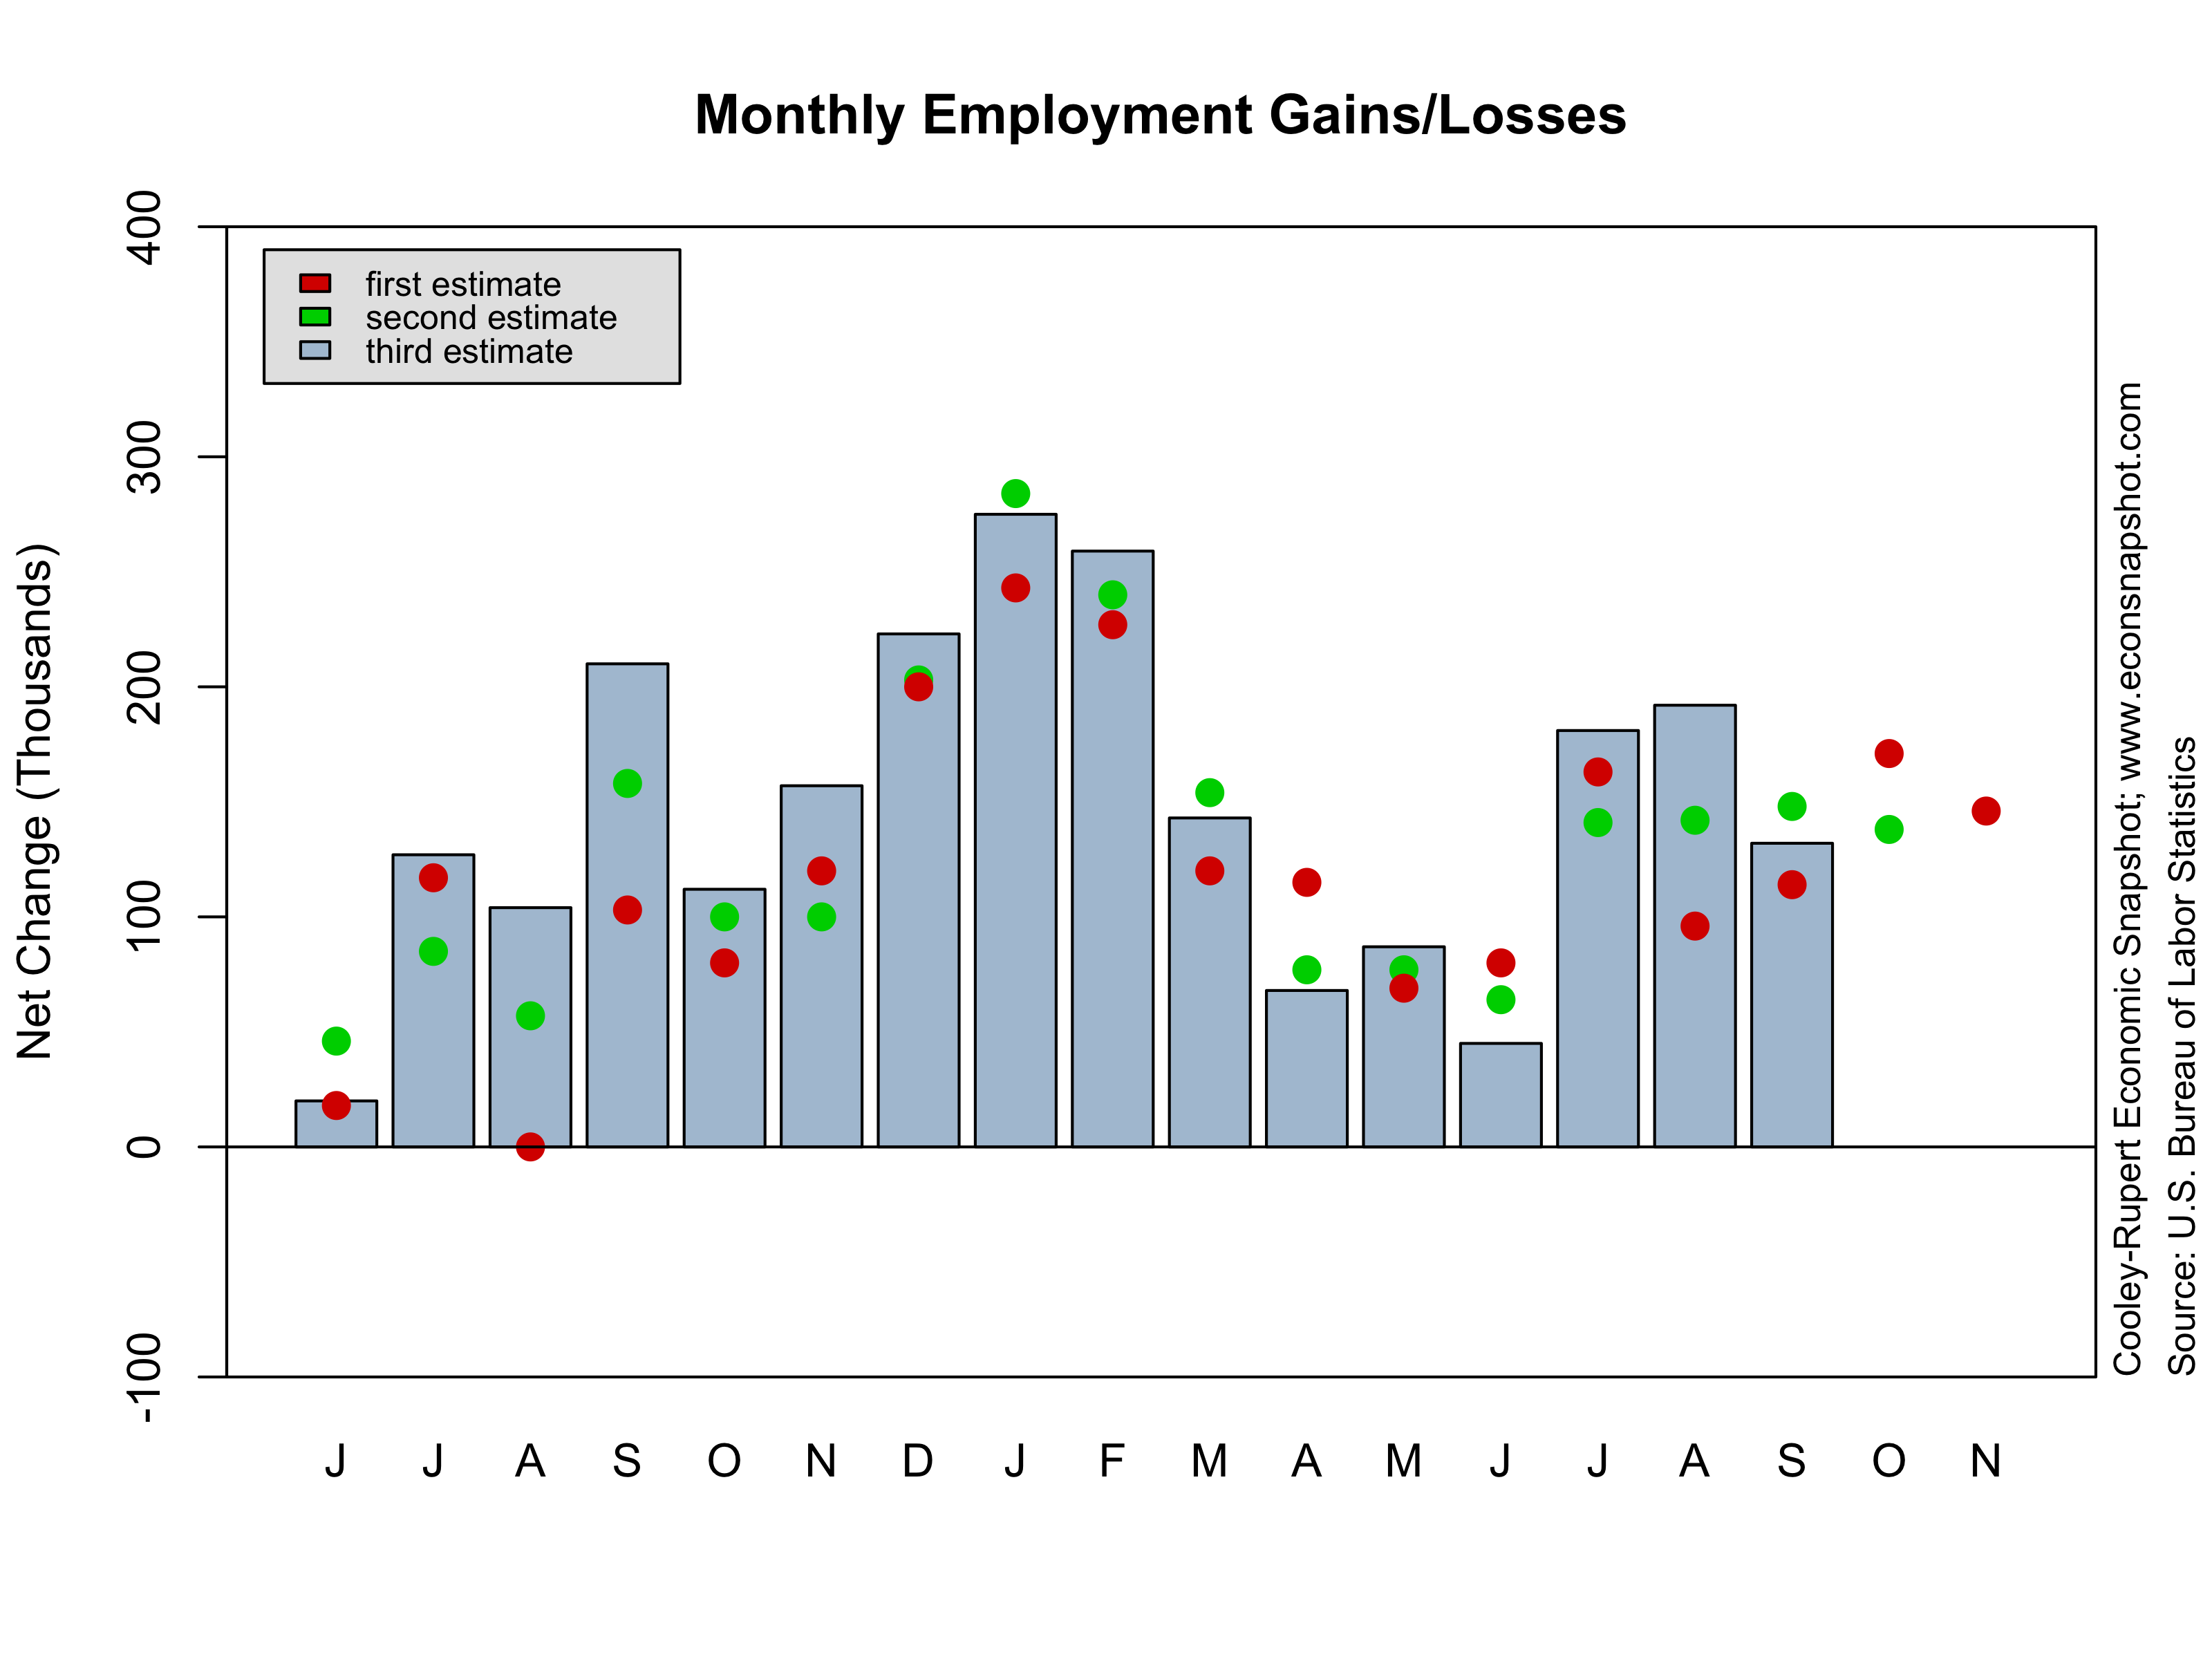
While the report does show that employment was up, there is also some down: goods producing industries declined over the month, with construction falling 20,000. The report also included downward back-revisions for the previous two months of 49,000. As is well-known, the BLS procedures for employment involve an initial estimate that gets revised in each of the next two months to arrive at the “final” estimate. The chart below shows these revisions since June, 2011. The red dots represent the initial headline estimates, while the green dots and bars represent the two revisions.
The graph makes evident how much noise is in the estimation process. On average, since the start of the recovery in July 2009, the average revision from the first to the final estimate has been +30K. One can argue that this error is quite large, especially when the economy is adding only 150K jobs a month. Another interesting observation is if there is any predictable under or over estimation occurring, especially over the business cycle. It is difficult to observe any systematic behavior from the graph below, but it does seem that the first revisions are relatively persistent to the previous data point. During times when the employment change is increasing, the BLS tends to underestimate the true value. In times when the employment change is decreasing the opposite is happening and the BLS tends to overestimate.
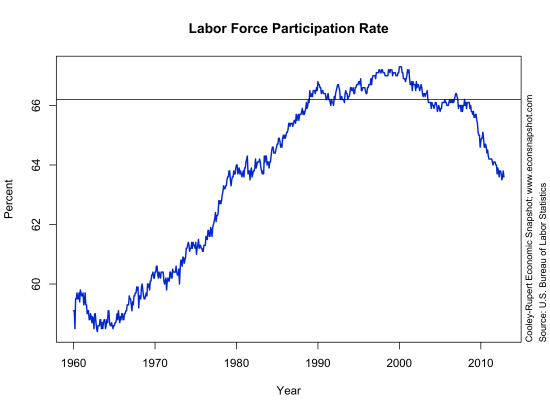
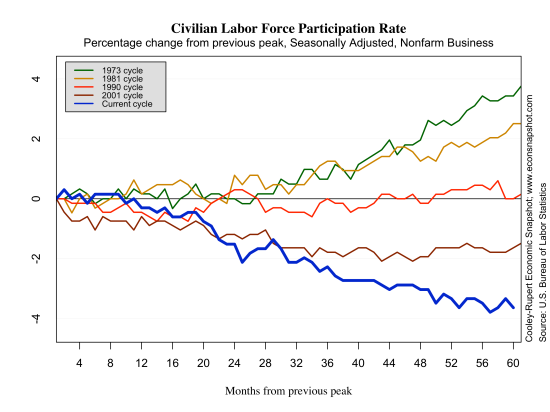
The national unemployment rate decreased over the month to 7.7%. However, there was little change in the number of unemployed persons, approximately 12 million. The decline in the unemployment rate was a result of a decline in the labor force. The participation rate fell from 63.8% to 63.6%. Moreover, the employment to population ratio also declined slightly, from 58.8 to 58.7.
