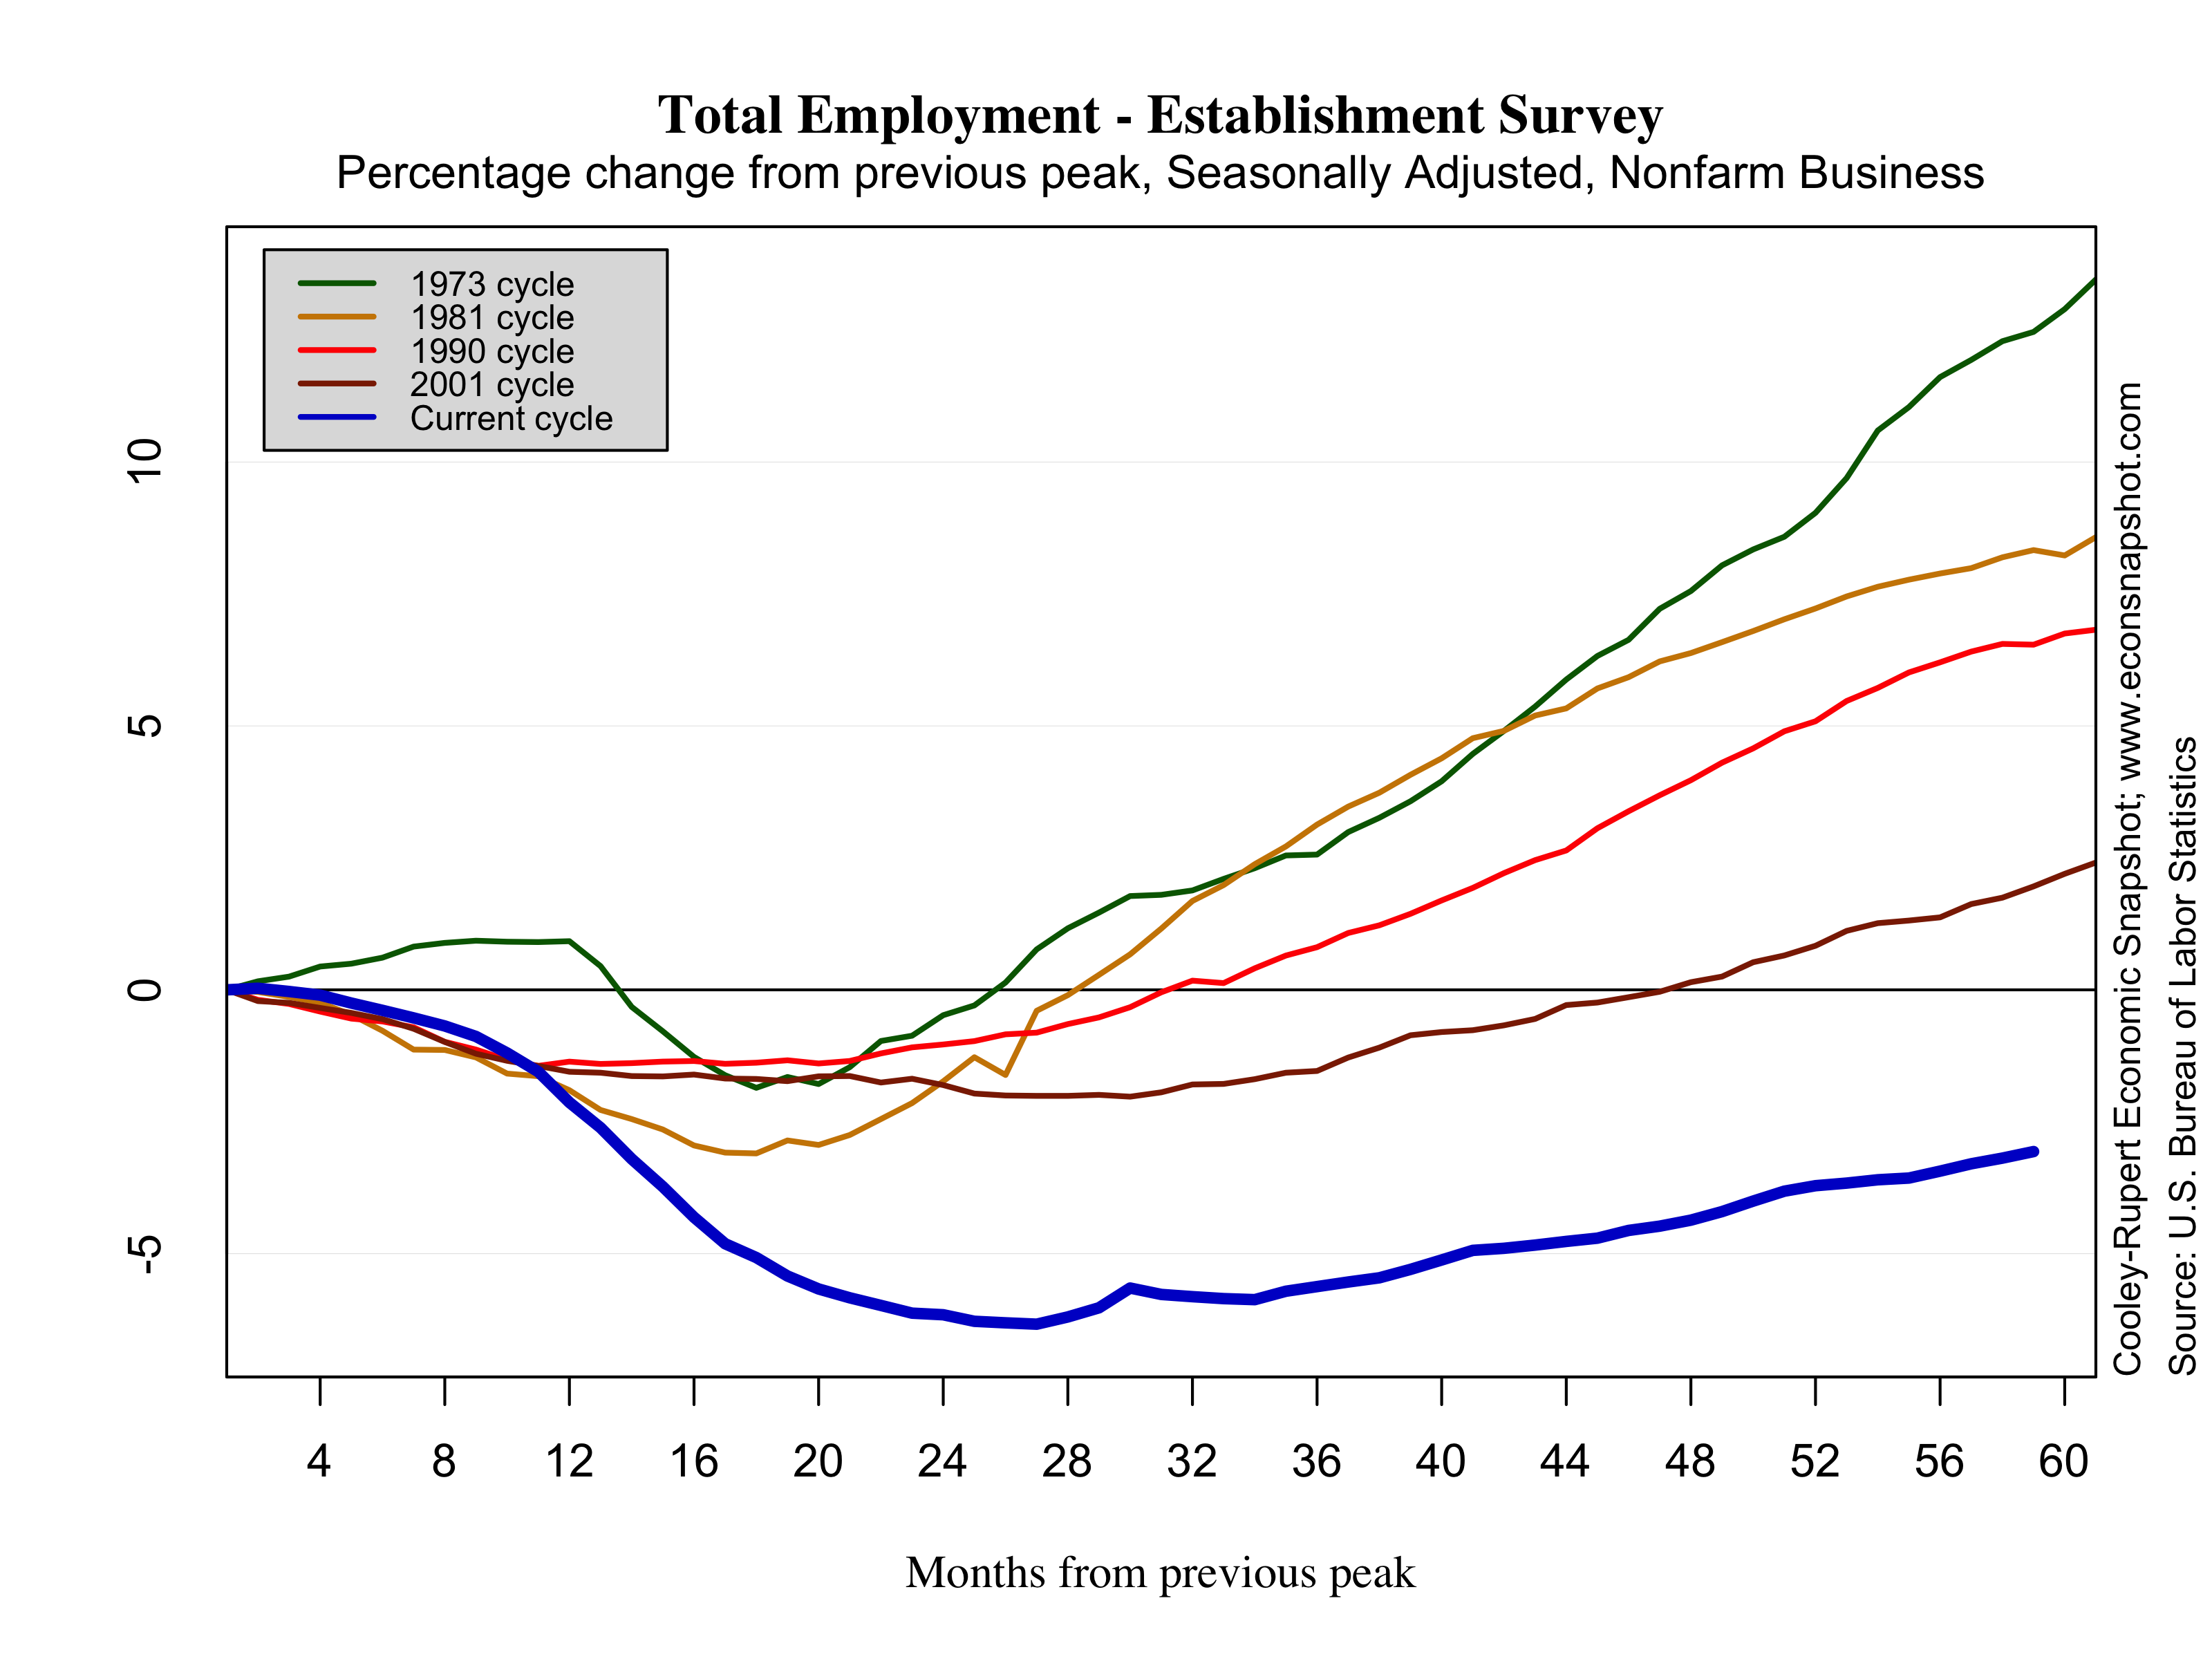
The Employment Situation released today from the BLS is being hailed by many as encouraging and a positive sign the economy is picking up steam yet, as seen in the graph below, both the pace and the level of the recovery of the labor market are still well below the average from the previous four cycles. The report today shows non-farm payrolls increased 171,000 in October. The report also included upward back-revisions for August (192k from 142k…note that the revision was nearly 100k higher than the advance estimate!) and September (148k from 114k). Employment gains were primarily attributed to service industries (+163K), led by retail trade (+36.4K) and health care (+32.5K). Goods producing industries increased over the month (+21K) after two consecutive months of decline. The market has responded relatively positive the past three employment reports despite the slow growth. For instance, last month the Dow increased .3% based on a reported employment gain of 114K. Comparatively, last October the market decreased 5% based on a similar increase of 112K jobs. What was once seen as weak, is now encouraging. From the same WSJ article above, John Silvia of Wells Fargo Securities says “Over the past three months, private-sector job gains have averaged 149,000, suggesting sustained growth even though the trend remains subpar”. As the graph below shows, the trend was the same last October as it is now. The difference is maybe the market as a whole is starting to believe 149K is now the new long term trend. If this is the case, a 171K jobs number is certainly positive.

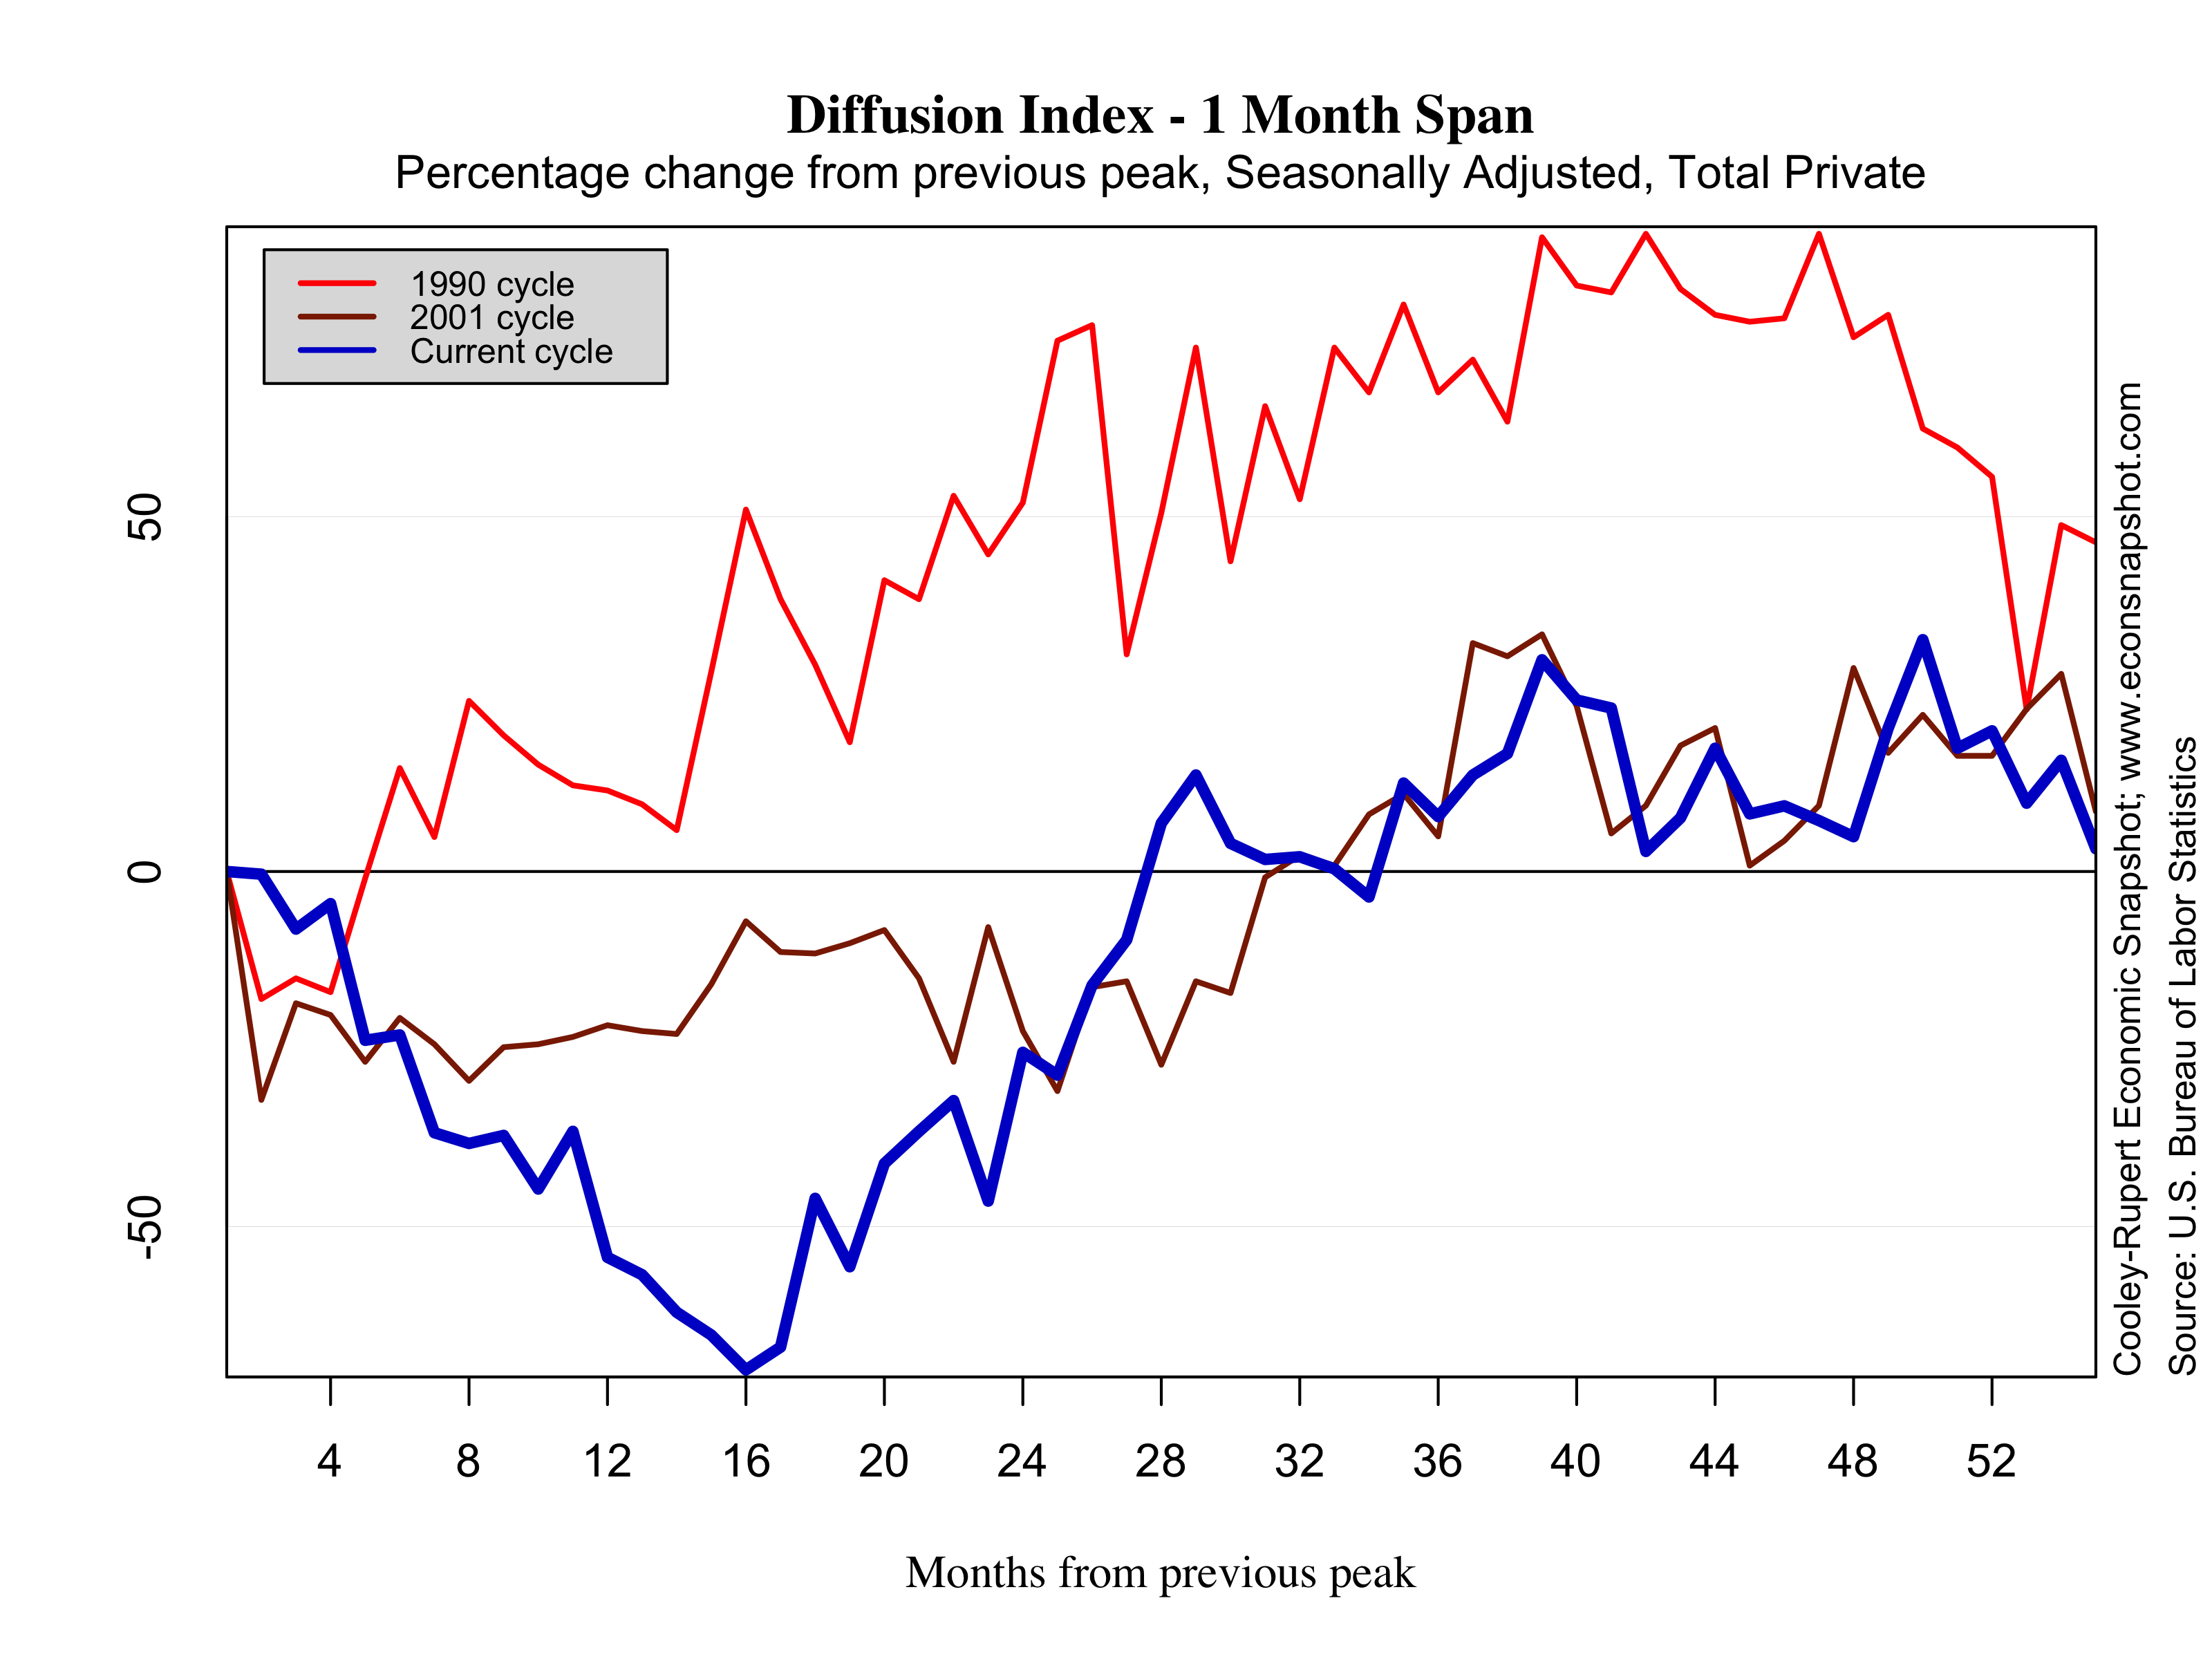
An additional, important measure of the recovery in the labor market is how disperse the employment gains are across industries. A labor market in which many industries are hiring moderately is typically better than a labor market in which only one industry is hiring vigorously. The diffusion index reported in the Employment Situation – Table B measures the percentage of industries with employment increasing plus one-half of the industries with unchanged employment, where 50 percent indicates an equal balance between industries with increasing and decreasing employment. The index was up to 60.7, the highest reading for any October since 1999, meaning the employment gains were fairly broad-based. Indeed, the index is already above its pre-recession level. This tells us that the moderate recovery is moderate across the board and not only in the aggregate.
The national unemployment rate actually increased over the month from 7.8% to 7.9% The number of unemployed individuals increased to 12.3 million persons. The labor force participation rate increased to 63.8%. While still far below the participation rate of 66%, the entrants into the labor force nudged the unemployment rate up slightly. Moreover, unemployment duration was up for both the mean 40.2 weeks (39.8 in September) and the median 19.6 (18.5 in September). There are about 5 million persons who have been unemployed 27 weeks or longer, however, that is about 800K less than one year ago.
The other slightly negative news from this report came from the workweek, hours-worked, and earnings data. Average weekly hours were unchanged at 34.4 and average hourly earnings fell slightly to $23.58.


My research shows that the natural rate of unemployment has risen to 7.6%.
The US economy is in long-term trouble.
I use the equation…
UT = unemployment – capacity utilization + labor income (2005=100) – 22.5
I first calculate UT for each quarterly data since 1967.
then I plot the value of UT against the unemployment rate. Since 1967, the unemployment rate slid up and down a line with an equation = unemployment = 0.23*UT+4.6. (R2=0.63) (4.6 is the old natural rate of unemployment)
since 2010, the unemployment plot has been moving along a new line showing a higher natural rate of unemployment with an equation = unemployment*UT+7.6 (R2=0.91) (7.6 is the new natural rate of unemployment)