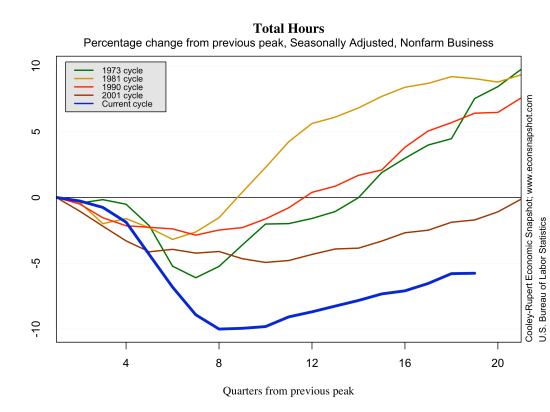
According to the establishment survey from the Bureau of Labor Statistics, nonfarm payroll employment increased by 96,000 in August, undershooting expectations by a large margin. Private payrolls increased by 103,000 while government continued to shed jobs, declining by 7,000. Service sector employment rose by 119,000 while the goods-producing sector declined by 16,000, led by a big decline in durable goods manufacturing, falling 17,000. The report undershot expectations by a large margin, many had predicted the labor market would add about 125,000 jobs or so. Moreover, downward back revisions of 41,000 over the previous two months show a much weaker labor market. While there had been some upbeat, hopeful, data released toward the end of this week, the labor market did not listen. The labor market has developed a bit of a bump in the recovery road, according to the BLS, “Since the beginning of this year, employment growth has averaged 139,000 per month, compared with an average monthly gain of 153,000 in 2011.” It has also become evident in the labor market that we continue to drown our sorrows…employment in food and drinking establishments has risen 298,000 over the past 12 months.
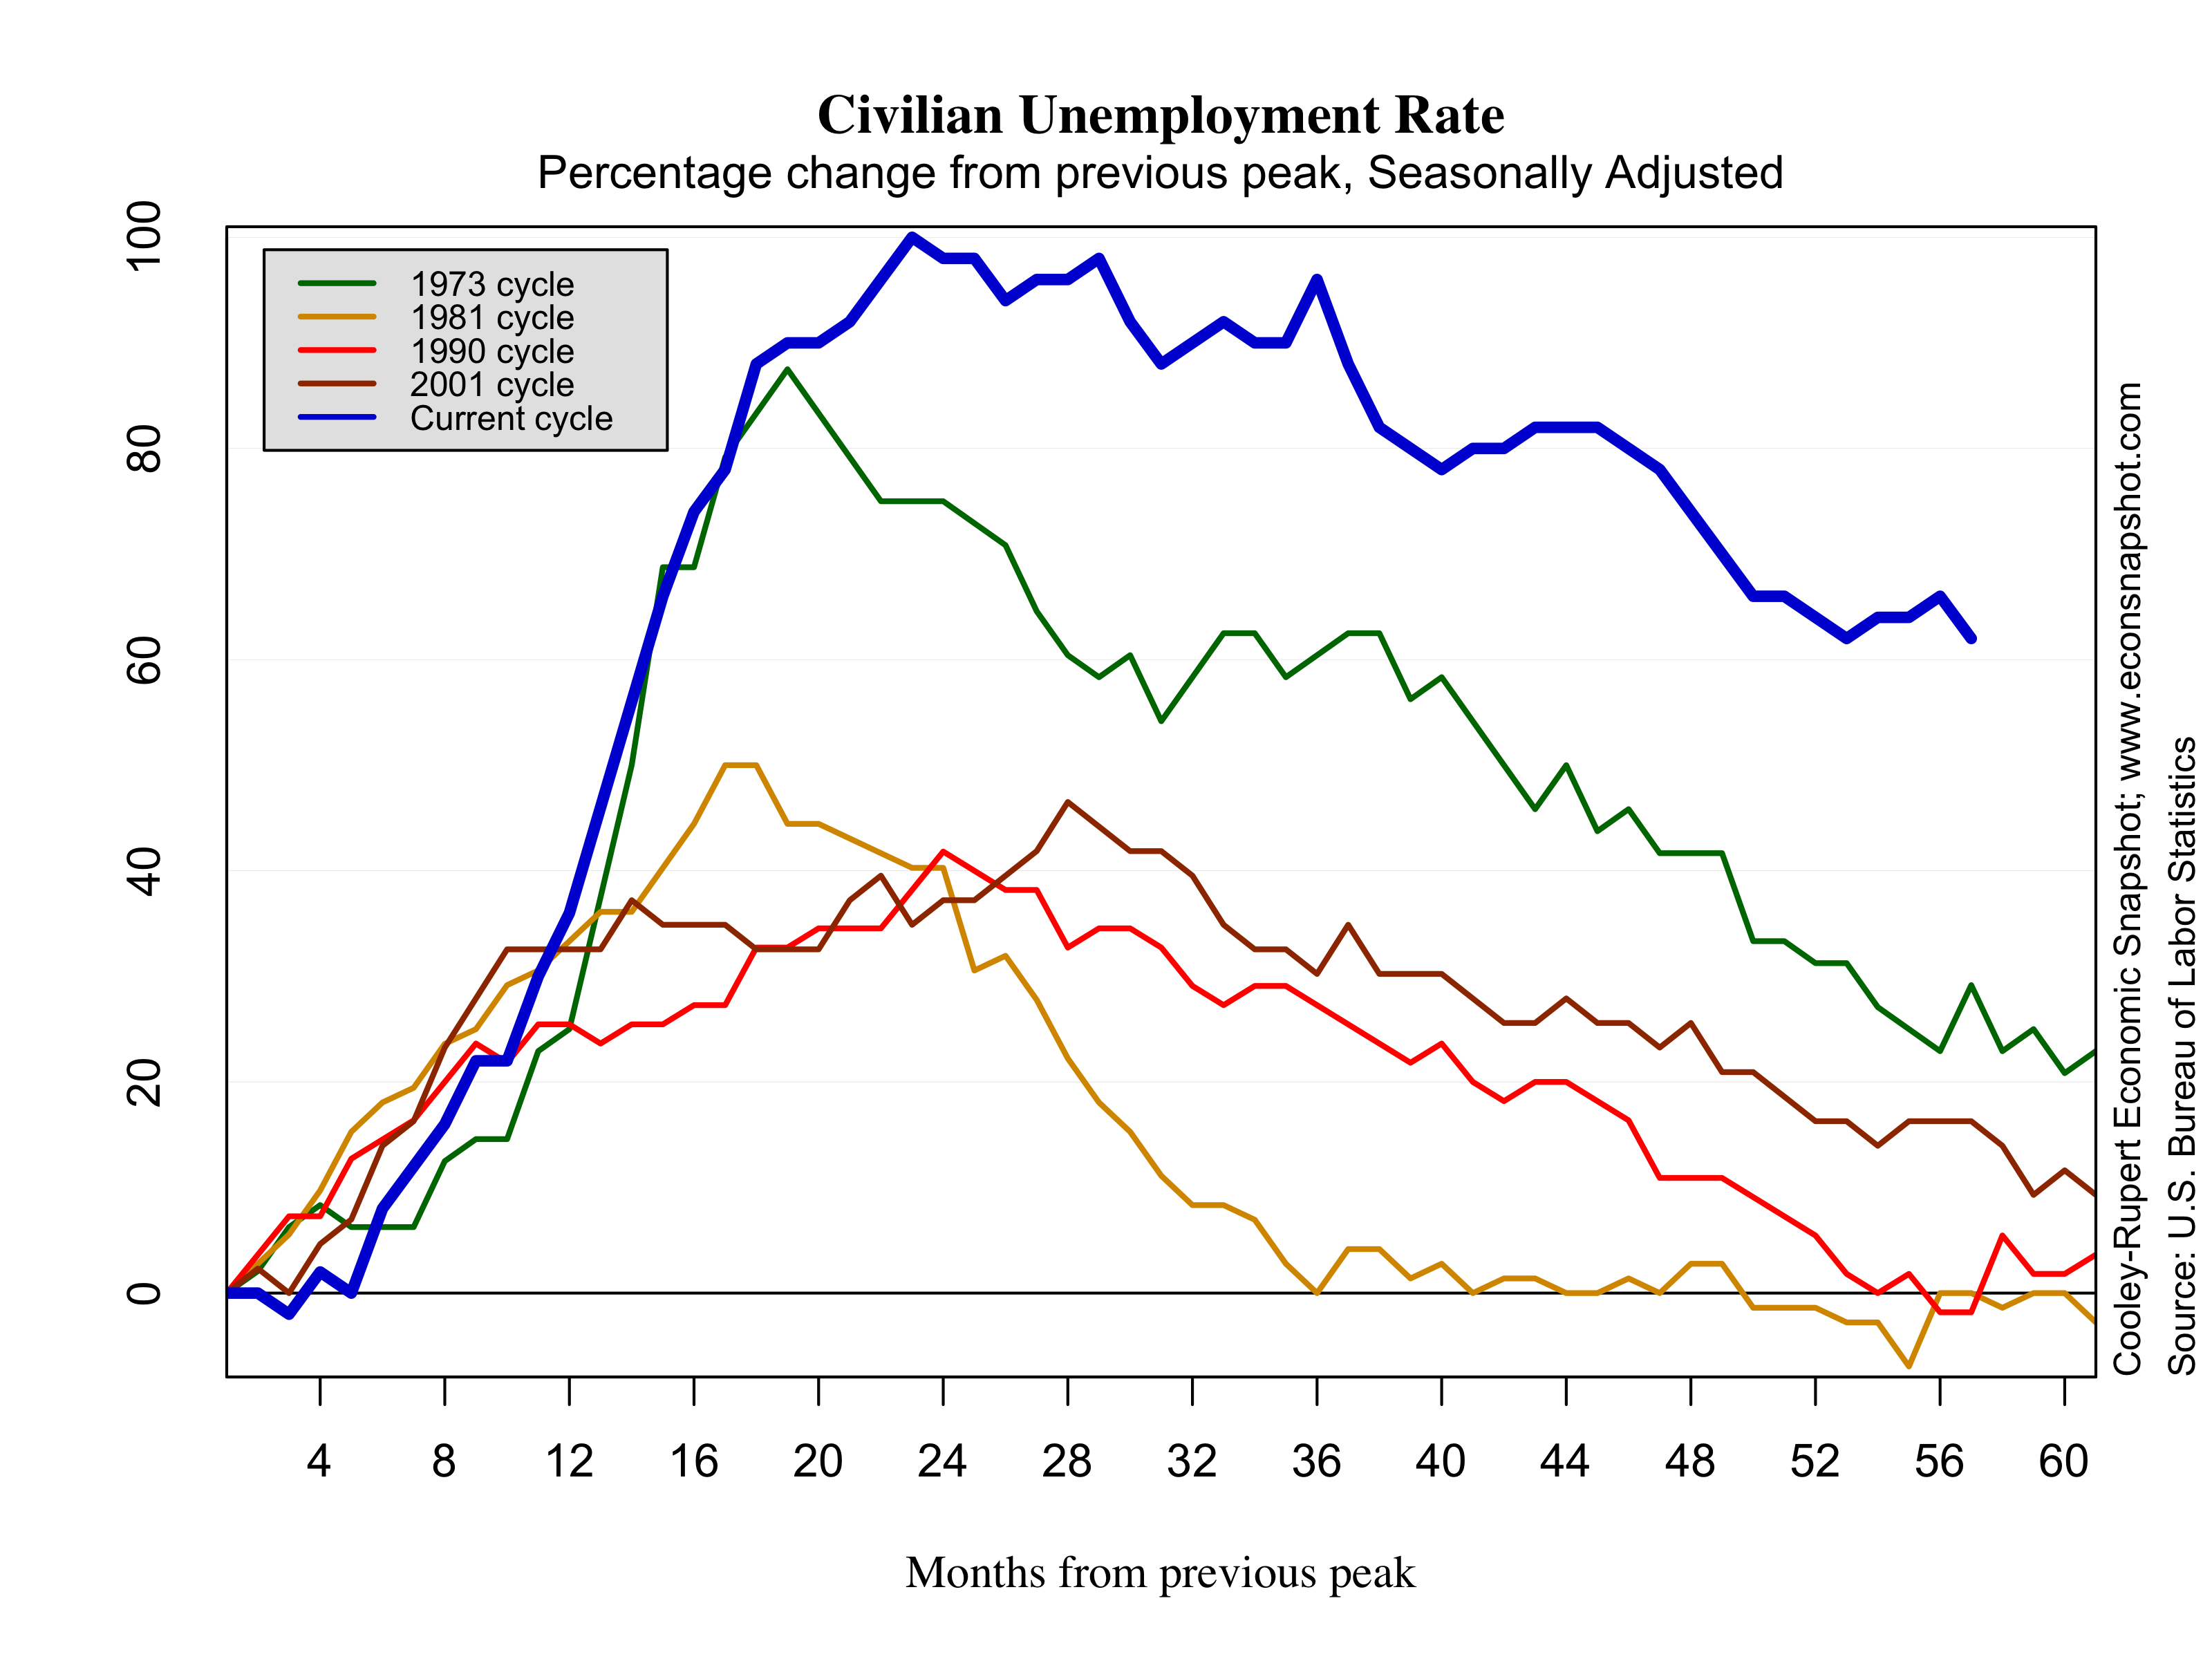
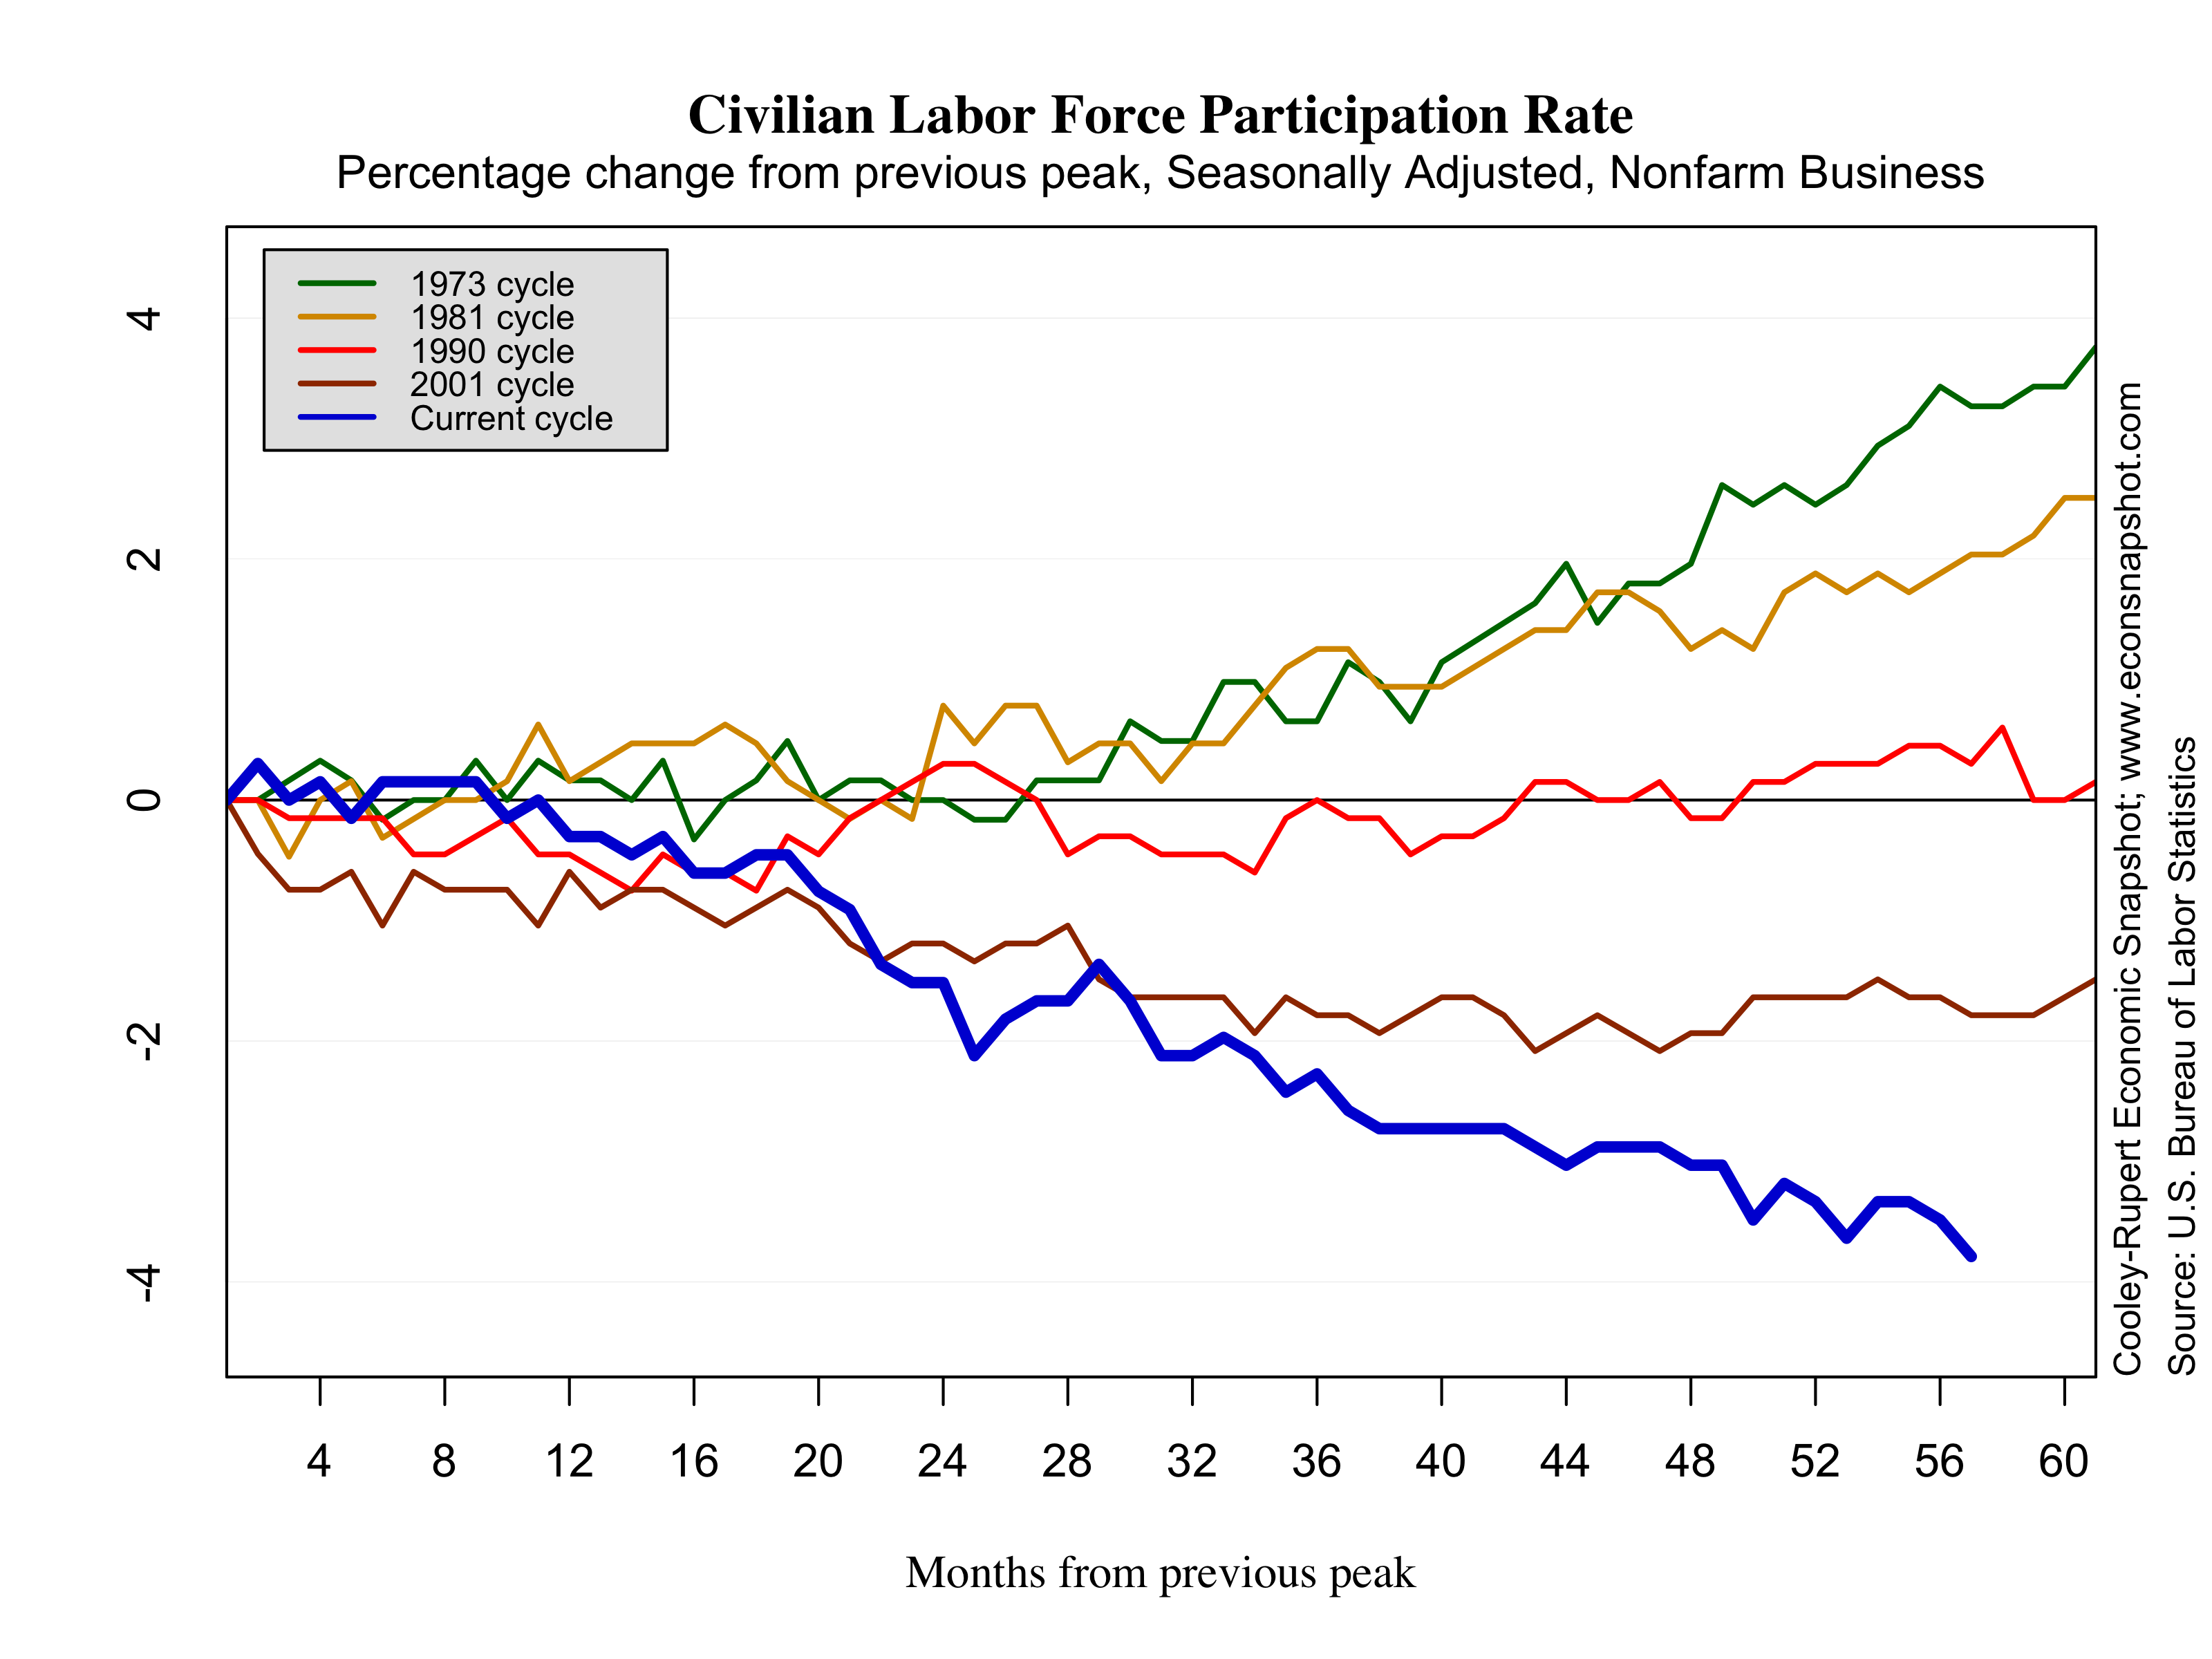
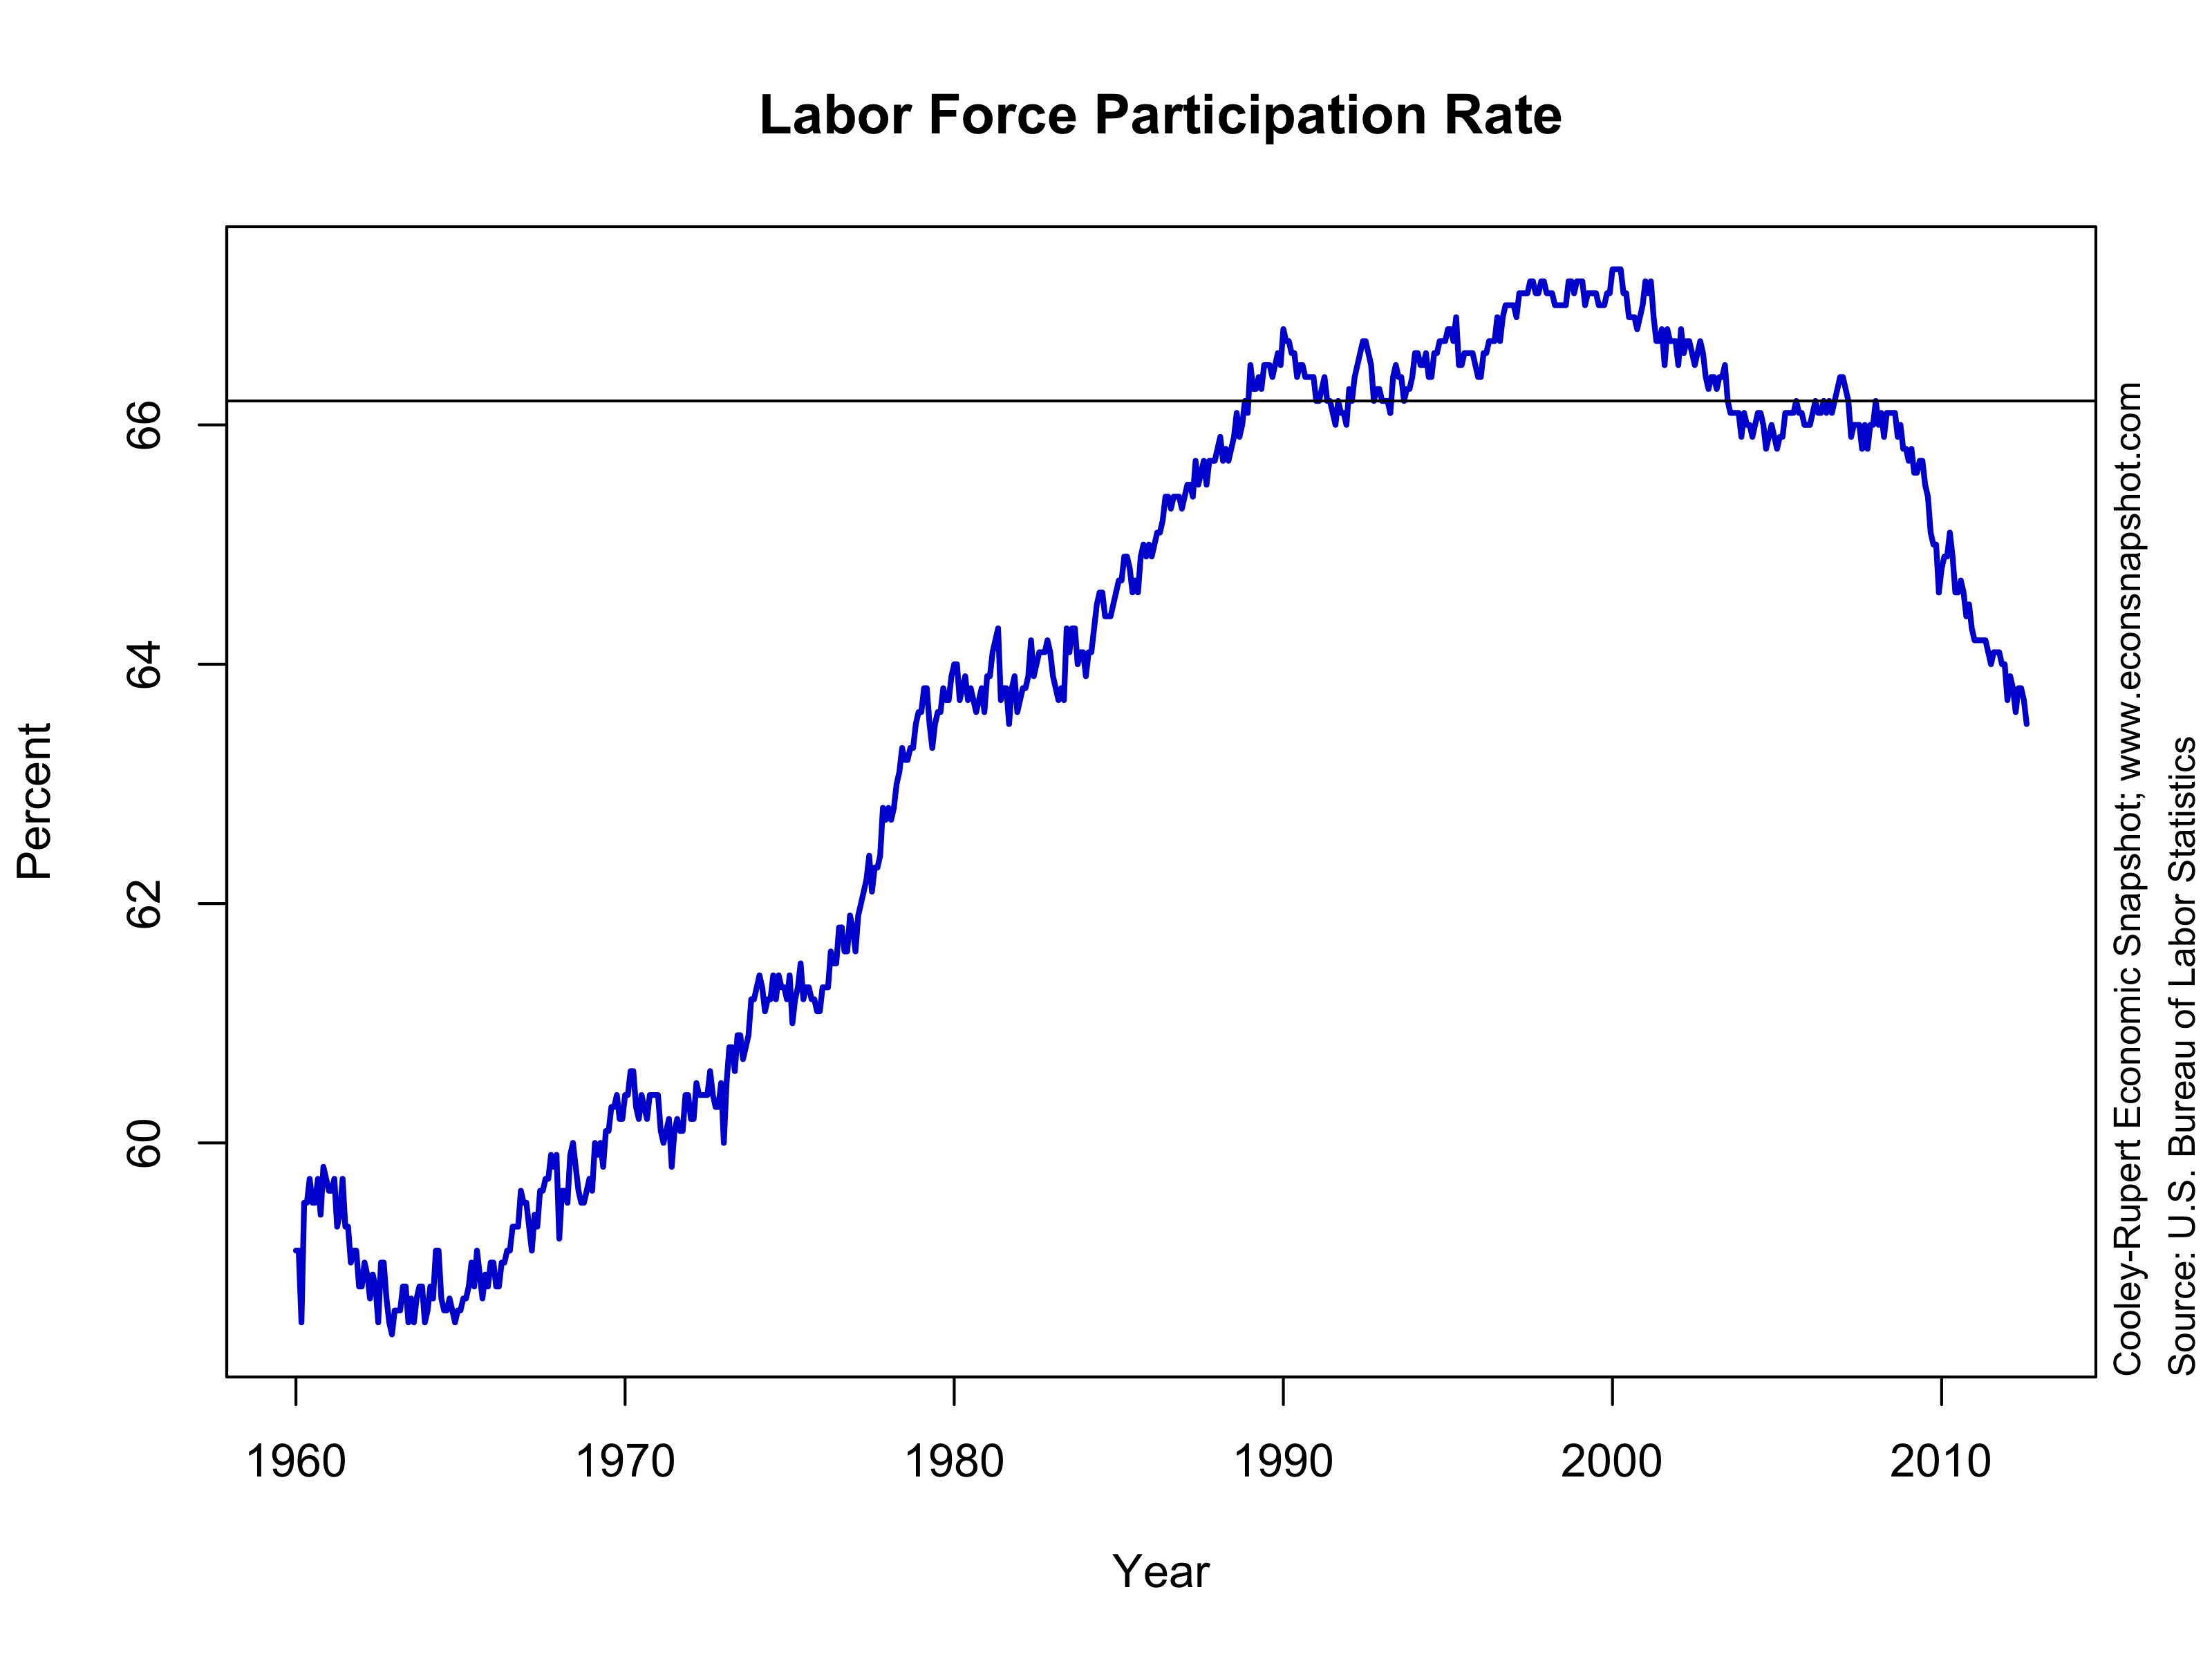
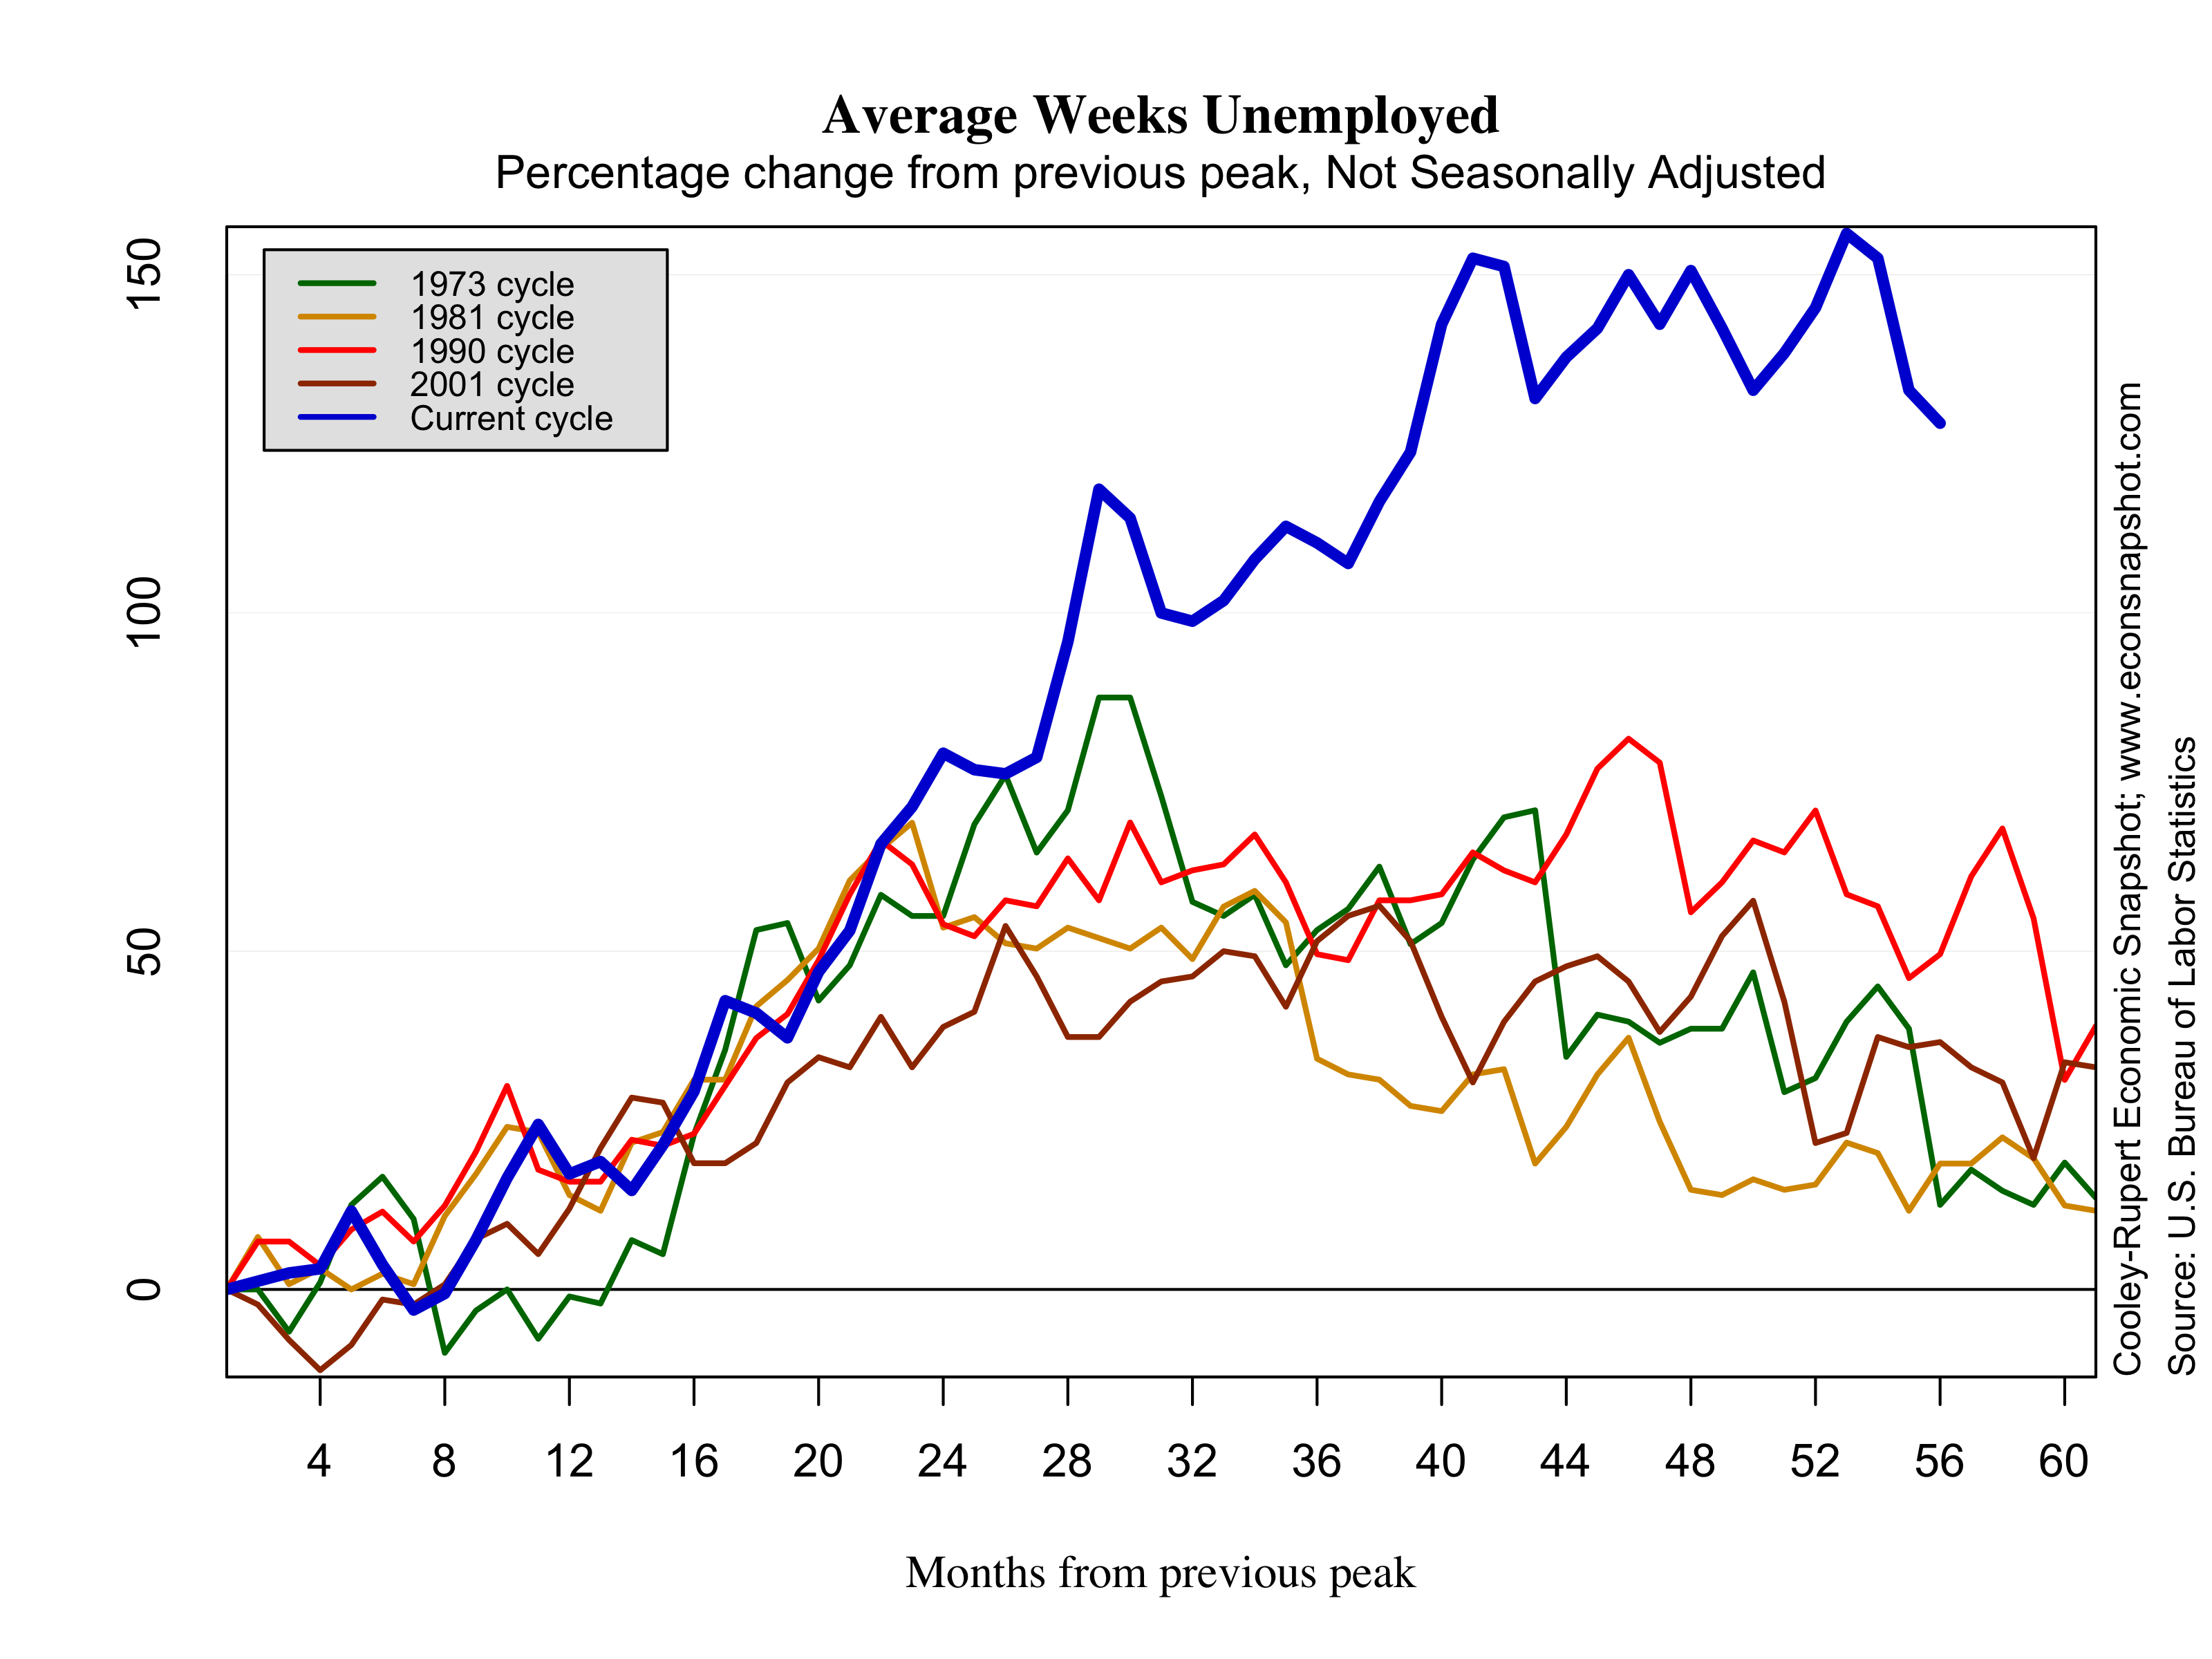
The household survey from the BLS revealed a slight decline in the unemployment rate, edging down to 8.1%. However, the number of unemployed persons remained about the same at 12.5 million and of those, about 40% are categorized as long-term unemployed, having been unemployed 27 weeks or longer. More discouraging perhaps is the fact that both the labor force (154.6 million) and the labor force participation rate (63.5%) fell. The last time the participation rate was this low was in June of 1979. It should be noted however that labor force participation began to decline around the year 2000 after rising steadily since the early 1960’s; but since the Great Recession has declined at a faster pace.
The employment to population ratio fell from 58.4 to 58.3. At the trough (June, 2009, according to the NBER) the employment to population ratio was 59.4. The ratio continued falling throughout 2009, however, reaching a low of 58.2 in December of 2009. We have not witnessed numbers so low since the early 1980’s.
As we have done in earlier posts, we use the Atlanta Fed’s Jobs Calculator to evaluate some likely scenarios of the state of the labor market come the November elections. The job’s calculator, in essence, does some back of the envelope calculations on what the monthly jobs number needs to average to reach a certain unemployment rate at a specified point in the future. After this morning’s August release, there will be only 2 additional months of data until people enter the voting booths in November.
The participation rate does not change very quickly, up or down by a tenth of a percentage in a month. So, let’s say that it increases to 63.6% in October and stays there. To keep the unemployment rate at its current value, 8.1%, the labor market would have to create about 223,000 jobs in September and October! Seem realistic? No? Ok, suppose employment grows by about 150,000 per month for the next two months (that also may be optimistic…we will see) the unemployment rate come election day will rise to 8.2%. However, if the ratio stays at 63.5%, the unemployment rate will remain about 8.1%.
With the large amount of discouraged workers as a result of long-term unemployment, it is hard to believe the participation rate won’t begin to increase at some point. Whether or not these discouraged workers will begin to look by November will have big consequences for the unemployment as well as the hopes of the presidential candidates.

