It’s Slow, but it’s Growth

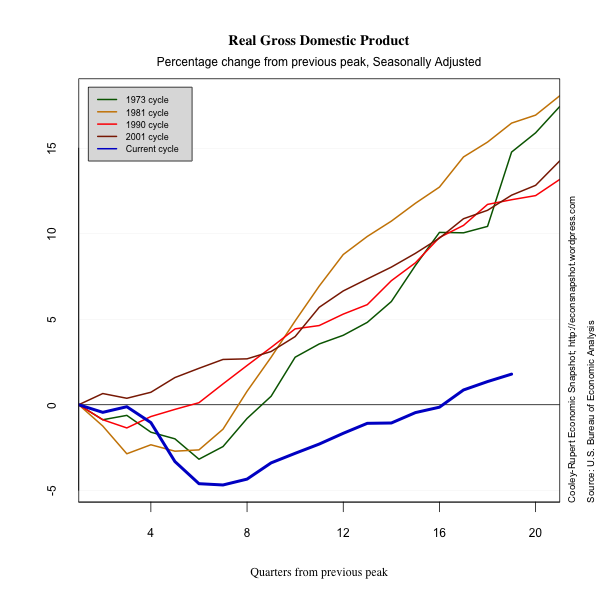
The Second Estimate of Q2 GDP, released on August 29 shows slow, continued growth in many areas, although there isn’t too much to remark on in the current release. The revision for GDP was up, 1.7% from 1.5%. Consumption was revised up the same, from 1.5% to 1.7%, led by an increase in the revision of services, from 1.9% to 2.4%. The graph below plots real GDP comparing this recession and recovery to past ones. A major theme of this blog is that to get an accurate snapshot of where the US economic recovery is, it is necessary to have a benchmark with which to compare. The graphs we present use the comparison of past cycles to guide our understanding of the current economic environment.

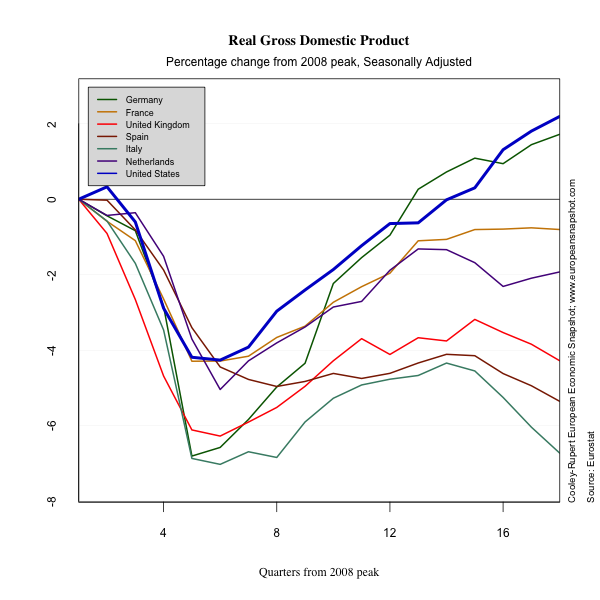
Many have commented on the slow growth coming out of the recession and that commentary is likely using the above comparison. Indeed this last recession and the current recovery stand out compared to any seen since the Great Depression. So, comparing against past recessions and recoveries is one way to put things into perspective. Certainly the crisis that struck the world at the end of 2007 and beginning of 2008 was unprecedented, save for the Great Depression. Not only in causes and scope, but also in its global reach. An interesting comparison might be to look at how several European countries have fared relative to the U.S. Each country felt the crisis in different ways and responded in different ways, leading to different outcomes. The graph below shows the percentage change of real GDP from the peak of the business cycle in Europe (2008 Q1) and the U.S. (2007 Q4).

In this perspective the US hasn’t fared so badly. The depth of the recession in the US was not as bad as that felt in Germany, Italy, or the UK. In terms of recovery, the US is on pace with Germany, around 2 percentage points above peak level. In fact, Germany is the only EU country pictured that has positive output growth, while the rest remain stagnant or are actually falling. The point here is that maybe, just maybe, the U.S. and Germany are doing as well as can be expected given the global environment. And yes, we always want more and we want it faster…but it might not be realistic.

Below we present a snapshot of the current recovery in terms of consumption, investment, government spending, exports and imports.
Continue reading “It’s Slow, but it’s Growth”
Snapshot – The July Employment Report and Unemployment Scenarios for November

Nonfarm payroll employment increased by 163,000 (the median forecast was around 100,000) in July after increasing a revised 64,000 in June and 87,000 in May. The unemployment rate edged up from 8.2% to 8.3%. This increase was in spite of a decrease in labor force participation which decreased from 63.8% to 63.7% and reflected another downward tick in the employment population ratio. Participation is now at historically low levels.

In our last snapshot of the labor market, we used the Atlanta Fed’s Jobs Calculator to evaluate some likely scenarios of the state of the labor market come the November elections. The job’s calculator in essence does some back of the envelope calculations on what the monthly jobs number needs to average to reach a certain unemployment rate at a specified point in the future.

After this morning’s July release, there will be only 3 additional months of data until people enter the voting booths in November. Employment gains are typically slightly higher in September and October than in the summer months, so if we are optimistic that employment will continue to increase by the same amount as it did in July, that would indicate that, by November, the unemployment rate will drop to around 7.92%. Sounds optimistic? It probably is.

This assumes that the labor force participation rate will remain historically low (at 63.7%). Since the peak of the business cycle in 2007 Q4, labor force participation has decreased by 2.3 percentage points (66% to 63.7%). That decrease is partly to attributed to long term demographic changes like the aging of the baby boomers. But a part of that decrease is certainly attributable to cyclical factors.  A large number of discouraged workers (those who would like to work, but have given up searching) still remain in the pool of people out of the labor force. The decisions of these workers  to begin searching for a job and enter the labor force is an important determinant of the unemployment rate.  Here are some other scenarios for November with different levels of the participation rate (assuming monthly job gains will be around 170,000).

  • If the labor force participation stays at 63.7%, the unemployment rate in November will be around 7.9%.
  • If the labor force participation increases to 63.9%, the unemployment rate in November will be around 8.2%.
  • If the labor force participation increases to 64%, the unemployment rate in November will be around 8.35%.
  • If the labor force participation increases to 64.1%, the unemployment rate in November will be around 8.48%.

As you can see small swings in the participation rate have large consequences for the unemployment rate  in November.