Are all jobless recoveries alike?
On Tuesday, the BLS released information on job openings, hires, and separations in April as reported in the Job Openings and Labor Turnover Survey. The job openings rate (the number of aggregate vacancies divided by total employment plus vacancies) decreased to 2.5% from 2.7% and the rate of hires (total hires divided by total employment) also decreased to 3.1% from 3.3%; two signs that the labor market is still having a difficult time recovering.
The JOLTS survey provides a more complete view of what comprises changes in total employment reported in the Employment Situation. The relationship between job openings and vacancies tells us to what extent employment growth is being affected by labor demand. If job openings and hires are growing at the same rate, then the counter-factual would be that hires could grow even faster if only there were more demand (job openings). Payroll employment increased by 77,000 in April (revised down from 115,000), a number that was seen to be far away from what is needed to bring the unemployment rate back down to pre-recession levels, and the numbers today highlight a little what is behind the constantly weak employment reports.
As we do elsewhere in the blog, the graphs below compare the path of both job openings and hires in the 2001 cycle versus the current one from the peak. Data only permits looking at the last two cycles, both of which have been characterized as having a particularly slow recovery in employment (popularly coined ‘Jobless Recoveries’). Looking at JOLTS openings and hires, both of these series seem to track each other fairly closely, at least from the peak. In this regard, one would be led to believe that whatever mechanism is causing the slow response of employment must have been present in both cycles, or that all jobless recoveries are made alike.
A different story emerges, however, if the focus turns only to the recovery aspect of the past two cycles, plotting the series relative to their respective troughs.
The first graph below shows the job openings and the hires rate from November 2001, the trough of that cycle. The two series closely tracked each other for at least 40 months during the recovery. This jobless recovery was also a vacancy-less recovery, a strong signal that one major cause of the slow employment growth during the first part of last decade was due to a weak demand for labor.
The second graph shows that same picture of job openings and hires but from June 2009, the trough of the current cycle. There is an obvious divergence between the rate of job openings and the rate of hires around June of 2010. The rate of which firms are willing to increase employment has far outpaced the number of actual hires, which has remained stagnant for the past two years. This tells the story that there is something besides a lack of demand causing the slow response of employment.
Some view this as a sign of mismatch in the labor market, when the skills demanded by firms differ from those possessed by the unemployed (see here, and here for an example and discussion). It’s difficult not to think the issue is structural, particularly if you look at the Beveridge curve shown below (the historical negative correlation between job openings and the unemployment rate). Highlighted is the same time frame from the previous two graphs. Clearly, there is a significant difference in the relationship between the two cycles. The behavior of the Beveridge curve during the first recovery was more in line with its behavior outside the cycle. However, from mid-2009, there has been a clear divergence from this pattern. A shifting out of the curve signals inherent inefficiency in matching vacant jobs to unemployed workers.
Even though all these signs point to mismatch, there still is little evidence that these factors are a major contributor to the either the divergence between job openings and hires or the shifting of the Beveridge curve (see here, here, and here for a few examples). In either case, understanding the difference between a jobless recovery and a vacancy-less recovery will be important to how we think about labor market policy.
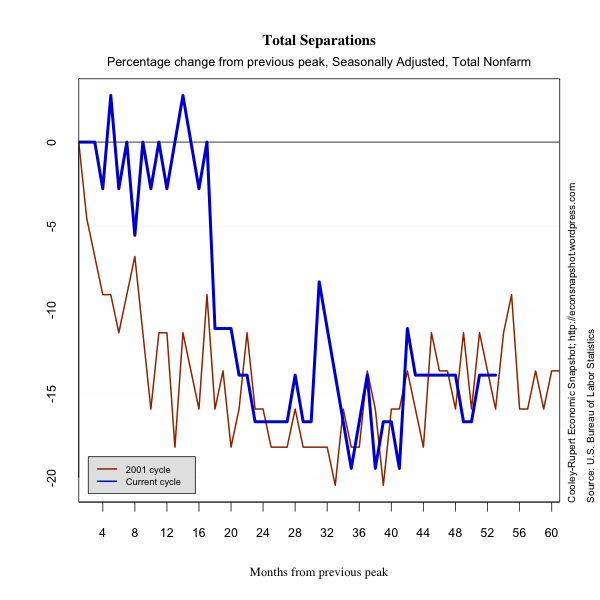
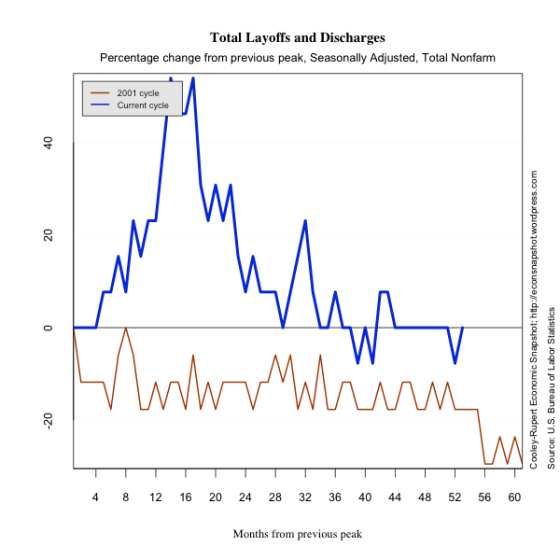
Below are plots of separations, quits, and layoffs.


