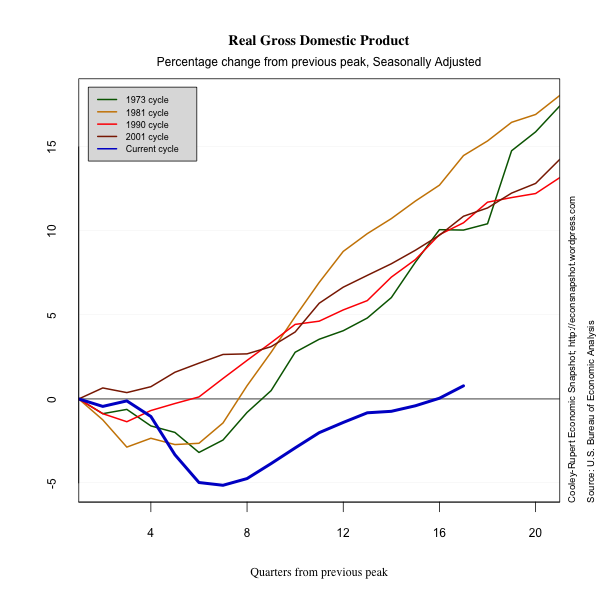
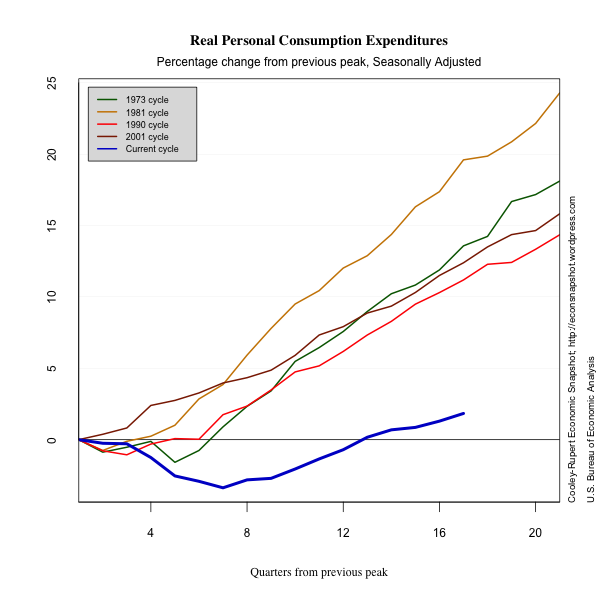
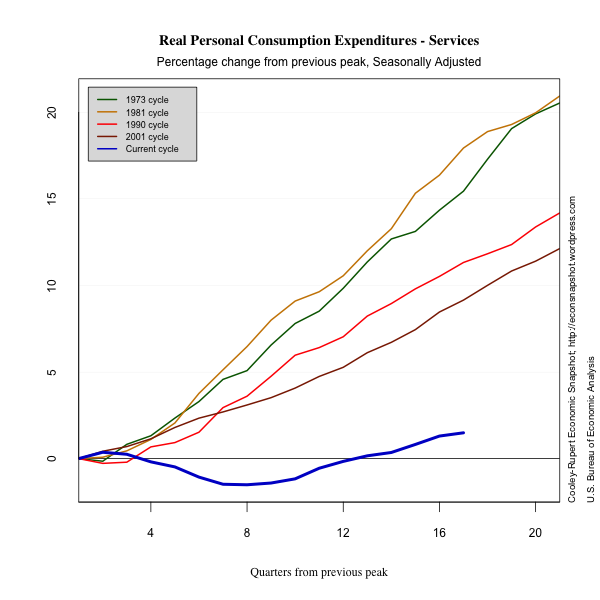
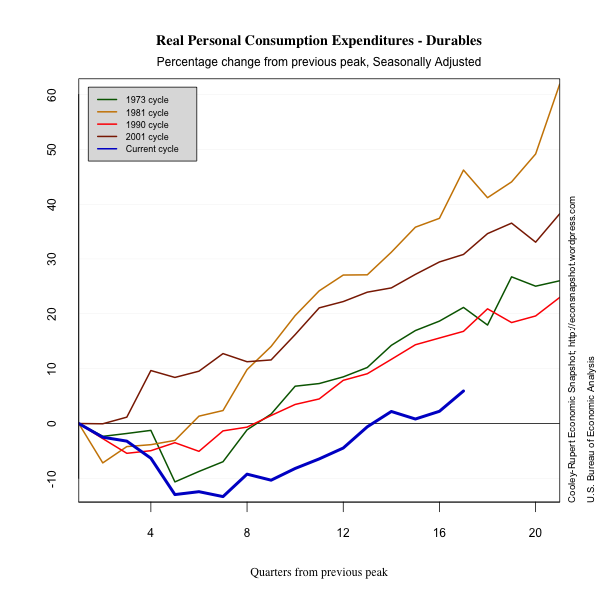
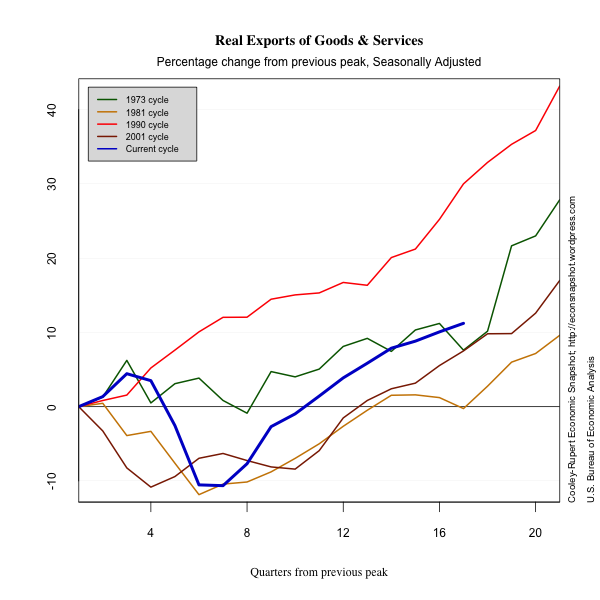
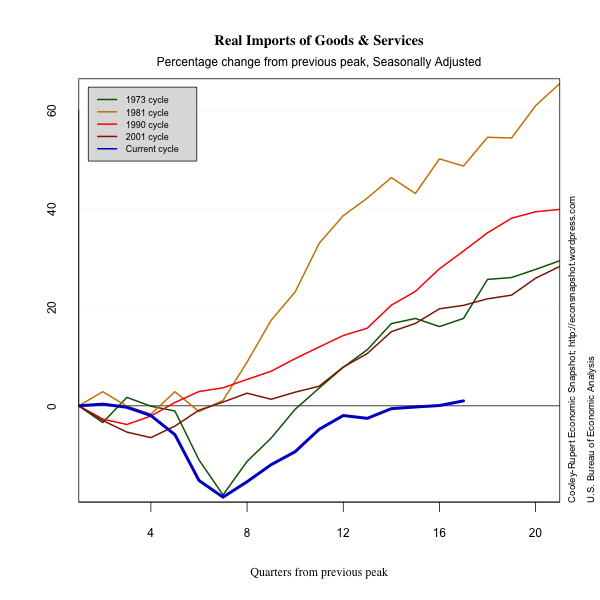
Welcome to the Cooley-Rupert Economic Snapshot, our view of the current economic environment. This is the latest version of our snapshot of the U.S. Economy based on the revisions to preliminary fourth quarter data on National Income and Product from the Bureau of Economic Analysis. As in previous snapshots we present the data in a way that we find particularly useful for assessing where we are in the business cycle and tracking the U.S. economic recovery. The paths of all the series presented are plotted relative to the their value at the peak of the respective business cycles. We use the business cycle dates identified by the National Bureau of Economic Research.
We present the data in four sections. The first summarizes the path of Gross Domestic Product and its components. This post primarily updates GDP and its components based on preliminary estimates of fourth quarter activity from the BEA. We also include the most recent labor market data and the summary of activity in credit markets. The final section summarizes the features of industrial production and inflation.
As always we welcome any suggestions for additional data that you would like to see and suggestions for how to improve the presentation of the data. Click here to go to the latest snapshot in one pdf document. Or, read on–
Fourth Quarter Revisions – Confirms Recovery…in What?
The “second” estimate of GDP and its components showed that real GDP grew at an annual rate of 3% in the fourth quarter of 2011. The growth rate was revised up from a preliminary estimate of 2.8%. The new estimate mostly reflected an upward revision in gross private domestic investment led by a revision to growth in nonresidential structures. The preliminary estimate showed nonresidential structures declining at an annual rate of 7.2%, while the second estimate showed it declining at a rate of 2.6%. As this is the only component of private GDP that experienced negative growth, the new revisions were largely optimistic.
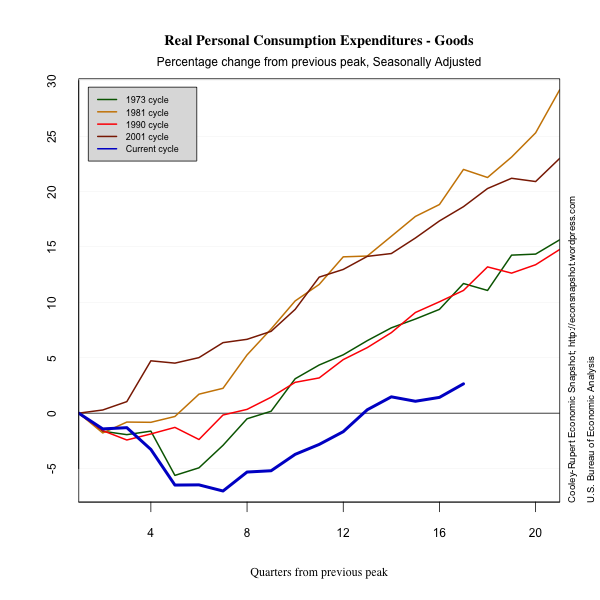
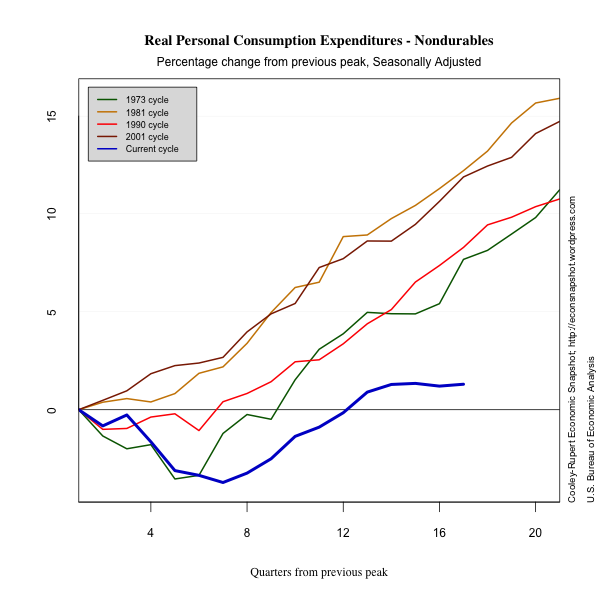
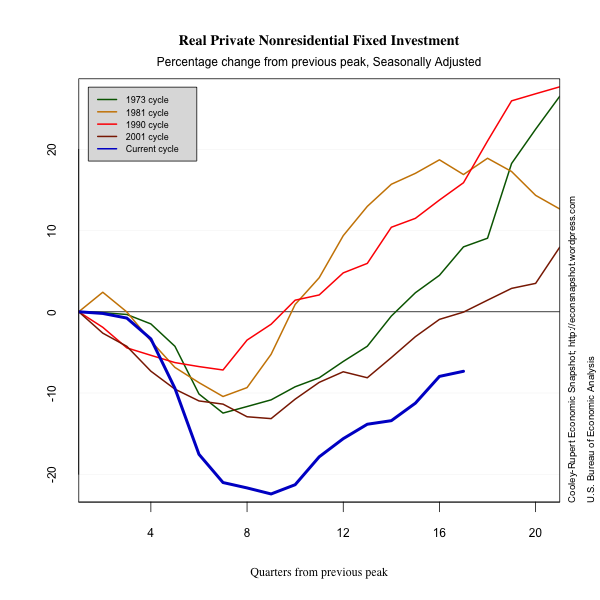
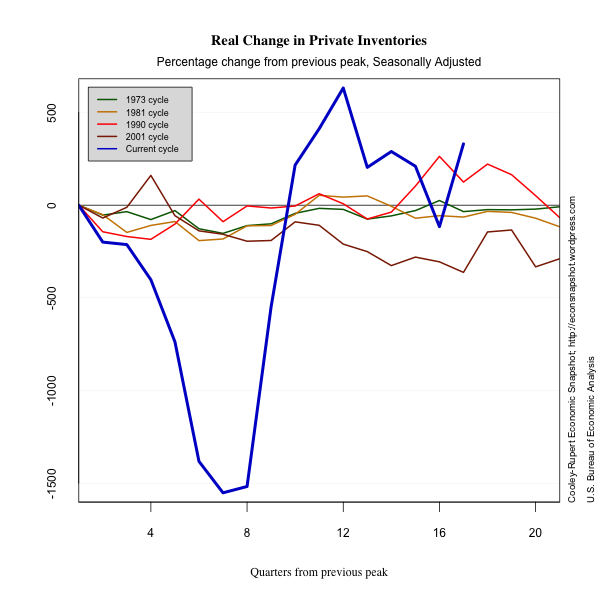
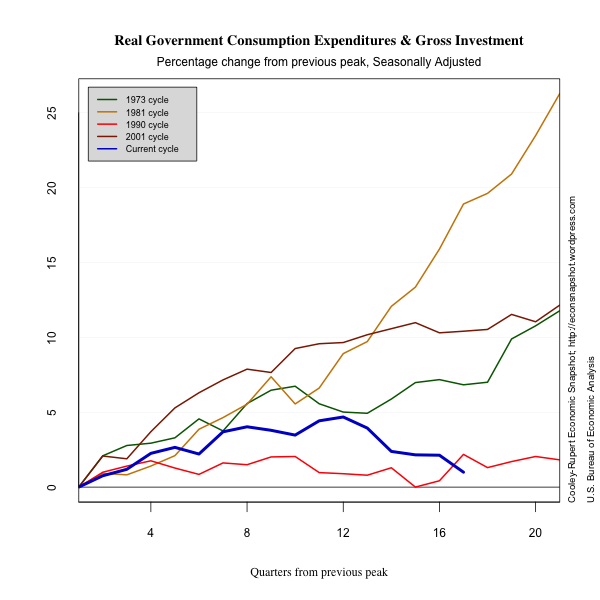
This newest data confirms that output growth has regained some momentum seen earlier in the recovery. The slowdown in growth led some to worry of a potential ‘double-dip’ recession as output sputtered in the first three quarters of 2011 (around 13 quarters after the peak of business cycle activity). The slowdown can clearly be seen across most components of GDP. The seasonally adjusted annualized quarterly percent change in Personal Consumption Expenditures (PCE) were 2.7%, 2.9%, 2.6%, and 3.6% for the four quarters in 2010 and then slowed to 2.1%, 0.7%, and 1.7%, for the first three quarters of 2011 then picked up some steam in the fourth quarter, growing at 2.1%. The slowdown is particularly evident in the graph for PCE-goods below. Investment even experienced negative growth after steady recovery, mostly led by a reduction in the change in private inventories. Government consumption and investment also started to show signs of decline beginning around the same time period.
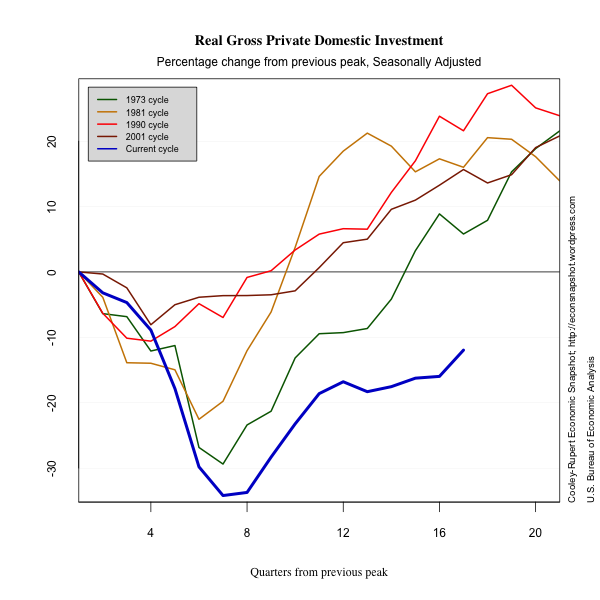
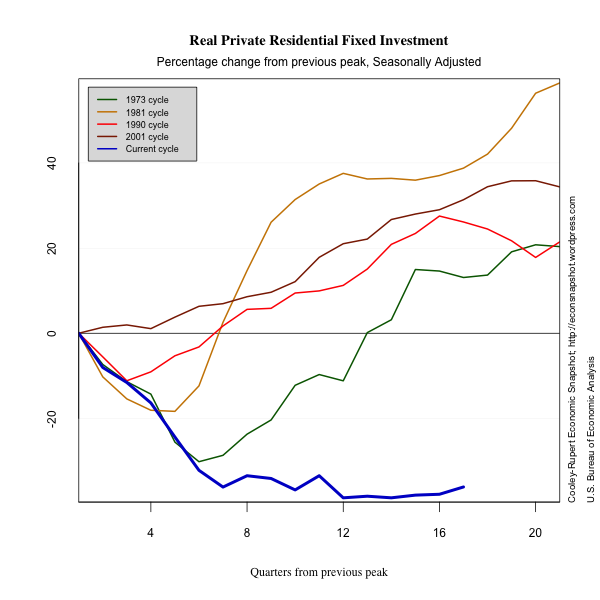
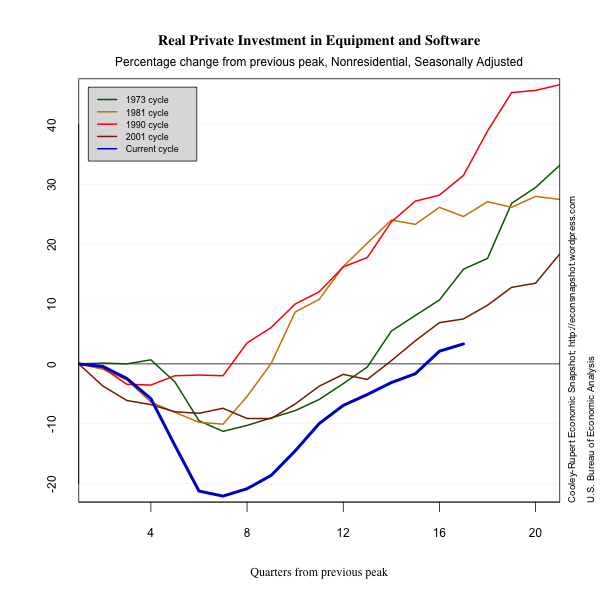
While the slowdown in the recovery was felt by most of the components in GDP, the regain in momentum was not. Nondurable goods never regained momentum, growing by an average of .4% in 2011 after averaging a growth of 3.1% during the initial part of the recovery. The recent growth in private investment can largely be attributed to an accumulation of inventories, and not to any noticeable recovery in residential or non-residential investment. Residential investment continues to remain approximately 40% below it’s level during the 2007 peak and is drastically different from its trend in the five most recent business cycles.
The Labor Market
January Employment Situation More Jobs, Unemployment Rate Down, Revisions Up
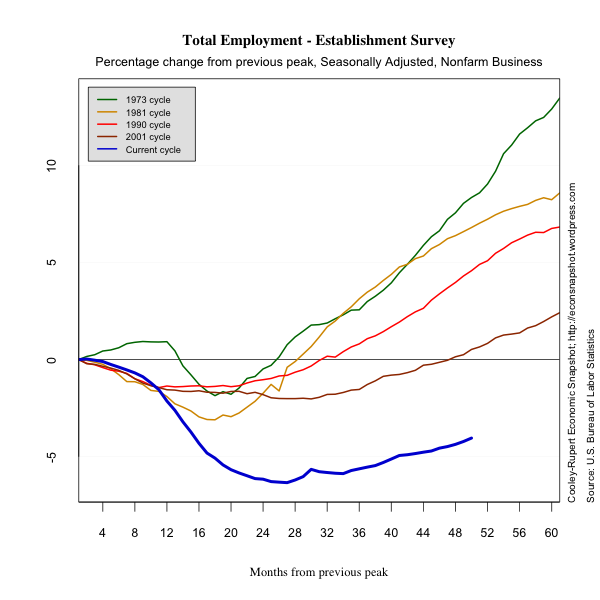
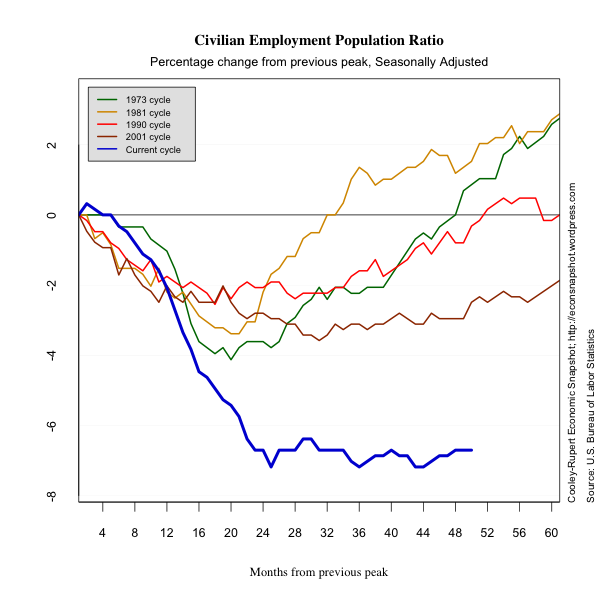
The January Employment Situation Report from the Bureau of Labor Statistics revealed broad-based upside surprises. Median expectations were on the order of 155,000 and the current increase for January is 243,000. Employment increased across all sectors, save Government. In addition, revisions to both November (+57,000) and December (+3,000) were both on the upside. While the unemployment rate fell to 8.3%, the employment to population ratio remained at 58.5% and the labor force participation rate fell to 63.7% from 64.0% in December. However with the BLS added population controls the employment population ratio increased and participation stayed constant.
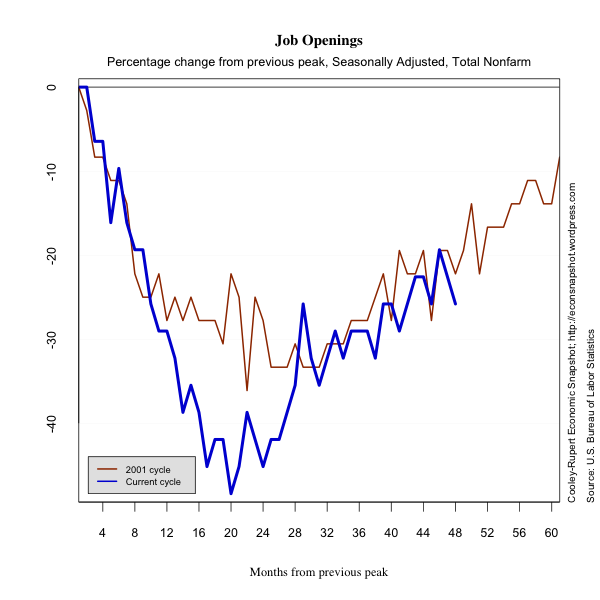
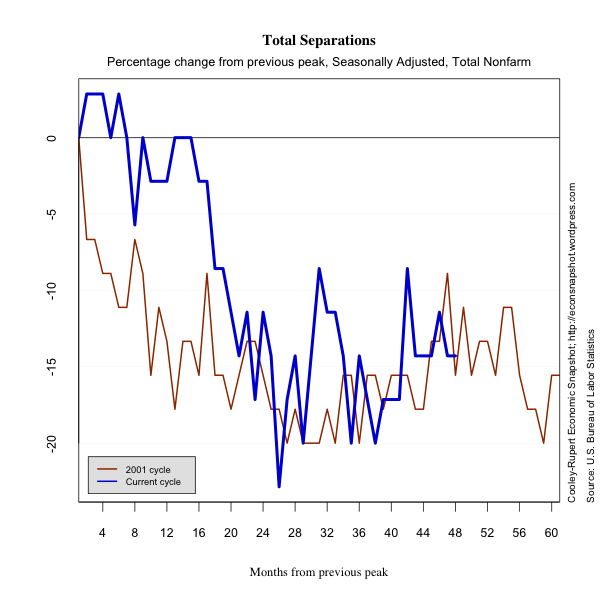
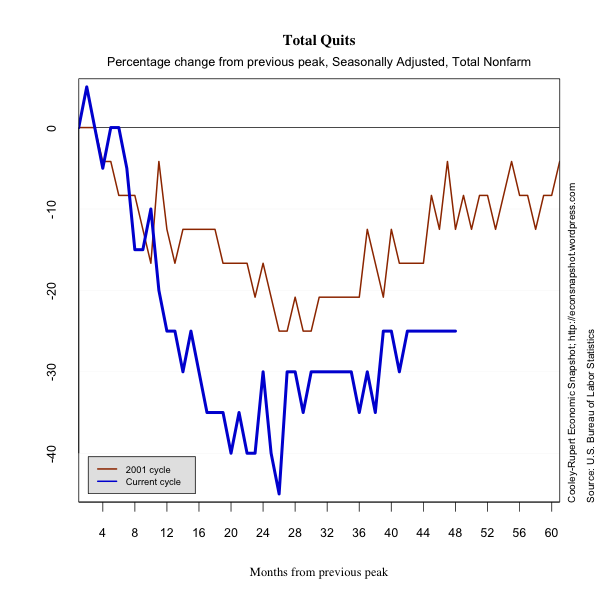
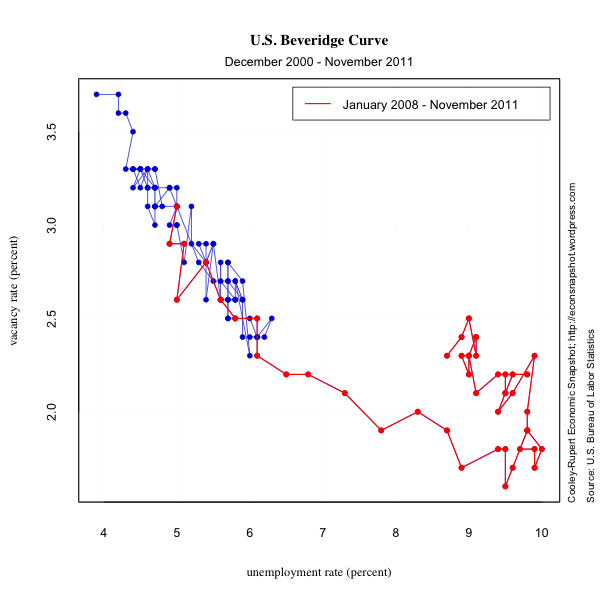
While the labor market still has a ways to go to return to its pre-recession levels, the jobs numbers are encouraging. We also include data from the Job Openings and Labor Turnover Survey (JOLTS). The survey is designed to show more refined features of the labor market including the rate of hires and separations. The series only allow comparison to the 2001 cycle, but show that along several dimensions the labor market resembles its performance during the 2001 cycle.

 Credit Markets
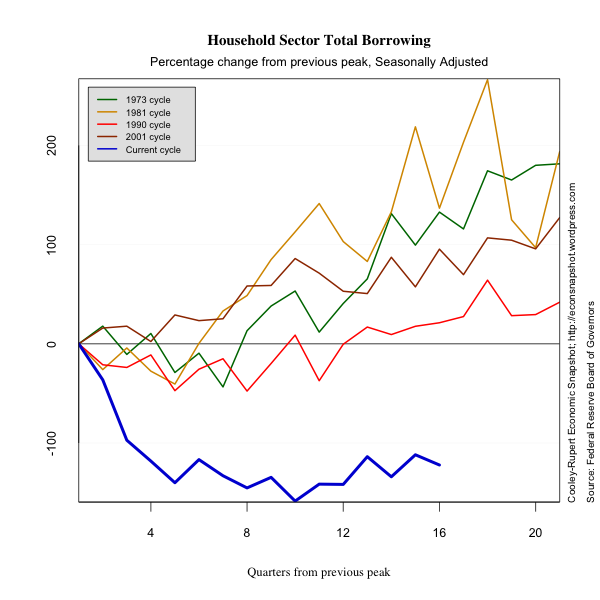
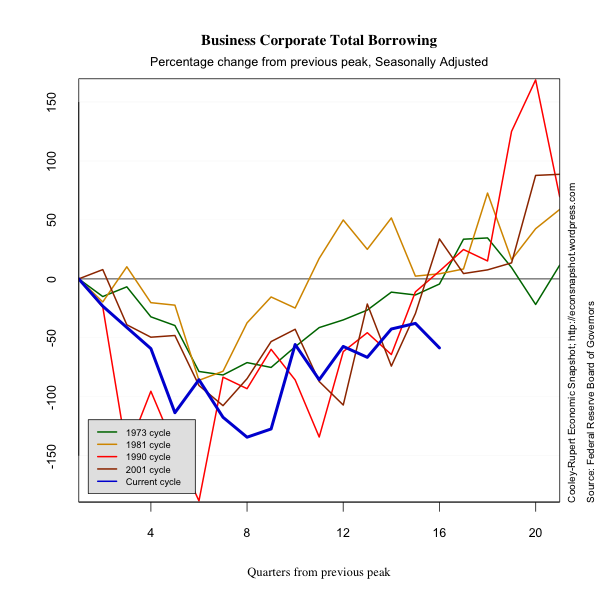
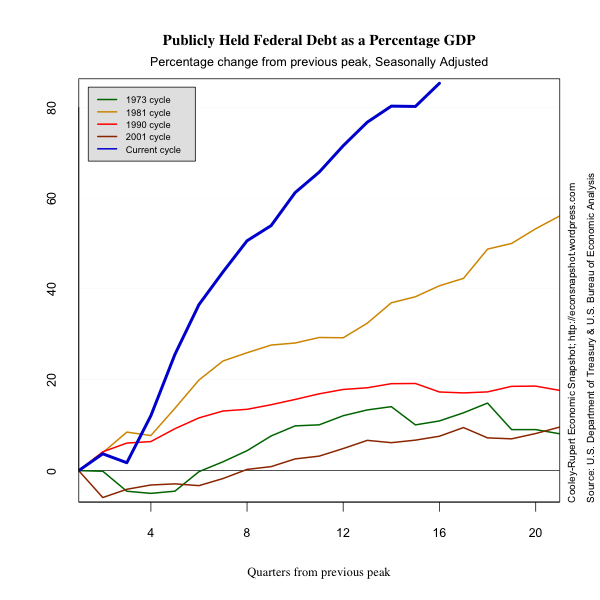
Credit markets continue to show the after-effects of the tremendous increase in leverage the took place prior to the 2007-2009 crisis. Households are continuing to reduce their debt and at an increasing rate. Household borrowing is very low and shows no sign of picking up. Corporate sector borrowing is falling again and corporations continue to lower their debt. The big story in credit markets is the dramatic shift of leverage to the public sector. Public sector debt outstanding is increasing at a faster rate.
*Note 2/9/2012: The graphs for household debt outstanding as a % of GDP and business corporate outstanding as % of GDP were updated. Previous graphs contained errors and were wrong.
Industrial Production and Inflation
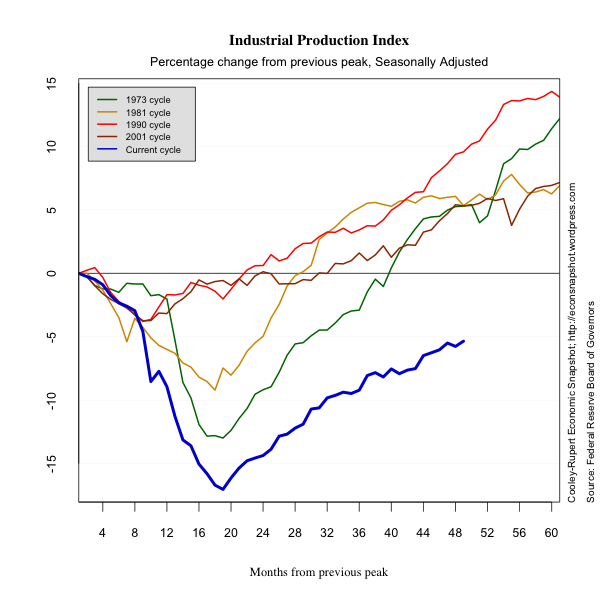
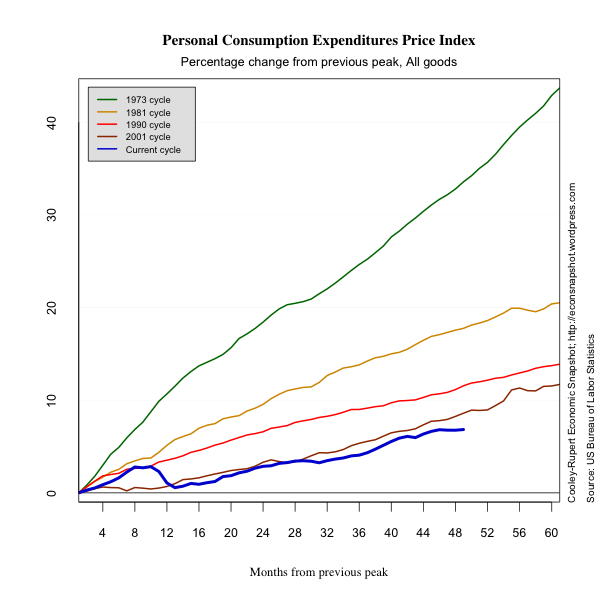
In this section we present some plots of miscellaneous series that reflect other characteristics of this business cycle. The decline in industrial production is dramatic. There is no evidence of inflation or deflation.
Glossary
Compensation includes accrued wages and salaries, supplements, employer contributions to employee benefit plans, and taxes.
Consumer Price Index measures the price paid by urban consumers
for a representative basket of goods and services. Prices are collected from 87 urban areas and from approximately 23,000 retail and service establishments.
Debt Outstanding measures the current level debt owed on credit market
instruments. Credit market instruments include open market paper, Treasury securities, agency and GSE-backed securities, municipal securities, corporate and foreign bonds, bank loans, mortgages, and
consumer credit.
Durables are goods that have an average useful life of at least 3
years.
Employment Population Ratio is the ratio of the number of
civilians in the labor force to the total civilian population.
Exports consist of goods and services that are sold or
transferred by U.S. residents to foreign residents.
Goods are tangible commodities that can be stored or inventoried.
Government Consumption Expenditures and Gross Investment measures
current consumption expenditures by the government in order to produce goods and services to the public and investment in structures and equipment and software.
Gross Private Domestic Investment measures additions and
replacements to the stock of private fixed assets without deduction of
depreciation.
Imports consist of goods and services that are sold or
transferred by foreign residents to U.S. residents.
Industrial Production Index measures real output of
manufacturing, mining, and electric and gas utilities industries.
Job Openings or Vacancies are all positions that are open (not
filled) on the last business day of the month.
Labor Force is defined as the number of unemployed persons plus
the number of employed persons.
Labor Force Participation Rate is the ratio of unemployed persons
to the number of persons in the labor force.
Net Worth equals to total assets minus total liabilities. Assets
include owner-occupied real estate, consumer durables, and equipment and software owned by nonprofit organizations.
Nondurables are goods that have an average useful life of less
than 3 years.
Nonresidential Fixed Investment measures investment by businesses
and nonprofit institutions in nonresidential structures and in equipment and software.
Personal Consumption Expenditures measures the value of goods and services purchased by households, nonprofit institutions that primarily serve households, private non-insured welfare funds, and private trust funds.
Residential Fixed Investment measures investment by businesses and households in residential structures and equipment, primarily new construction of single-family and multifamily units.
Services are commodities that cannot be stored or inventoried and
that are usually consumed at the place and time of purchase.
Total Borrowing measures the flow of new credit market liabilities during the period. Credit market liabilities include open market paper, Treasury securities, agency and GSE-backed securities, municipal securities, corporate and foreign bonds, bank loans, mortgages, and
consumer credit.
