Welcome to the Cooley-Rupert Economic Snapshot, our view of the current economic environment. This is the latest version of our snapshot of the U.S. Economy based on the preliminary fourth quarter data on National Income and Product from the Bureau of Economic Analysis as well as the January Employment Situation released by the Bureau of Labor Statistics. As in previous snapshots we present the data in a way that we find particularly useful for assessing where we are in the business cycle and tracking the U.S. economic recovery. The paths of all the series presented are plotted relative to the their value at the peak of the respective business cycles. We use the business cycle dates identified by the National Bureau of Economic Research.
We present the data in four sections. The first summarizes the path of Gross Domestic Product and its components. This post primarily updates GDP and its components based on preliminary estimates of fourth quarter activity from the BEA. We also include the most recent labor market data and the summary of activity in credit markets. The final section summarizes the features of industrial production and inflation.
As always we welcome any suggestions for additional data that you would like to see and suggestions for how to improve the presentation of the data. Click here to go to the latest snapshot in one pdf document. Or, read on–
How bad is this recession and how should we assess the recovery?
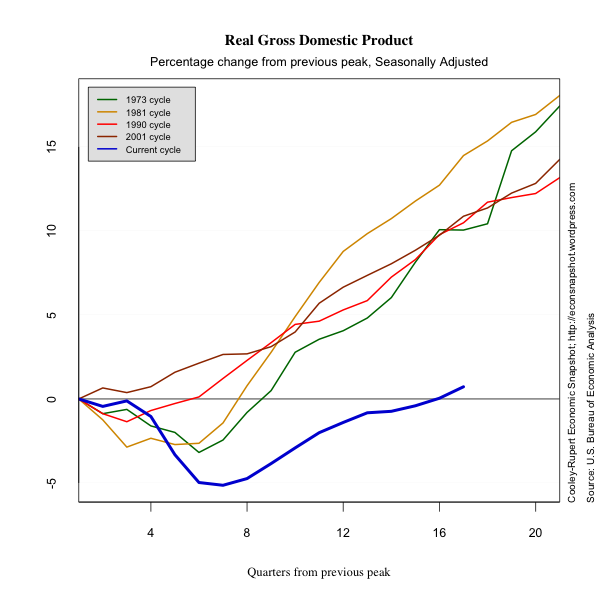
The preliminary estimates of fourth quarter GDP and its components show that the economy picked up a little momentum with GDP increasing at an annual rate of 2.8% compared to the rather anemic 1.8% growth rate in the third quarter. We should caution that preliminary estimates have been revised downward in both of the previous two quarters, so the 2.8 percent figure could be optimistic. The figure below shows that the recovery has now brought GDP above the previous peak.
Several things become apparent when looking at the above picture. First, the length of the downturn of the current cycle was close to what it has been in previous cycles. However the depth was much more severe bringing real GDP more than 5% below its peak level. Second, and more discouraging, the length of the recovery has been much longer and the pace much slower. It has taken 16 quarters for real GDP to reach its previous peak level. In all other post-war cycles, the longest GDP has taken to reach previous peak was 8 quarters during the 1973 cycle. It is obvious why this last episode has been called the “The Great Recession,” but we may want to add to that “The Abysmal Recovery.”
While it is useful to know the beginning and ending dates of a cycle, there is no standard by which to characterize the severity (for lack of a better word), i.e., the length and depth. In other words, we lack a metric to compare the various cycles.
As an example, absent the financial crisis and the recession, the U.S. economy would have continued to grow. Figuring out the rate at which it would have grown is somewhat of an issue but if we assume the economy would have continued to grow at average post 1950 rate for the U.S. economy then real GDP for the fourth quarter of 2011 would have been $15.018 trillion compared to $13.422 trillion in constant (2005) dollars. When one is assessing the severity of this recession it is not enough to measure the gap relative to a previous peak.
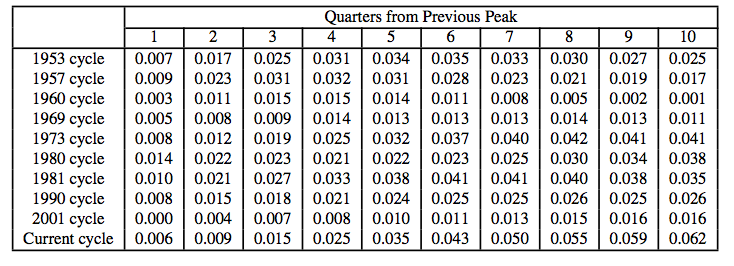
Below we present a graph of potential growth paths from the peaks of each cycle since 1950. As in the example above, we present an estimate of the cost at each quarter as the sum of the percentage losses in GDP relative to its long term growth path from the previous peak. This is seen in the following table. This measurement is certainly an upper bound on the cost.
Table 1: Cumulative Percentage of Output Lost Relative to Trend
With this cumulative measure we can compare the severity of business cycles at various stages. As you can see, the table suggests that the current cost of this recession is 7.6% of cumulative GDP since 2007 Q4. That comes out to a cost of $4.57 trillion constant 2005 dollars. That is, this number represents the cumulative difference between the output we could have had, had we grown at the average rate since 1947 from the peak of the cycle in December, 2007, and the actual GDP number. This is a very costly recession – nearly a third of a years GDP lost so far with more to come.
One can also see the very different characteristics of earlier business cycles. The 1957 and 1981 cycles were very sharp – more so than the current cycle -with the loss of GDP being realized very quickly. But the recovery was also much sharper.
As costly as this recession has been it is nothing like the Great Depression. Four years into the depression the cumulative output loss was 20.3% of real GDP – nearly three times the loss in the current downturn – and at that point the bottom hadn’t been reached.
The Components of GDP
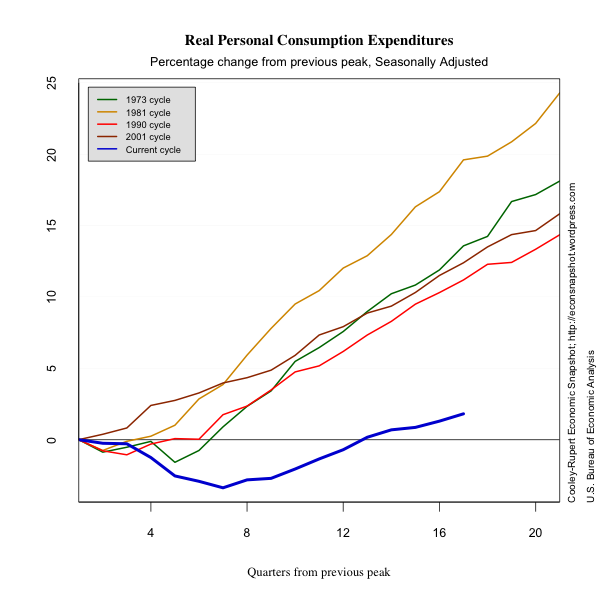
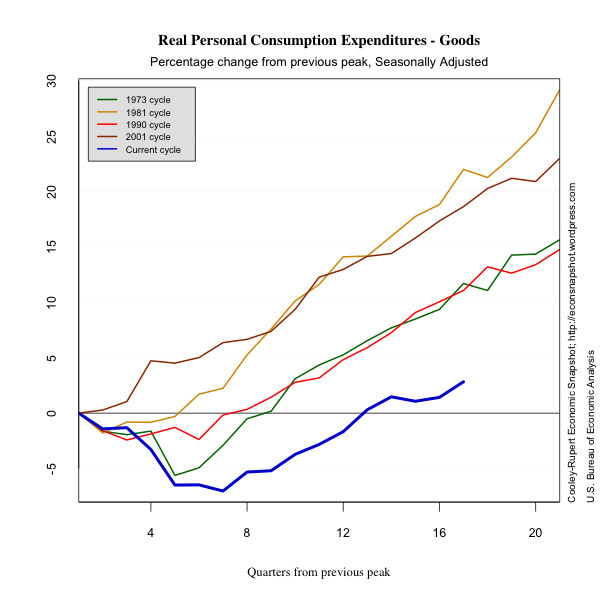
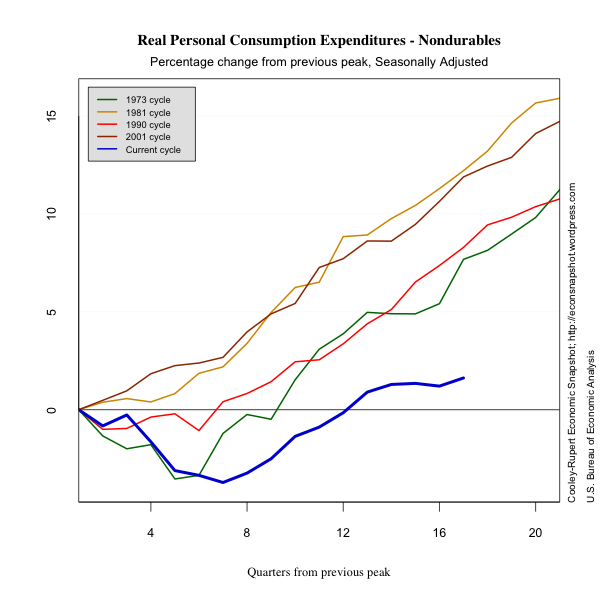
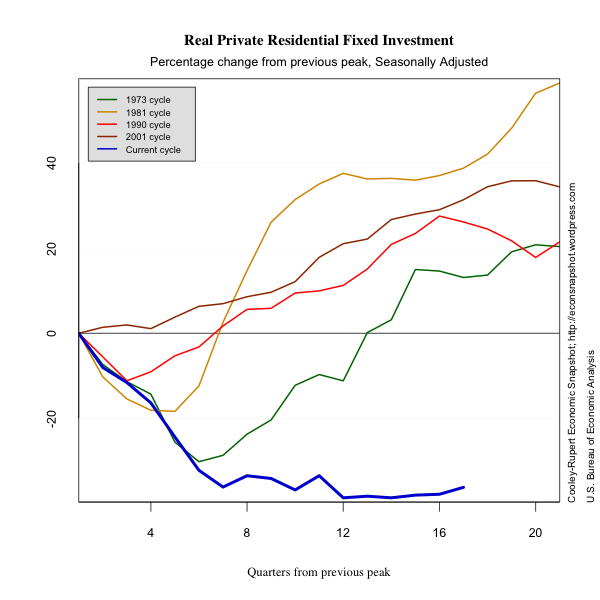
The most recent GDP numbers are based on the preliminary data on economic activity for the fourth quarter. They show encouraging signs of a strengthening economy even in an overall environment that has many challenges and much uncertainty. The fourth quarter growth was due in large part to Private Domestic Investment. Most of this was an increase in inventories that may end up weighing on growth in the current quarter. There were also modest increases in equipment and software. Some of the increase in GDP was due to increased consumption of consumer durables, particularly automobiles.Fixed Private Residential Investment continues to be totally stagnant at $337 billion, a level that remains about 40% below the previous peak. Since there is currently no compelling scenario under which residential investment is likely to recover this will continue to drag down the economy for many quarters to come. In no other post 1970 recession did it fall so far and continue to stagnate nearly four years since the recession began. The last time residential investment was this low was in 1996 when GDP was slightly more than half what it is now.
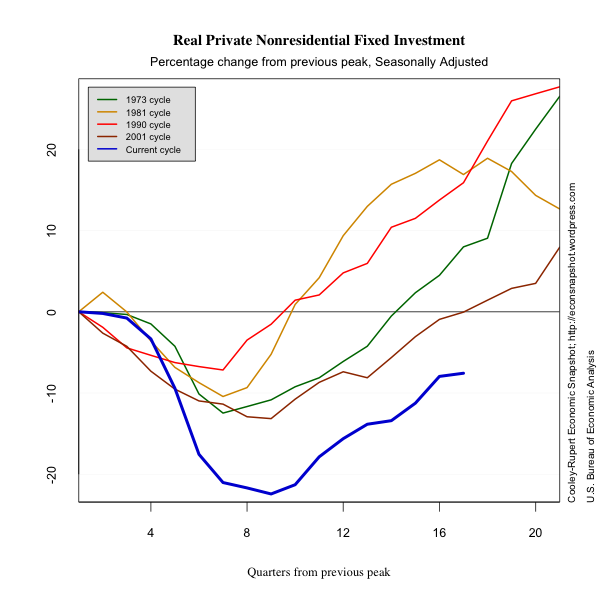
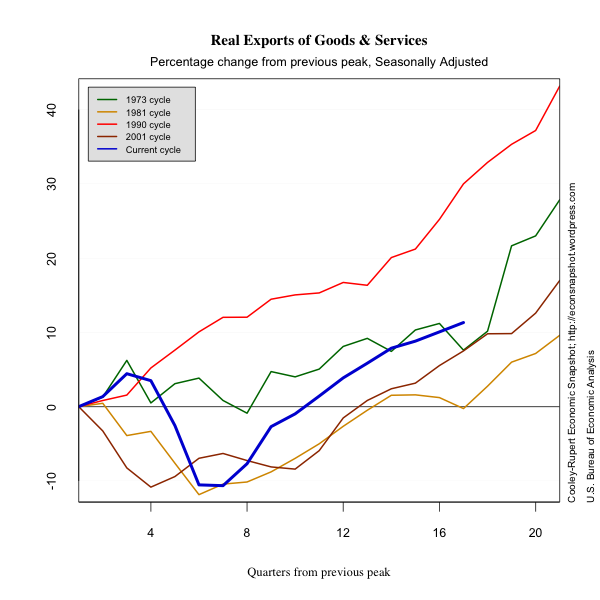
Investment in Equipment and Software continues to improve but it would have to be nearly a third larger to counter the decline in residential investment. Exports are increasing and Imports are evolving in a way that is typical of previous recessions. Government consumption continued to decline significantly with the bulk of the decrease due to declining defense expenditures.
The Labor Market
January Employment Situation More Jobs, Unemployment Rate Down, Revisions Up
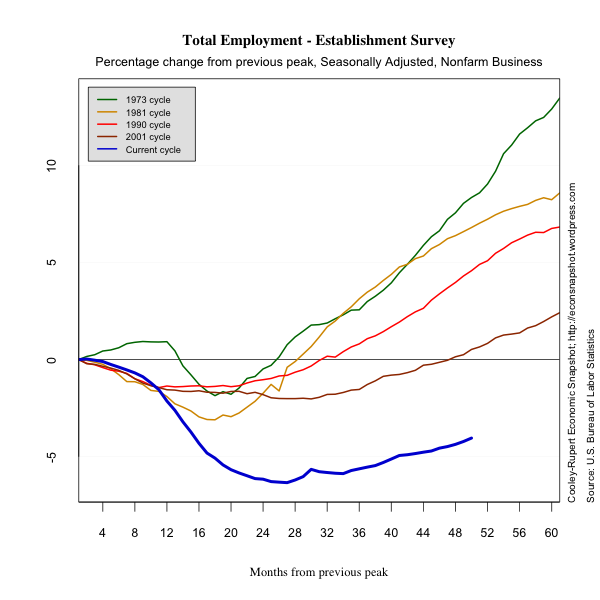
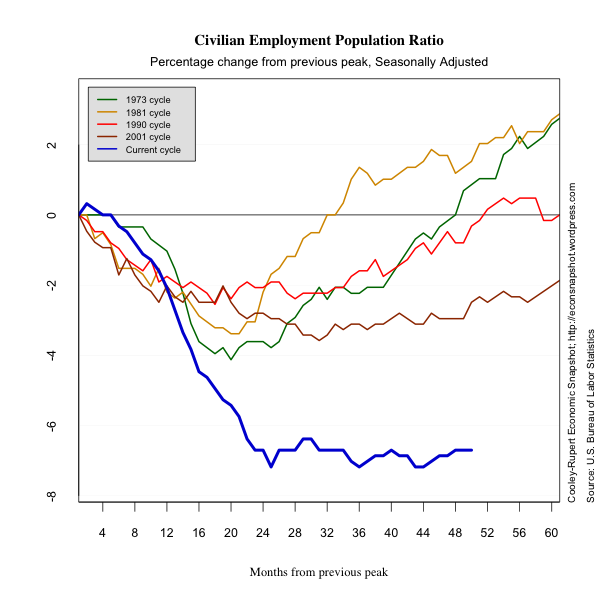
The January Employment Situation Report from the Bureau of Labor Statistics revealed broad-based upside surprises. Median expectations were on the order of 155,000 and the current increase for January is 243,000. Employment increased across all sectors, save Government. In addition, revisions to both November (+57,000) and December (+3,000) were both on the upside. While the unemployment rate fell to 8.3%, the employment to population ratio remained at 58.5% and the labor force participation rate fell to 63.7% from 64.0% in December. However with the BLS added population controls the employment population ratio increased and participation stayed constant.
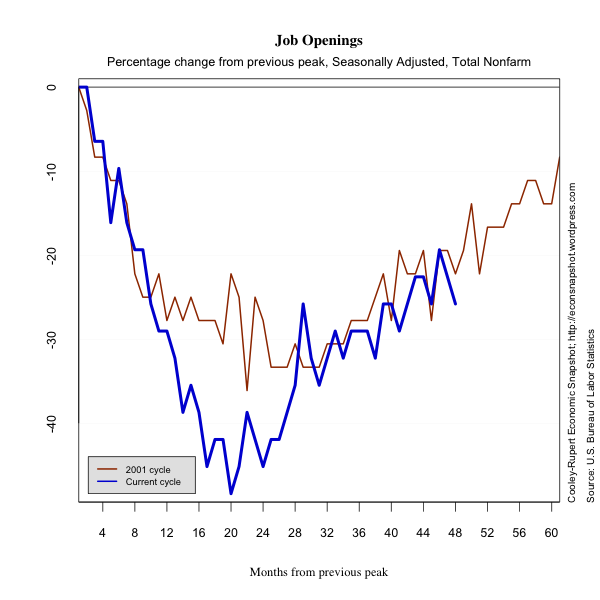
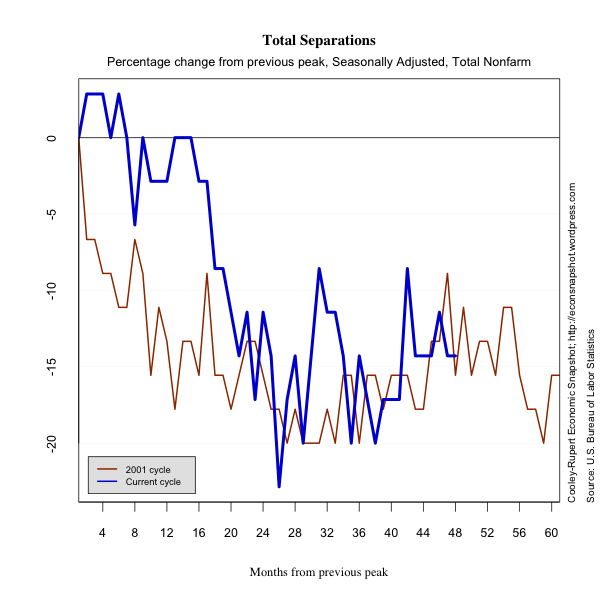
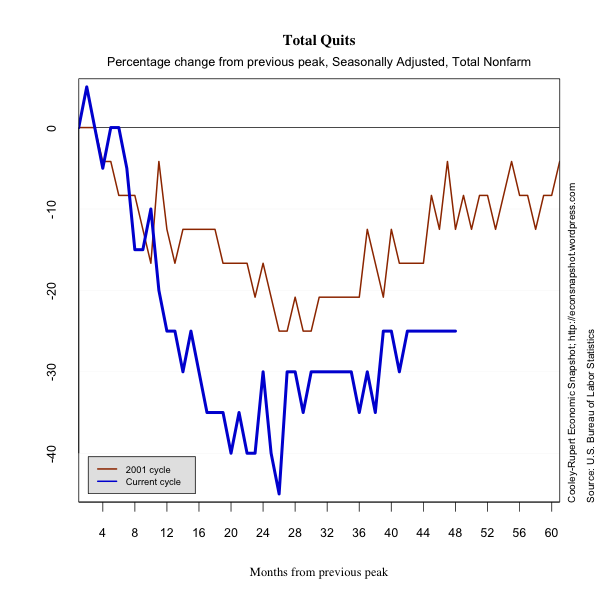
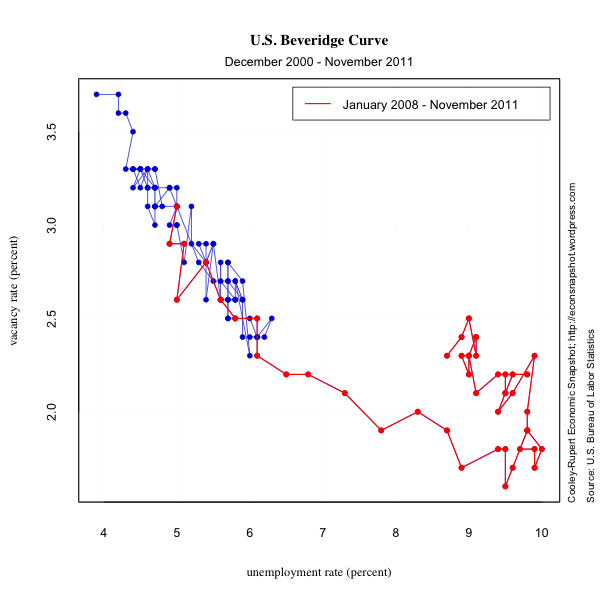
While the labor market still has a ways to go to return to its pre-recession levels, the jobs numbers are encouraging. We also include data from the Job Openings and Labor Turnover Survey (JOLTS). The survey is designed to show more refined features of the labor market including the rate of hires and separations. The series only allow comparison to the 2001 cycle, but show that along several dimensions the labor market resembles its performance during the 2001 cycle.

 Credit Markets
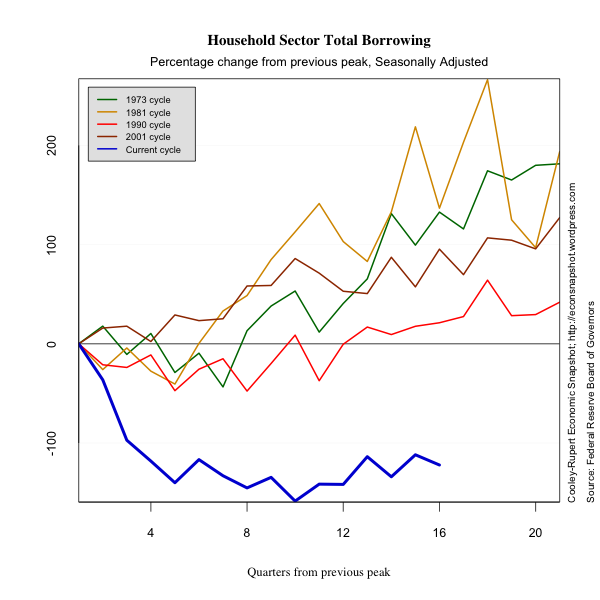
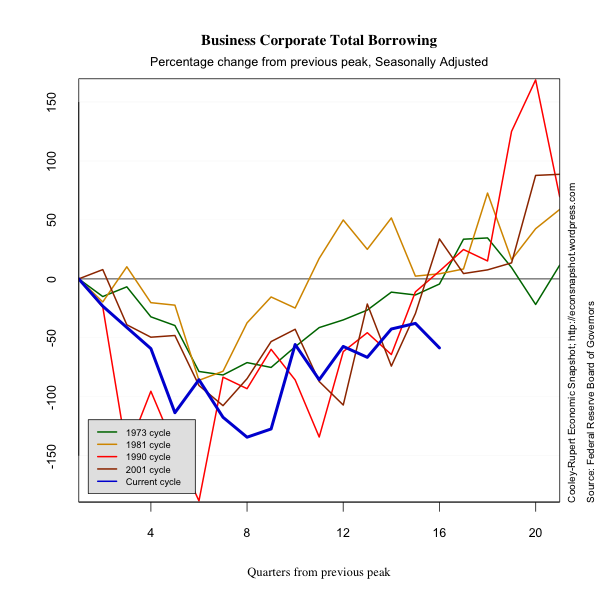
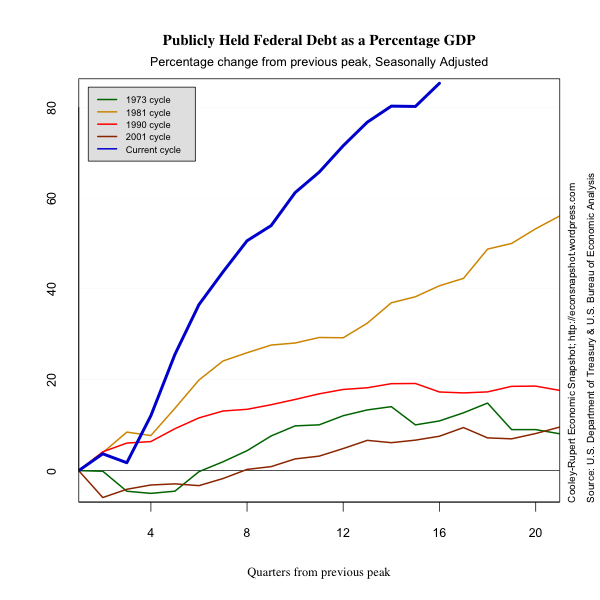
Credit markets continue to show the after-effects of the tremendous increase in leverage the took place prior to the 2007-2009 crisis. Households are continuing to reduce their debt and at an increasing rate. Household borrowing is very low and shows no sign of picking up. Corporate sector borrowing is falling again and corporations continue to lower their debt. The big story in credit markets is the dramatic shift of leverage to the public sector. Public sector debt outstanding is increasing at a faster rate.
*Note 2/9/2012: The graphs for household debt outstanding as a % of GDP and business corporate outstanding as % of GDP were updated. Previous graphs contained errors and were wrong.
Industrial Production and Inflation
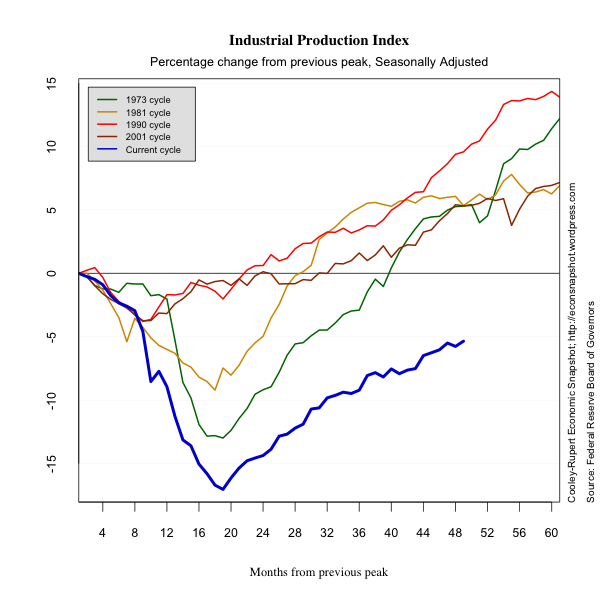
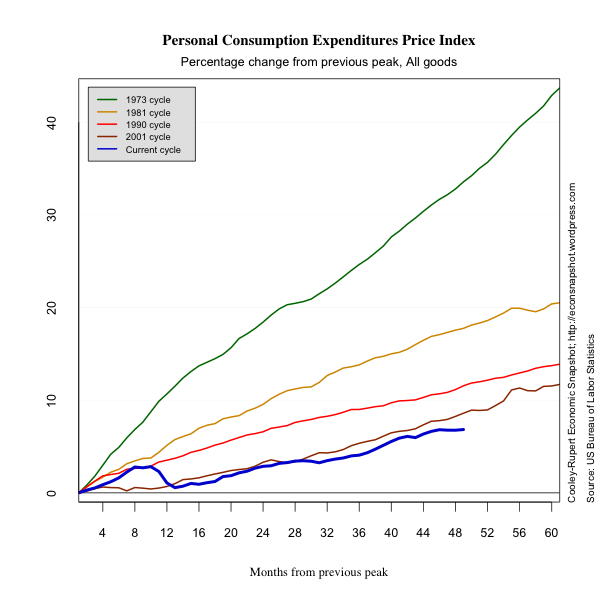
In this section we present some plots of miscellaneous series that reflect other characteristics of this business cycle. The decline in industrial production is dramatic. There is no evidence of inflation or deflation.
Glossary
Compensation includes accrued wages and salaries, supplements, employer contributions to employee benefit plans, and taxes.
Consumer Price Index measures the price paid by urban consumers
for a representative basket of goods and services. Prices are collected from 87 urban areas and from approximately 23,000 retail and service establishments.
Debt Outstanding measures the current level debt owed on credit market
instruments. Credit market instruments include open market paper, Treasury securities, agency and GSE-backed securities, municipal securities, corporate and foreign bonds, bank loans, mortgages, and
consumer credit.
Durables are goods that have an average useful life of at least 3
years.
Employment Population Ratio is the ratio of the number of
civilians in the labor force to the total civilian population.
Exports consist of goods and services that are sold or
transferred by U.S. residents to foreign residents.
Goods are tangible commodities that can be stored or inventoried.
Government Consumption Expenditures and Gross Investment measures
current consumption expenditures by the government in order to produce goods and services to the public and investment in structures and equipment and software.
Gross Private Domestic Investment measures additions and
replacements to the stock of private fixed assets without deduction of
depreciation.
Imports consist of goods and services that are sold or
transferred by foreign residents to U.S. residents.
Industrial Production Index measures real output of
manufacturing, mining, and electric and gas utilities industries.
Job Openings or Vacancies are all positions that are open (not
filled) on the last business day of the month.
Labor Force is defined as the number of unemployed persons plus
the number of employed persons.
Labor Force Participation Rate is the ratio of unemployed persons
to the number of persons in the labor force.
Net Worth equals to total assets minus total liabilities. Assets
include owner-occupied real estate, consumer durables, and equipment and software owned by nonprofit organizations.
Nondurables are goods that have an average useful life of less
than 3 years.
Nonresidential Fixed Investment measures investment by businesses
and nonprofit institutions in nonresidential structures and in equipment and software.
Personal Consumption Expenditures measures the value of goods and services purchased by households, nonprofit institutions that primarily serve households, private non-insured welfare funds, and private trust funds.
Residential Fixed Investment measures investment by businesses and households in residential structures and equipment, primarily new construction of single-family and multifamily units.
Services are commodities that cannot be stored or inventoried and
that are usually consumed at the place and time of purchase.
Total Borrowing measures the flow of new credit market liabilities during the period. Credit market liabilities include open market paper, Treasury securities, agency and GSE-backed securities, municipal securities, corporate and foreign bonds, bank loans, mortgages, and
consumer credit.
