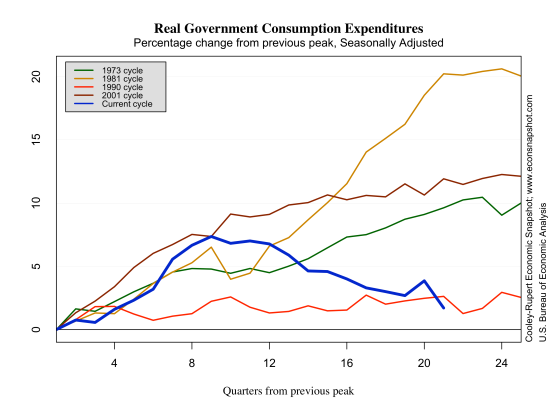
The third estimate of Q4 Real GDP, released today indicates anemic output growth of 0.4% (saar), although it was revised up from 0.1%. The estimate for 2012 annual growth stands at 2.2%, higher than the 1.8% growth seen in 2011. Government consumption continues to fall, down 7.0% overall, with federal government consumption down 14.8%.

The higher revision came mainly from fixed investment: (advance: 9.7%, second: 11.2%, third: 14.0%) and exports: (advance: -5.7%, second: -3.9%, third: -2.8%). Consumption expenditures, on the other hand, were revised down (advance: 2.2%, second: 2.1%, third: 1.8%)


Both non-residential and residential investment continue to climb. Non-residential fixed investment is nearly back to its December, 2007 level. Residential investment, although increasing for the past year and a half or so, still remains substantially below its pre-recession level.


The continued recovery has also had an affect on the federal government budget deficit. Over the past couple of years current receipts have climbed and current expenditures have fallen as a fraction of GDP…and so has the deficit.

Government policies and consumer behavior
The intrigue surrounding the so-called “fiscal cliff” toward the end of 2012 was fodder for analysts around the globe. Would tax cuts expire? Would drastic spending cuts ensue? etc. The recently released data from the BEA for disposable personal income shown in the graph below shows clearly how the public reacted. Evidently they were worried about tax increases and so pulled income into December of 2012, hence the big spike in the dark blue line. Then, as taxes increased, real disposable income took a nose dive. However, consumers did not seem to be phased by any of this as the next graph for personal consumption expenditures shows. It may be that consumers are behaving as Friedman-like permanent income people and view this as a temporary changesin the tax system.


Assuming the current statistics are not revised significantly, the US economy is sinking deeper into depression relative to the pre-2008 trend as trend growth is about 2.7%. The problem is low productivity growth.
Edward C. Prescott
Indeed productivity has slowed, here is a graph from FRED and here is one from Cooley-Rupert showing productivity in relation to other cycles. The first thing to notice from the FRED graph is the steep increase coming out of the recession and then it basically becomes flat. As seen in the Cooley-Rupert graph, it is not too unlike other cycles, except for the crazy 2001 cycle. In addition, manufacturing multifactor productivity growth has been quite strong.