March Employment Report

By Paul Gomme and Peter Rupert

The BLS announced that payroll employment increased 303,000 in March, another solid reading that will likely change the Fed’s stance concerning the timing of cuts in the Fed Funds rate. The private sector added 232,000.

The construction sector jumped up 39,000, the largest increase since May of 2022.

Average weekly hours of work rose from 34.3 to 34.4 leading to a 5.7% (annualized) increase in total hours of work.

The household survey also showed considerable strength with employment increasing 498,000. The labor force increase 469,000 leading to an increase in the labor force participation rate to 62.7 (was 62.5). The number of unemployed persons fell 29,000 and the unemployment rate fell from 3.86% to 3.83%.

On April 2 the BLS JOLTS data showed that job openings changed little in February, at 8.8 million and the rate of job openings remained at 5.3% for the third straight month.

February Employment Stays Strong

by: Zach Bethune, Thomas Cooley, Peter Rupert

According to the Bureau of Labor Statistics establishment survey, employment increased 295,000 from January to February and has increased by about 3.3 million since February 2014. January employment was revised down slightly by 18,000 and December had no revision.  This continues the trend of strong employment growth consistent with an an ongoing robust recovery.  The unemployment rate fell further to 5.5% average weekly hours were flat and average hourly earnings rose only slightly. 

empchgm-2015-03-06

Job gains were robust, only mining and logging, non-durable goods, and temporary help services saw small declines. Is the decline in temporary help services, for the second month in a row,  a signal of underlying strength in that firms are relying more on full-time workers rather than temps?  Maybe, but, as the chart below shows, as a fraction of total employment, firms use temp help much less during downturns.  Moreover, the use of temp services has doubled relative to total employment since the early 1990’s.

temps-2015-03-06

Average weekly hours have remained fixed at 34.6 for the past 5 months after being stuck at 34.5 for the previous 7 months. Average hourly earnings rose only slightly from $24.75 to $24.78.

avghours-2015-03-06

While the establishment survey provided solid numbers, the household survey provided some mixed messages. True, the unemployment rate fell from 5.7% to 5.5%.

unrate-2015-03-06

But the labor force fell by 178,000 leading to a decline in labor force participation from 62.9 to 62.8 and no change in the employment to population ratio at 59.3.

lfp-2015-03-06

epr-2015-03-06

The number of persons working part time for economic reasons fell by 175,000, with 165,000 fewer reporting slack work reasons. The number of persons reporting part time for non-economic reasons increased by 15,000.

parttimefrac-2015-03-06

All of this seems to provide further support for the view that the Fed should begin normalizing monetary policy sooner rather than later. Although recent communications have emphasized the view that they could be “patient,” we expect that language to disappear. The graphs below show the continued strength in the labor market, albeit slower than coming out of previous recessions.

emp-rec-rec-2015-03-06

unemp-rec-rec-2015-03-06

Strong January Employment Report

by: Zach Bethune, Thomas Cooley, Peter Rupert

The Bureau of Labor Statistics release of the January jobs report shows continued strength in the labor market, with total nonfarm employment rising 257,000. Moreover, the current increase, along with revisions over the past two months show employment growth averaging 336,000 over the past three months. The revision to November, up to 423,000, was the largest monthly increase since May of 2010.

empchgm-2015-02-06

In addition to the usual monthly revisions, the BLS also undertook annual re-benchmarking:

With the release of January 2015 data on February 6, 2015, the Bureau of Labor Statistics (BLS) introduced its annual revision of national estimates of employment, hours, and earnings from the Current Employment Statistics (CES) monthly survey of nonfarm establishments. Each year, the CES survey realigns its sample-based estimates to incorporate universe counts of employment—a process known as benchmarking. Comprehensive counts of employment, or benchmarks, are derived primarily from unemployment insurance (UI) tax reports that nearly all employers are required to file with State Workforce Agencies.

For those data geeks wanting to know more about benchmark revisions, here is the full article from the BLS. Summarizing that article, “The March 2014 benchmark level for total nonfarm employment is 137,214,000; this figure is 67,000 above the sample-based estimate for March 2014, an adjustment of less than 0.05 percent.” The BLS then uses the re-benchmarked data to revise the rest of the year, “From April 2014 to December 2014, the net birth/death model cumulatively added 968,000, compared with 841,000 in the previously published April to December employment estimates.”

Employment gains were robust, the only major sector to shed jobs was the Government sector, losing 10,000, meaning that Private sector jobs increased by 267,000.

Average weekly hours, however, have shown no change over the past 3 months, stuck at 34.6.
avghours-2015-02-06

Average hourly earnings ticked up slightly to $24.75, and growth has averaged about 2% per year since 2010, but with CPI inflation running below 2% of late means real hourly earnings are growing, albeit modestly.

ahecpi-2015-02-06

While the strong report certainly keeps the Fed on a steady *normalization* pace, there are still areas in the labor market that, if not troublesome, remain nagging issues. While the employment to population took a nose dive during the great recession…and is still quite low relative to its all-time (at least since WWII) peak…

epr-2015-02-06

…however, if one zooms in, there has been a steady increase over the past year and a half or so…

epr2-2015-02-06

Another somewhat nagging issue is the fate of the long term unemployed. Indeed, the number of those unemployed 27 weeks or longer actually rose in January, from 2.785 million to 2.80 million persons. The percent of the unemployed who are unemployed 27 weeks or longer has been bouncing between 31% and 32% for the last six months or so….
udur27a-2015-02-06The number of persons employed part time for economic reasons (or involuntary part-time workers) also didn’t improve in January. There remains 6.8 million individuals who would like to be working full time but couldn’t because the were unable to find full time work or had their hours cut back.

pter-2015-02-06

The rate at which these workers are transitioning into full time continues to show no improvement…rate-pter-fter-2015-02-06

…and their wages are declining relative to full time workers.
wage-ratio-2015-02-06It is no surprise that, despite a low 5.7% unemployment rate since October, there is still concern about the health of the labor market.

The Labor Market is Recovering Well and the Case Strengthens for the Fed to Normalize

by: Zach Bethune, Thomas Cooley, Peter Rupert

The Bureau of Labor Statistics release of the October jobs report showed continued steady improvement in the US labor market. Total non-farm payroll employment increased by 214,000, just slightly below the average monthly gain of 222,000 observed over the previous twelve months. Moreover, September employment gains were revised up by 8,000.

empchgm-2014-11-07

While the gains were broad-based, the bulk of the increase occurred in private service sector at 181,000. Employers are increasing their work force at both the extensive margin (jobs) and the intensive margin (hours). Average weekly hours increased slightly as did average hourly earnings.

avghours-2014-11-07

ahe-2014-11-07

The official unemployment rate moved down to 5.8%, the lowest rate since July, 2008, and the U-6 rate (Total unemployed, plus all persons marginally attached to the labor force, plus total employed part time for economic reasons, as a percent of the civilian labor force plus all persons marginally attached to the labor force) fell to 11.5%. The employment to population ratio and labor force participation increased.

uu6rate-2014-11-07

epr-2014-11-07

lfp-2014-11-07


Transition Rate Up for Long-term Unemployed…

While the median unemployment duration ticked up in October from 31.5 to 32.7 weeks, the rate at which workers are finding jobs has shown steady improvement. Since early 2014, the unemployment to employment transition rate has increased for all workers, particularly for those unemployed less than 14 weeks.

UE-rate-duration-2014-10-03

The number of employees working part-time for economic reasons (PTER) has also declined as the number of persons stating they could only find part-time employment fell by 115,000. This group of workers has been a focus of the Fed in describing the ‘slack’ still existent in the labor market.

parttimefrac-2014-11-07

In the figures below, we show the rate at which these workers either return to unemployment or find full-time work. The transition rate into unemployment has entirely returned to its pre-recession level. PTER workers are not losing their jobs as frequently as during the depths of the recession. However, we do still see that these workers aren’t finding full-time employment at the rate they once did before 2007. In fact, the transition rate from PTER into full-time employment hasn’t shown any signs of improving in the previous 5 years, despite accommodative monetary policy.

rate-pter-unmp-2014-10-28

rate-pter-fter-2014-10-28


This is all evidence of a healthy, recovering labor market.  Some of the overhang of the great recession will be with us for a long time. For instance, people unemployed for long durations are going to move only very slowly back to employment because long spells of unemployment erode skills and diminish employability.  Stimulus policies will not impact these workers very much – only targeted skill building programs will.


A Fed Call to Arms?

Given that the labor market now seems reliably recovered and GDP growth is steadily positive it seems to be time for Fed  to put aside its fear of the consequences and restore normalcy to monetary policy.  It is important not only because of the dangers of waiting too long but also because of the hidden costs of the current policy. Keeping the Federal Funds rate at zero for an extended period has distorted economic decisions and financial markets as investors search for yield and seem to take on more risk. It has also arguably increased income inequality precisely because of the wealth effect the policy was designed to create. Moving back to a normal monetary policy need not be disruptive and should enhance the Fed’s credibility going forward.  The graph below shows the Federal Funds rate implied by the Fed’s earlier announced goal of a 6.5% unemployment rate. While everyone realizes that is not the current goal it illustrates the case for a return to conventional monetary policy.

taylor-rule-2014-11-08 taylor-rule-deviation-2014-11-08


More Jobs Follow More Q2 GDP


by: Zach Bethune, Thomas Cooley, Peter Rupert

The past week has seen upward revisions to the initial estimate of Q2 GDP: from 4.0% growth to 4.2% growth in the second estimate to 4.6% growth for the final estimate, following a negative growth rate in Q1. That report was followed today by the September Jobs report that showed an addition to total non-farm payroll employment of 248,0000.  These are all positive signs. The key question is whether they show enough improvement in the labor market to stiffen the resolve of the Fed to ease its foot off the accelerator.

LABOR MARKETS

The Establishment Survey from the BLS released on October 3 indicates that Total Nonfarm Employment increased 248,000 in September, slightly beating expectations that ranged from 200k to 220k. Private employment increased 236,000 and 207,000 of that was in service producing jobs. In addition, July employment was revised up by 31,000 and August up 38,000.

empchgm-2014-10-03

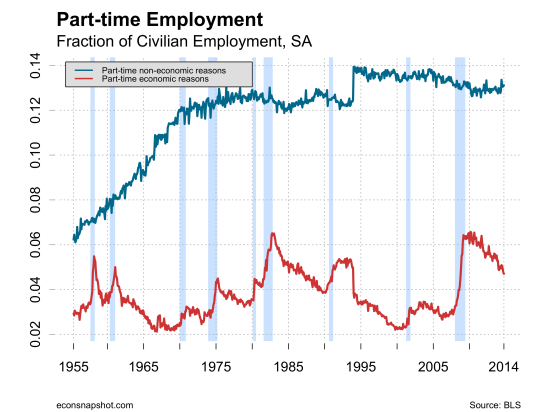
The Fed has indicated that there is still slack in the labor market, evidently the sentiment reflects part-time workers. In Yellen’s speech at Jackson Hole on August 22, the word “slack” was used about 22 times and “part-time” 7 times. Indeed, those working part-time for economic reasons has fallen to its lowest level, (6.99 million) since November, 2008, roughly a 25% decline since the peak when nearly 9.2 million workers were employed part-time for economic reasons.

parttime-2014-10-03

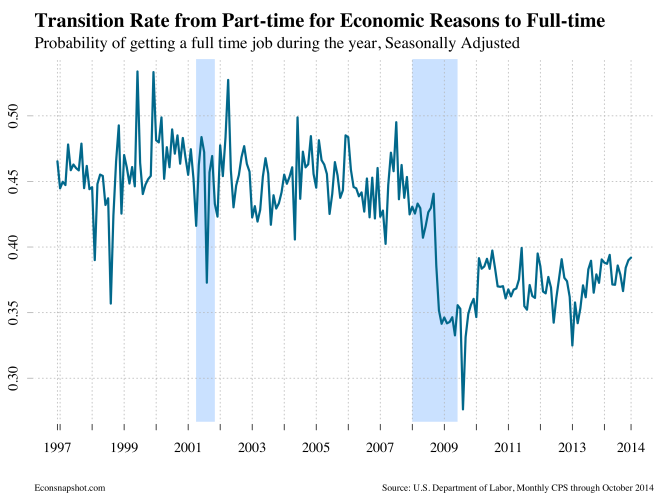
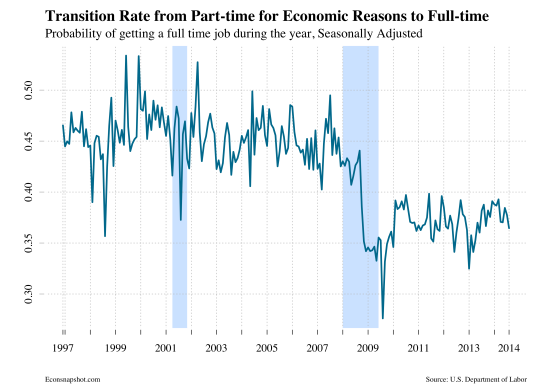
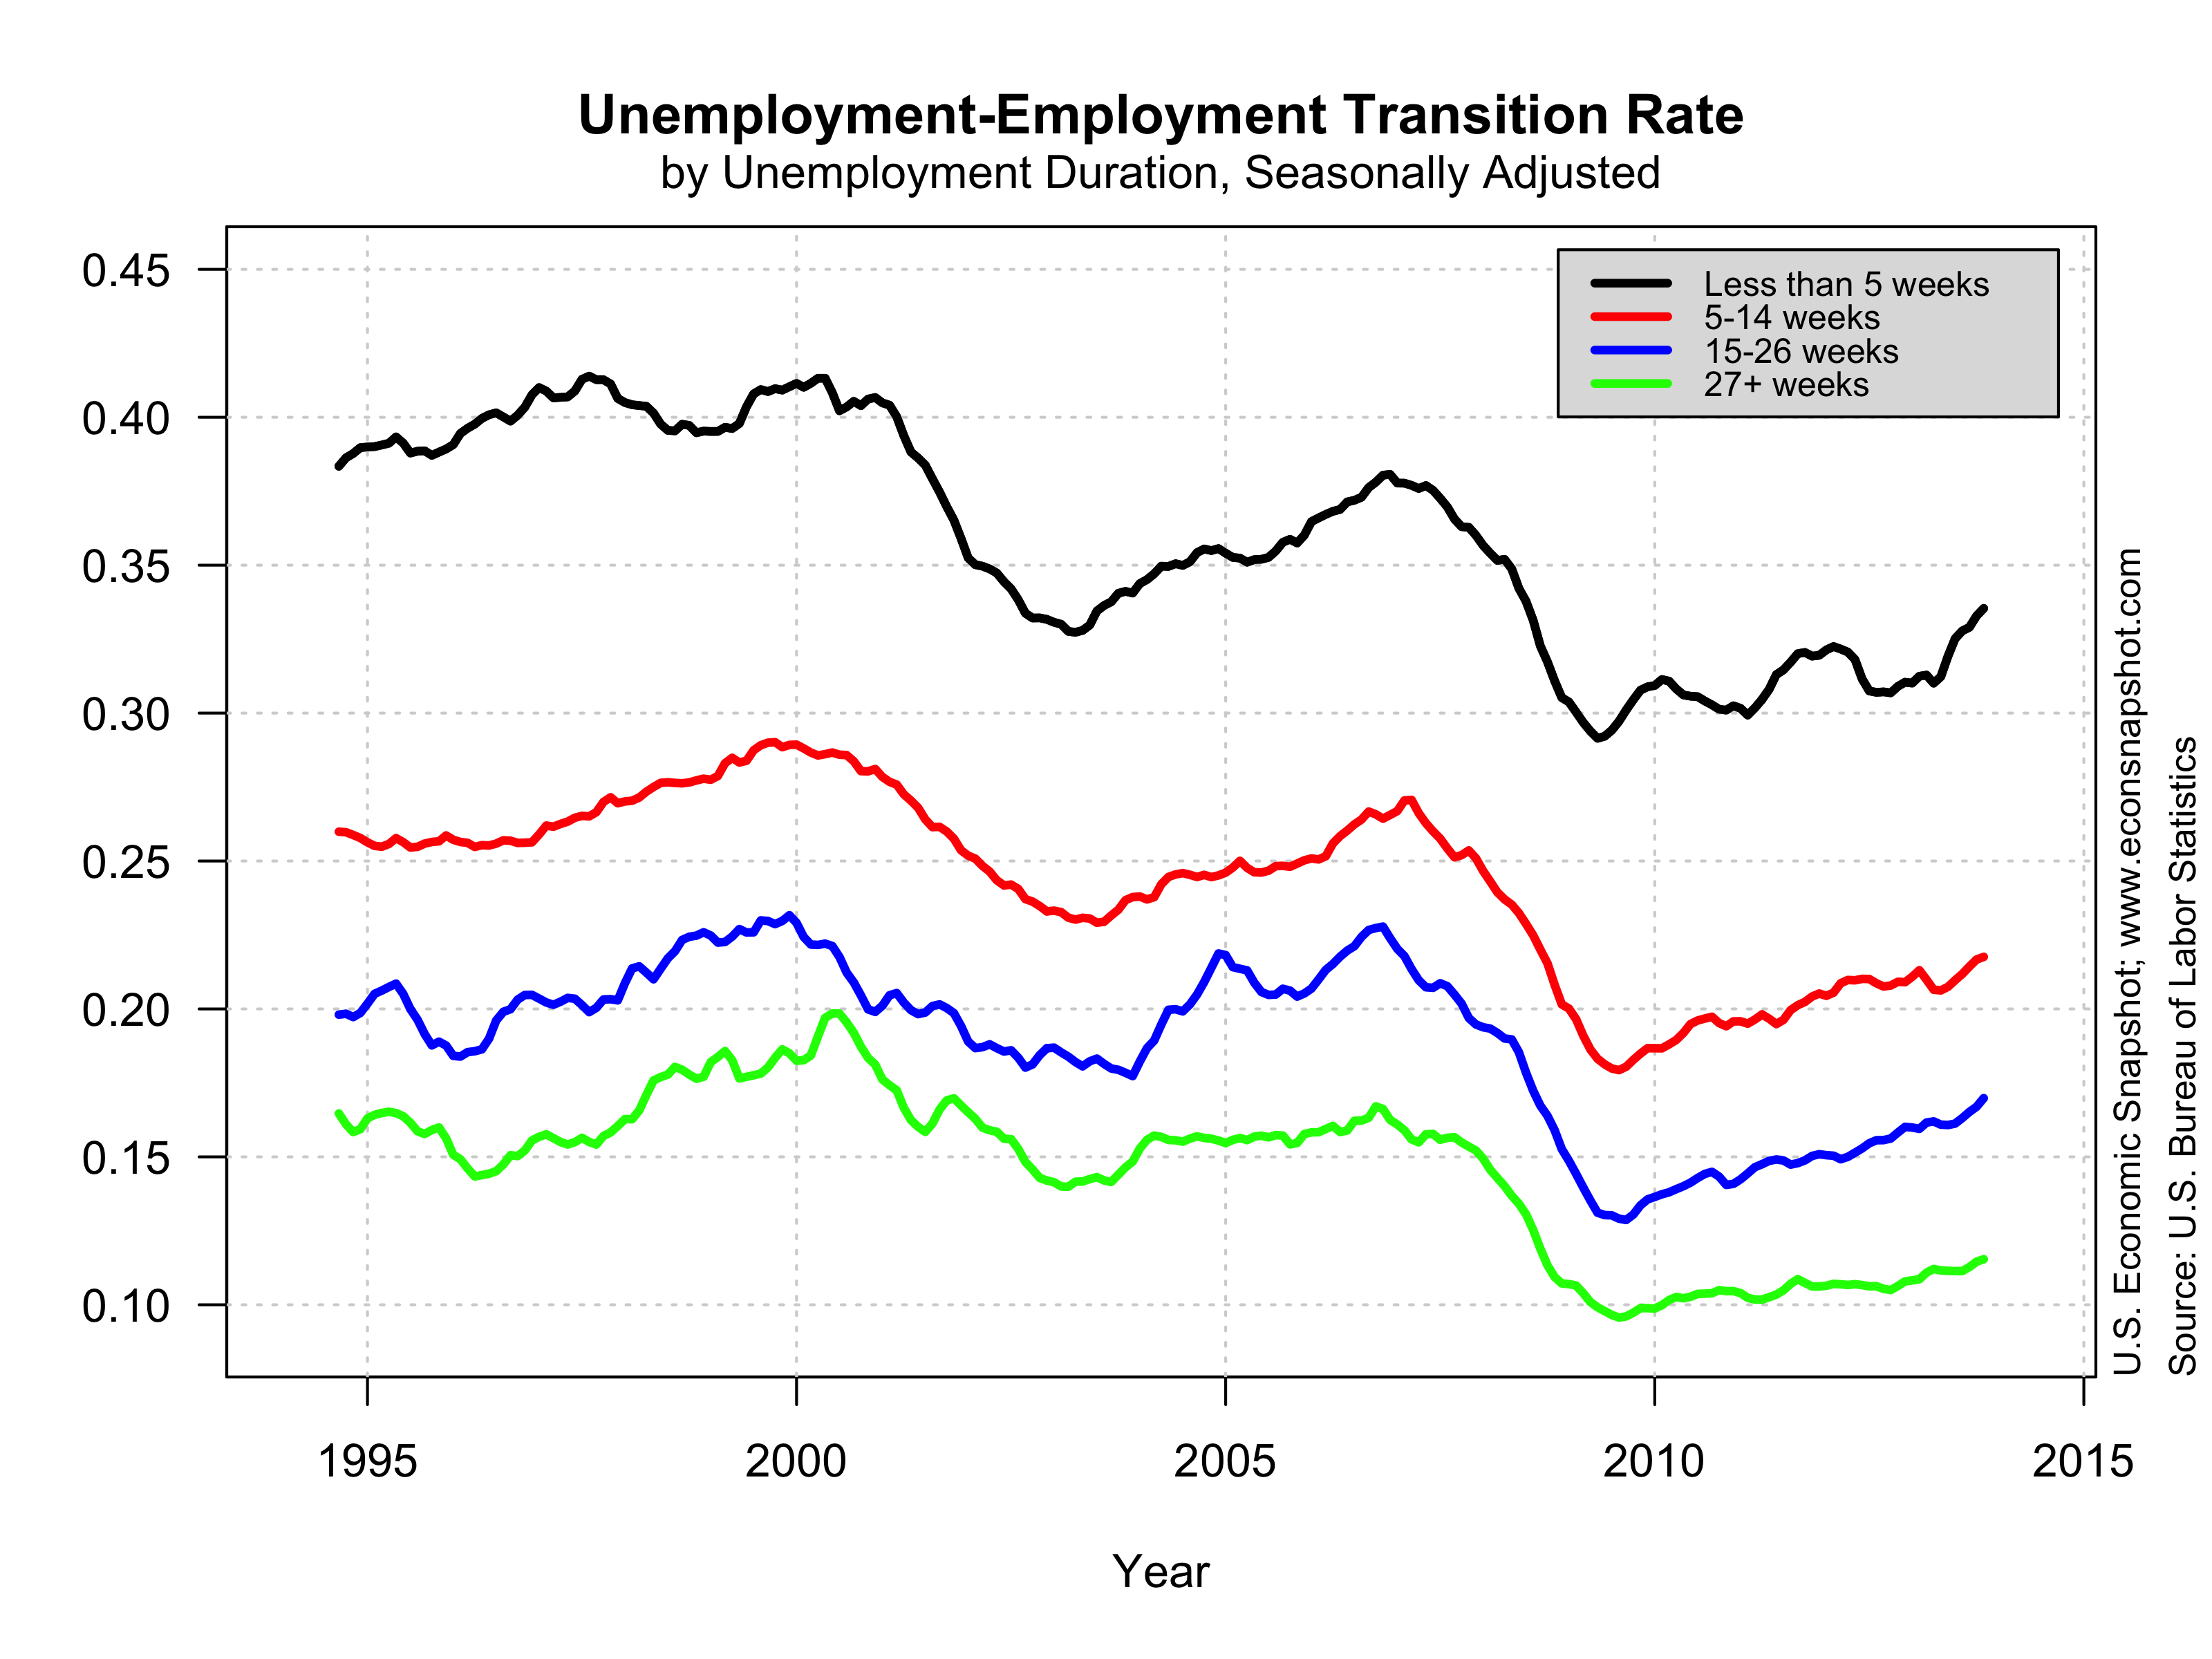
However, the rate at which those workers are exiting into full time employment hasn’t shown any signs of recovery. In normal times that rate is around 0.45. Since the recession is has fallen and has stayed around 0.37.

rate-pter-fter-2014-10-03

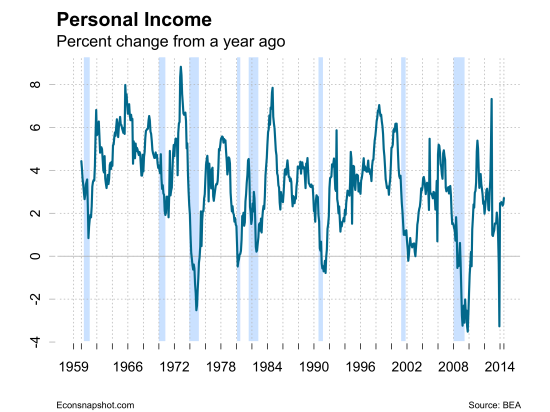
The employment to population ratio seems stuck at 59%…the third straight report with that reading.

epr-2014-10-03

The size of the labor force shrank slightly, down 97,000. Combined with the employment increase, the unemployment rate nudged down to 5.9%. This is the first time below 6% since 2008 but it is partly due to the further drop in labor force participation.

unrate-2014-10-03
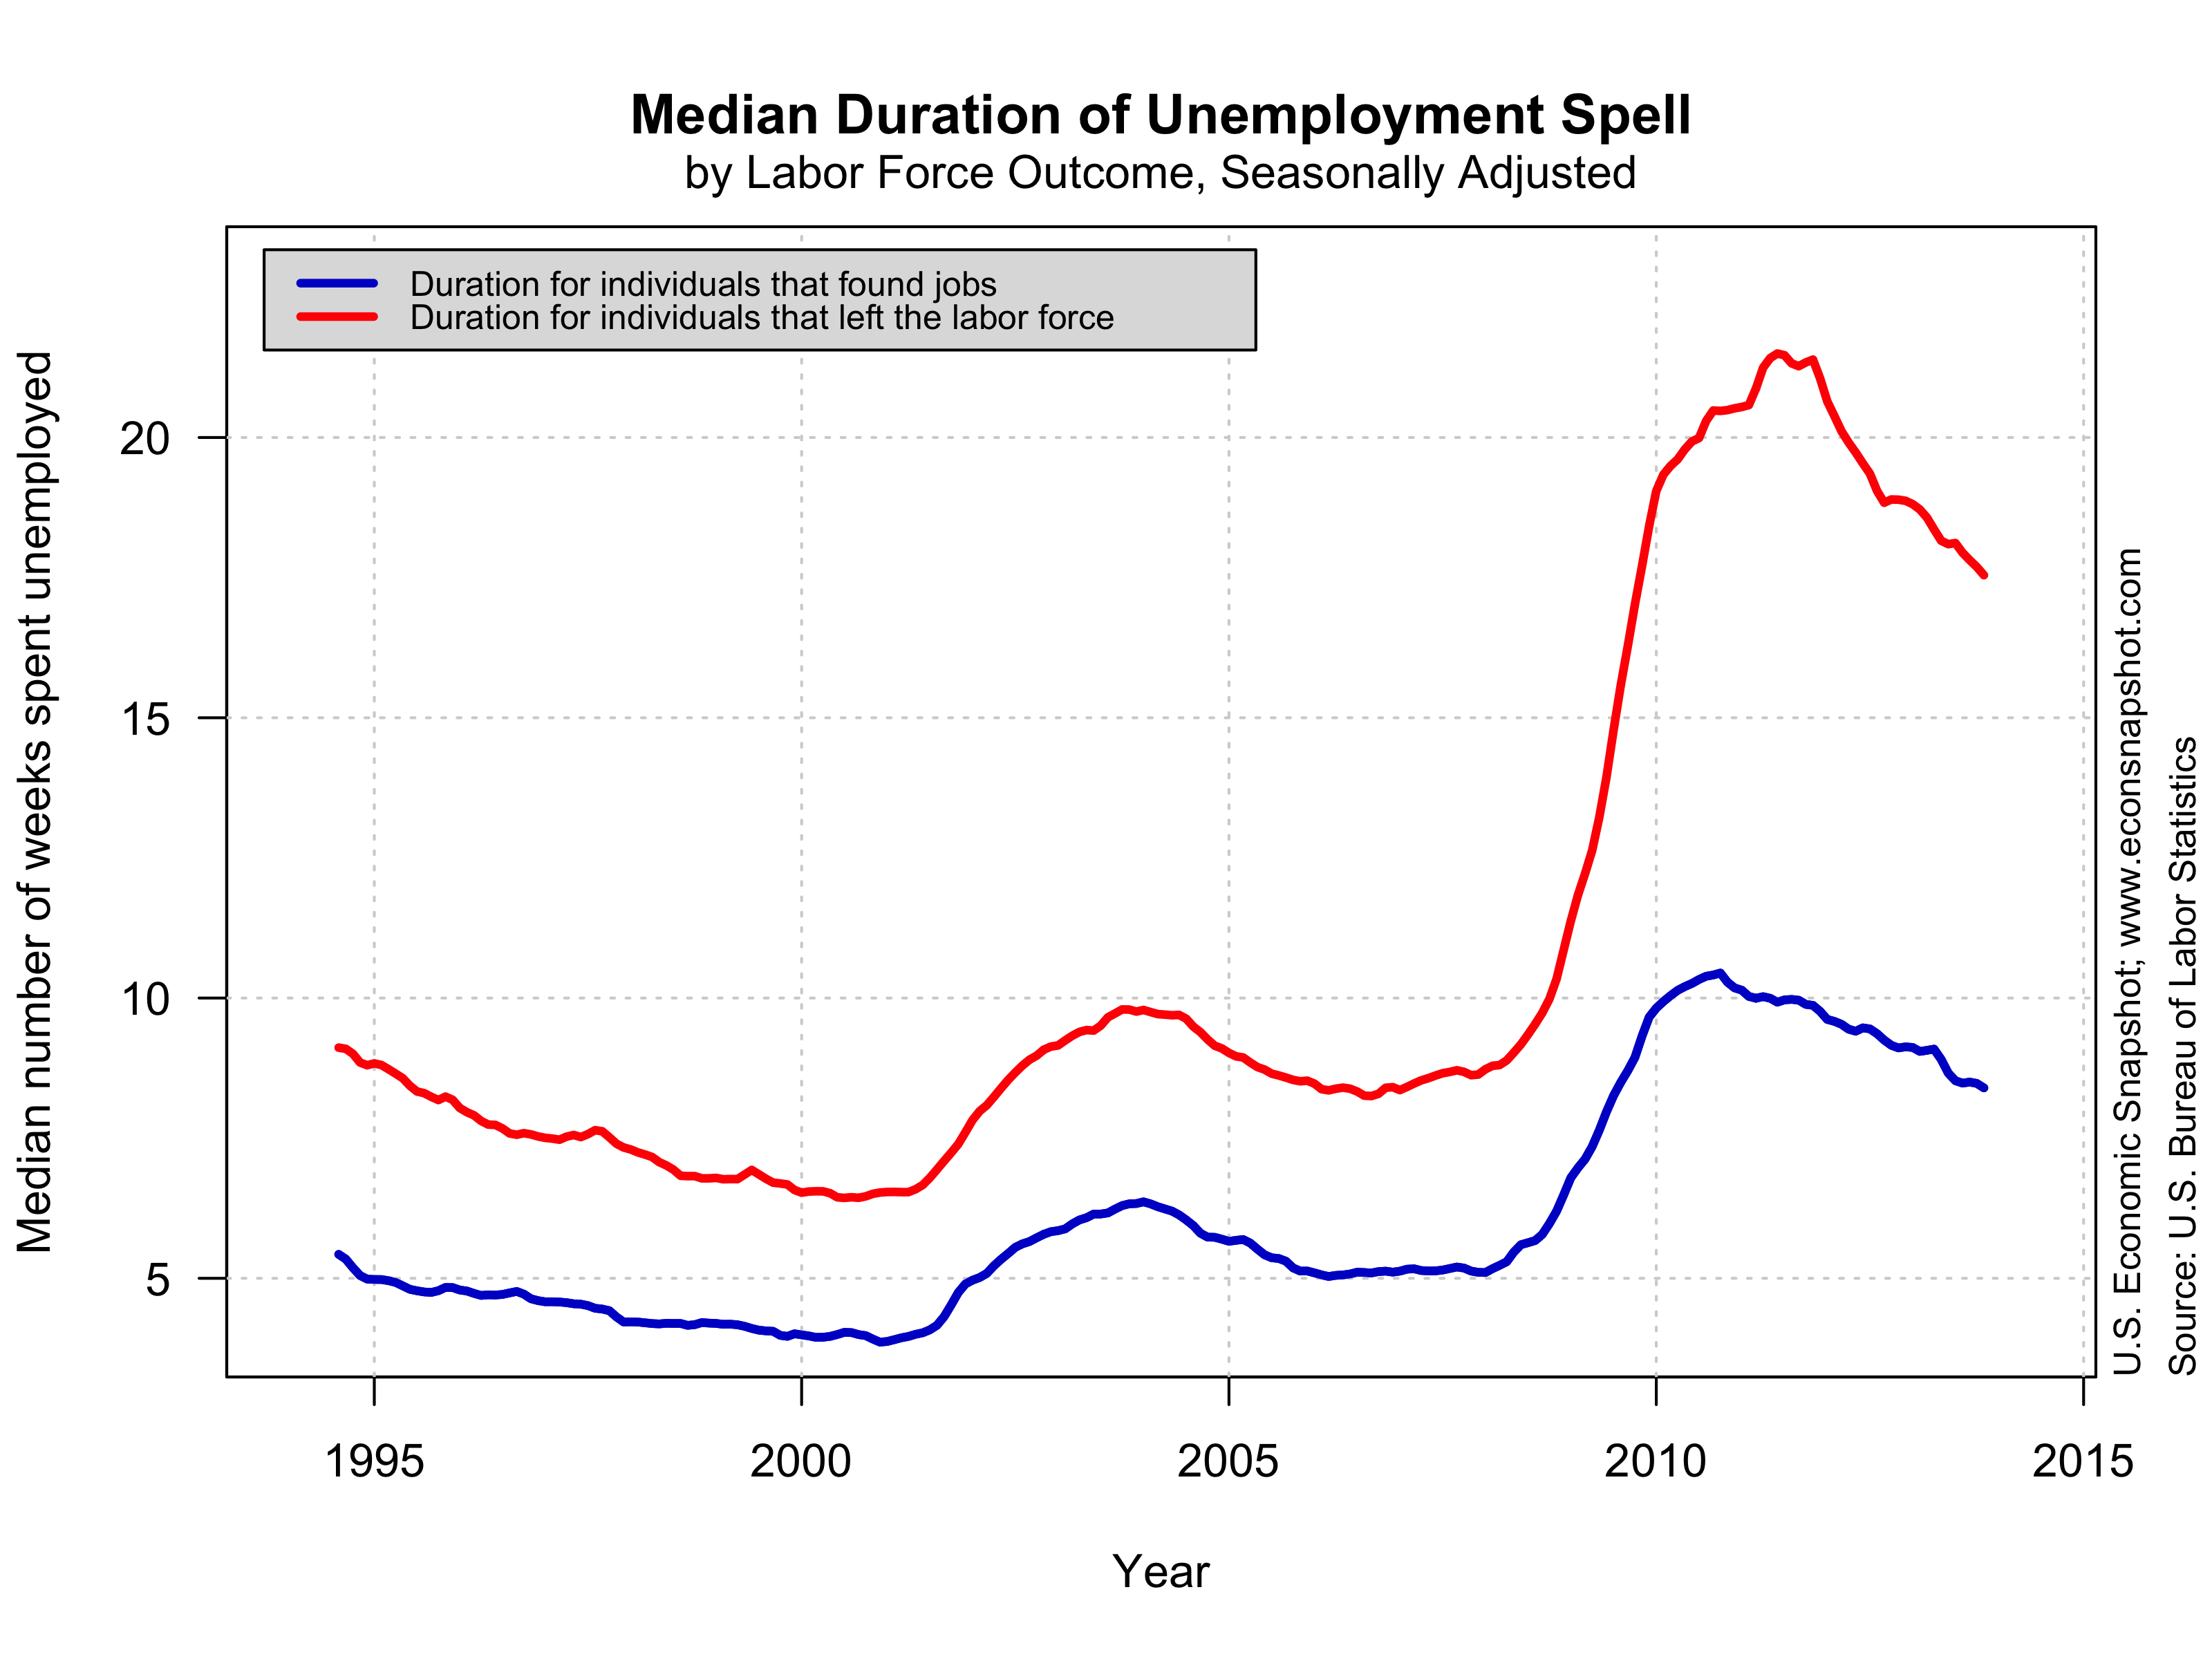
While a 5.9% unemployment is much closer to normal, the average time spent in unemployment remains elevated. Notice, the median unemployment duration more closely tracks the unemployment rate than the mean. This tells us that there remains a substantial pool of long-term unemployed.

uduration-2014-10-03

To get a better picture, we can look at the rate at which unemployed workers find jobs, broken down by the time they have spent in unemployment in the figure below. The job finding rate for workers with more than 27 weeks of unemployment (green line) has shown very slow improvement. It remains 20% below its level in December 2007. For comparison, the job finding rate for ‘short-term’ unemployed workers, or those less than 5 weeks, is only about 1.3% below its level in December 2007.

UE-rate-duration-2014-10-03The evidence above, combined with the fact that we still don’t see any significant upward pressure on wages, is a clear indication that the labor market still isn’t fully recovered. The prospects for workers that have been unemployed for more than 27 weeks or for workers that took part-time jobs in the absence of finding full time employment remain dim.


GDP

The final estimate for Q2 real GDP revealed an upward revision to 4.6% compared to the 2nd estimate of 4.2% and initial estimate of 4.0%. Real GDP for Q1 fell 2.1%.

gdprealchgm-2014-10-02

While the bounce in the revision is certainly welcome, the recovery still looks much different from those in the past, as can be seen below. Current values of real GDP are substantially below the longer-run linear trend…and not showing any convergence.

rgdp-level-2014-10-02

Personal consumption expenditures continue at a sluggish pace, increasing 2.5%, that is, contributing 1.75 percentage points to the 4.6% increase.

pcerealchgm-2014-10-02

However, there was overall strength in the report. Real Gross Private Domestic Investment was up 19.1% from the previous quarter and is nearing the highest recorded level in 2006:Q1.

investment-level-2014-10-03

Implications

The latest two reports signal continued growth with substantial strengthening. Such continued strength might push some policy makers to rethink the timing of “liftoff” for the Fed Funds Rate. While many have indicated something like mid-2015, another strong showing like we had this week could alter that thinking. But the strengthening of the dollar and the decline in import prices decrease concerns about price pressures and mitigate against a change in stance.

Employment Report and Second Estimate for Q2 GDP: The Dog Days of The Recovery


by: Zach Bethune, Thomas Cooley, Peter Rupert

The employment report from the BLS release this morning sobered up many who had anticipated a healthy jobs report: payroll employment increased a lean 142k. The forecasters were looking at employment to increase by about 220k. In addition, employment over the past two months was revised down a total of 28k. This is a disappointment given that monthly job growth has averaged 226,000 jobs in the first seven months of the year. Aside from the downturn in hiring activity the labor market picture remained largely unchanged.  It is neither robust nor stagnant.

empchgm-2014-09-05

Although the unemployment rate ticked down slightly, from 6.2 to 6.1, the labor force fell by 64k.

uu6rate-2014-09-05

lfp-2014-09-05

Average hours and average hourly earnings were basically flat.

avghours-2014-09-05

ahe-2014-09-05

Much of the commentary from the Fed has revolved around the slack labor market and the latest report may affect the stance of monetary policy going forward. For example, from the latest FOMC statement

“If incoming information broadly supports the Committee’s expectation of ongoing improvement in labor market conditions and inflation moving back toward its longer-run objective, the Committee will likely reduce the pace of asset purchases in further measured steps at future meetings. However, asset purchases are not on a preset course, and the Committee’s decisions about their pace will remain contingent on the Committee’s outlook for the labor market and inflation as well as its assessment of the likely efficacy and costs of such purchases.”

Last week the second estimate for Q2 GDP released by the BEA on August 28 revised up GDP growth from 4.0% to 4.2%. Business fixed investment largely led the way, contributing roughly 1 percentage point to overall growth.

gdprealchgm-2014-08-29

Personal Income was released on August 29. It showed an increase of .2 % in July.

The recovery continues but at a very slow pace compared to past recoveries. We finish again with the bar chart showing the growth rate of GDP during the current recovery compared with the growth rate during past recoveries.  The stagnation question is still open.


pireal-2014-08-30

pcebarmonthly-2014-08-30expansion-growth2014-07-30

Do We Have Liftoff?

by: Zach Bethune, Thomas Cooley, Peter Rupert

The minutes for the June 17-18 meeting of the FOMC revealed a discussion about the end of bond purchases in October but only a vague notion of when liftoff might occur. Many believe that “slack” labor market conditions are still a concern:

In assessing labor market conditions, participants again offered a range of views on how far conditions in the labor market were from those associated with maximum employment. Many judged that slack remained elevated, and a number of them thought it was greater than measured by the official unemployment rate, citing, in particular, the still-high level of workers employed part time for economic reasons or the depressed labor force participation rate.

The first estimate from the BLS establishment survey reports total non-farm employment increased by 288,000 in the month of June and  the prior two months have been revised up by an additional 29,000. Here are our takeaways:

Monthly employment growth continues to be strong(ish).

empchgm-2014-07-03

The employment gains were broad-based.

All major BLS sectors (goods, services and government) added jobs in June. The next two charts illustrate these gains. The width of the bars represents the weight of each industry in total employment. For instance, employment in trade, transportation and utilities represents about one-fifth of all U.S. employment whereas industries like information or mining make up a much smaller fraction.

industry-empchg-2014-07-03

In June, every industry with the exception of ‘other services’ added jobs. As you would expect from a healthy labor market, the largest job gains predominantly came from the largest sectors with trade, transportation and utilities and professional and business services adding a combined 139,000 jobs.

industry-empchg-y-y-2014-07-03

Over the year, the story is similar. The largest four private sector industries have led the growth in employment. Of course government is a glaring exception.

Unemployment dropped for (almost) all the right reasons.

The unemployment rate dropped to a post-recession low of 6.1%, and it dropped for all the right reasons because the unemployed found jobs instead of leaving the labor force. Both the labor force participation rate and the employment to population ratio held steady. The only cautionary note is that a large number of the job gains were from involuntary part-time jobs. These are households that would like to have a full-time position, but could only find part-time work.

The recent trend in the job finding rate, those going from unemployment to employment, since the beginning of the year continued. The largest gains were recorded from the short-term unemployed workers.

UE-rate-duration-2014-07-03

The index of average weekly hours for private sector employees has continued to climb steadily.
avghours-2014-07-09

Unemployment and unemployment claims continue to fall.

The unemployment rate and the “U6” unemployment rate (Total unemployed, plus all persons marginally attached to the labor force, plus total employed part time for economic reasons, as a percent of the civilian labor force plus all persons marginally attached to the labor force) have fallen substantially, yet remain elevated relative to pre-2007.

uu6rate-2014-07-08

ubyschool-2014-07-08

Initial claims are now near their pre-2007 level.

claims-2014-07-08

Job vacancies have shot up lately.

According to the Job Openings and Labor Turnover Survery (JOLTS) job openings have shown a large spike up. The hiring rate, however, is still somewhat subdued.

joltsjor-2014-07-09

joltshir-2014-07-09

But long-term unemployment remains a problem.

The fact that mean unemployment duration has risen much more than the median indicates there are many more unemployed for 27 weeks or longer.

uduration-2014-07-08

Wage growth has been tepid.

Nominal wage growth has slowed and real wages grew mainly due to a fall in inflation…but due to the recent tick up in inflation, real wage growth is close to zero.

Again, from the FOMC minutes:

Aggregate wage measures continued to rise at only a modest rate, and reports on wages from business contacts and surveys in a number of Districts were mixed. Several of those reports pointed to an absence of wage pressures, while some others indicated that tight labor markets or shortages of skilled workers were leading to upward pressure on wages in some areas or occupations and that an increasing proportion of small businesses were planning to raise wages. Participants discussed the prospects for wage increases to pick up as slack in the labor market diminishes.

ahecpi-2014-07-08

More of the Same for Employment Growth? We Dig a Lot Deeper

by: Zach Bethune, Thomas Cooley, Peter Rupert

The establishment survey reports total non-farm employment increased by 217,000 in the month of May and revisions to the prior two months cut  employment by 6,000.   This seems like just another ho-hum increase in jobs in what has been a drawn out recovery.  But there is more to this story when one digs below the surface.  This is a long slow recovery from a sharp contraction and employment has just surpassed its pre-recession level. In the course of this recovery labor force participation has declined to a level not seen since the 1970’s, erasing many of the gains of the increase in female labor force participation.  One consequence of the long recovery is that the duration of unemployment has increased with nearly 35% of the unemployed, or 3.4 million workers, unemployed for 27 weeks or more. Weak labor market conditions and long duration unemployment discourage labor market participation. In this post, thanks to economists at the Bureau of Labor Statistics who shared their data with us, we can drill down  a little deeper and examine how the experience of workers who have been unemployed for long spells compares to the experience of those with shorter spells.

empchgm-2014-06-06


How do employment prospects differ by duration?

The graph below shows the rate at which unemployed workers transition to employment, broken into groups according to how long a worker has spent in unemployment.  Think of this as a job finding rate by duration of unemployment. For example the black line in the figure gives the job finding probability for those workers that have been in unemployment for less than 5 weeks. First, it is always true that workers that spend longer in unemployment have a lower probability of getting a job. Second, the job finding probability is pro-cyclical, it is harder to find a job in recessions and easier in booms.

UE-rate-duration-2014-06-06

Focusing on the current recovery, notice that these rates never fully recovered to the levels that prevailed before the 2001 recession – the first jobless recovery.  Not only did the labor market not regain its robustness after that contraction, the transition rate dropped dramatically in the great recession and has not recovered much for most durations of unemployment.

A positive sign is that the transitions to employment for short duration unemployed workers, particularly those that have been unemployed for less than 5 weeks, has ticked up in the most recent data – possibly significantly.  This is where the recovery of the labor market and increasing wage pressures will show up first since these workers are more likely to exit unemployment.  There are very slight increases for those unemployed for longer spells but almost no movement of those unemployed for greater than 27 weeks. When these transition probabilities show a marked upward movement the labor market recovery will be in full swing even though longer duration unemployed may be slow to benefit.

UN-rate-duration-2014-06-06

The transitions from unemployment to out of the labor force also tell a more nuanced story.  Clearly the long duration unemployed face declining prospects and are more likely to exit the labor force and these transitions have been rising dramatically. But decisions to exit the labor force are also affected by the duration of unemployment benefits and that shows up in slower transitions as benefits have increased. UU-rate-duration-2014-06-06

We can also look at the transitions from unemployment to unemployment, meaning the rate at which workers stayed unemployed in any given month. This is a reflection of the persistence of the unemployment.  Notice the rate at which workers stayed in unemployment is higher for all durations than in previous recessions meaning that unemployment is much more of an absorbing state.median-duration-2014-06-06

Finally, we can breakdown the median number of weeks that workers spend in unemployment, or the unemployment duration, into the duration for those workers who eventually found jobs and those that exited the labor force. Both have increased dramatically compared to previous recessions and the duration of those transitioning to employment is only slowly coming down.

The figures above highlight the devastating impact of this recession on those unemployed for long spells.


What do we learn by digging deeper?

Looking at the detailed transitions by group lets us see where exactly the labor market is improving by explaining the components that comprise the well known path of unemployment and labor force participation (below).  The long duration unemployed cast a long shadow over the labor market as a whole. Most of the policy action and most of the recovery is going to show up in the improved transition probability of the short duration unemployed.  We see that is finally beginning to show a few green shoots.

For an even more finely detailed look at employment by industry and occupation check out the superb interactive graphics developed by the New York Times.

unemprate-2014-06-06

lfp-level-2014-06-06


April jobs report: More mixed signals.

by: Zach Bethune, Thomas Cooley, Peter Rupert

The establishment survey reports total non-farm employment increased 288,000 and the previous two months were also revised up a total of 36,000 over what was previously reported. Job growth over the year has averaged 190,000 per month. Moreover, the job gains were fairly widespread with service producing jobs leading the way with 220,000 jobs added. Goods producing and government employment showed little change.

empchgm-2014-05-02

The unemployment rate fell from 6.7% to 6.3%.

unemprate-2014-05-02

Some cold water on the report

But is the report really as good as it looks at first blush? Maybe not…average weekly hours of work were unchanged at 34.5 and average hourly and weekly earnings remained flat at $24.31 and $838.70, respectively.

weeklyhours-2014-05-02

According to the household survey the labor force fell by 806,000 and the labor force participation rate declined from 63.2 to 62.8. Is this decline in the labor force participation rate (and the consequent decline in the unemployment rate) due to discouraged searchers leaving the labor market? Or, is it a longer run trend down in participation rates? According to the household survey employment fell by 73,000.

Some of the decline in labor force participation is attributed to the fact that the long duration unemployed have dropped out of the labor force.  The average duration of unemployment is little changed at 35 weeks and more than 35% of the unemployed are unemployed for 27 weeks or more. Many of the long duration unemployed eventually stop looking for work and thus drop out of the labor force.  This has been an important contributor to the declines in labor force participation.

lfp-level-2014-05-02

lfp-2014-05-02

As often happens, it is possible to use this report to signal strong growth in the labor market or to underscore the real weaknesses in the economy. The takeaway is that the labor market still appears fragile.