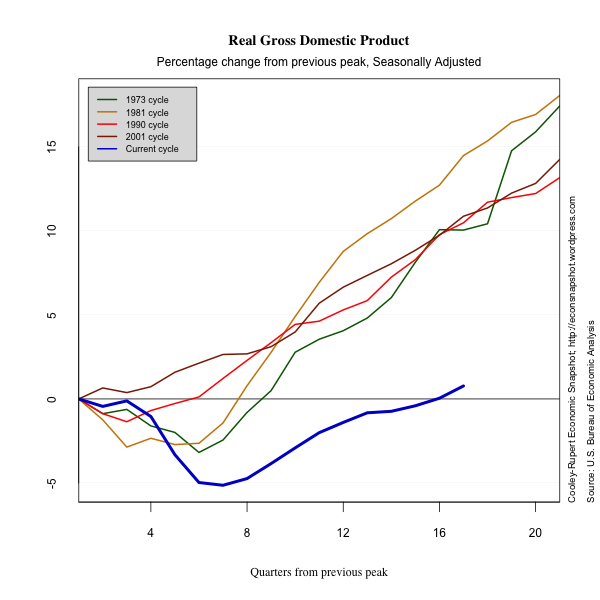
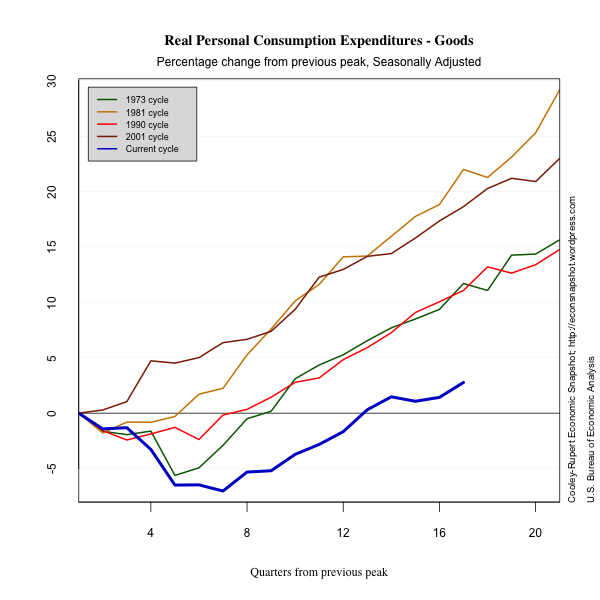
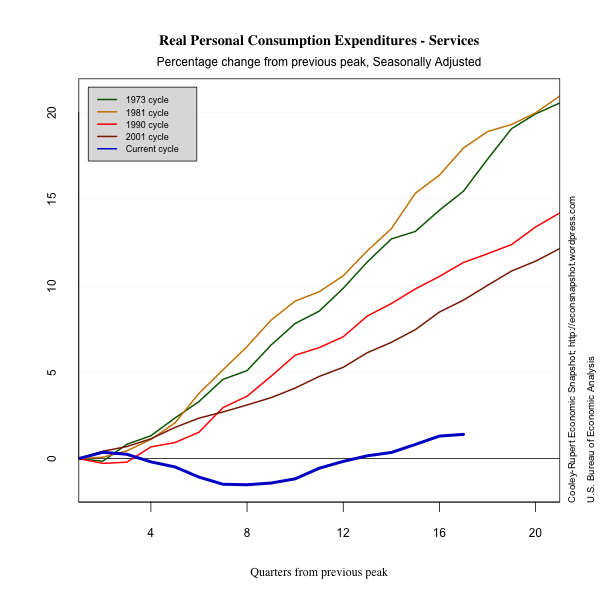
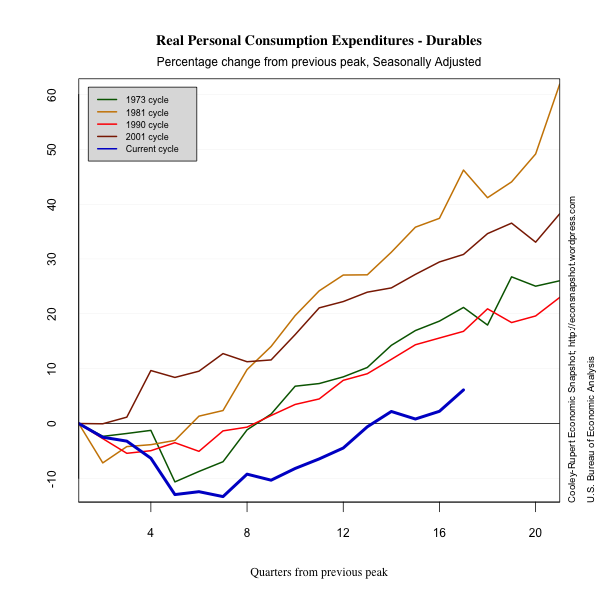
Welcome to the Cooley-Rupert Economic Snapshot, our view of the current economic environment. This is the latest version of our snapshot of the U.S. Economy based on the final revisions to fourth quarter data on National Income and Product from the Bureau of Economic Analysis. As in previous snapshots we present the data in a way that we find particularly useful for assessing where we are in the business cycle and tracking the U.S. economic recovery. The paths of all the series presented are plotted relative to the their value at the peak of the respective business cycles. We use the business cycle dates identified by the National Bureau of Economic Research.
We present the data in four sections. The first summarizes the path of Gross Domestic Product and its components. This post primarily updates GDP and its components based on preliminary estimates of fourth quarter activity from the BEA. We also include the most recent labor market data and the summary of activity in credit markets. The final section summarizes the features of industrial production and inflation.
As always we welcome any suggestions for additional data that you would like to see and suggestions for how to improve the presentation of the data. Click here to go to the latest snapshot in one pdf document. Or, read on
Final Fourth Quarter GDP Revisions
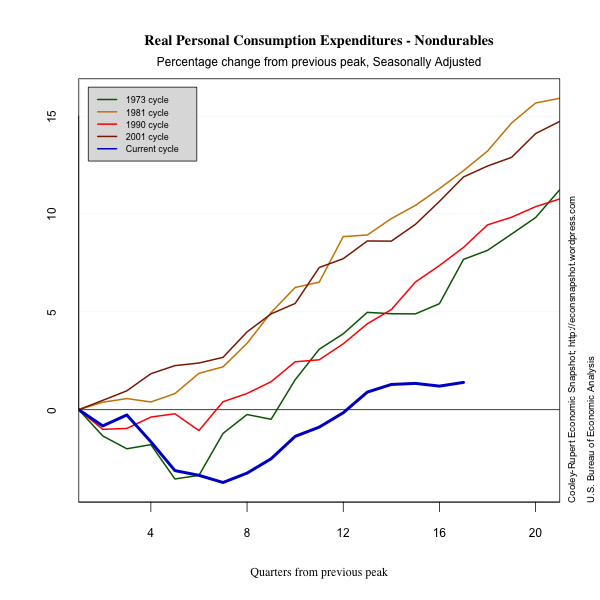
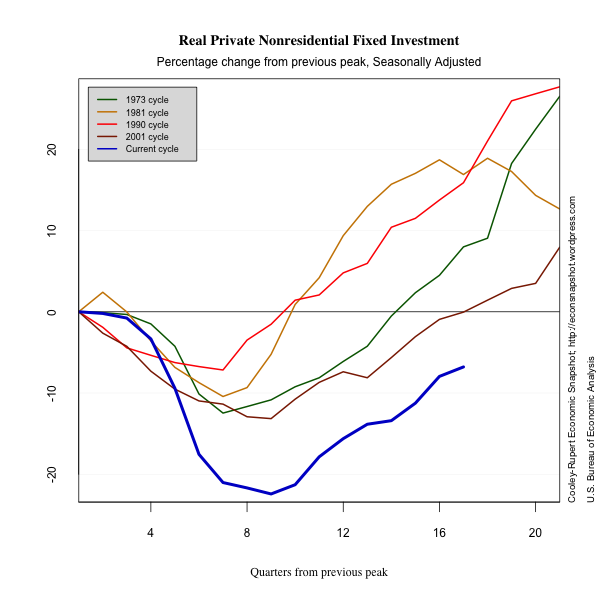
The third and final estimate of GDP and its components confirms that real GDP grew at an annual rate of 3% in the fourth quarter of 2011. While there was no change in the total, there were changes to the components of GDP that roughly offset each other. Personal consumption expenditures on goods were revised up further from 4.9% to 5.4% annual growth. Growth in services, however, was revised down further from 0.7% to 0.4% and continues to drag down growth in total consumption. It remains at least 5 percentage points below where its path should be compared to “typical” previous cycles and is showing signs of slowing down. Gross private investment was revised upward to 22.1% from 20.6%. Notably, growth in nonresidential structures was revised up to -0.9% from -2.6% in the ‘second’ estimate and -7.2% in the preliminary estimate.
The Labor Market
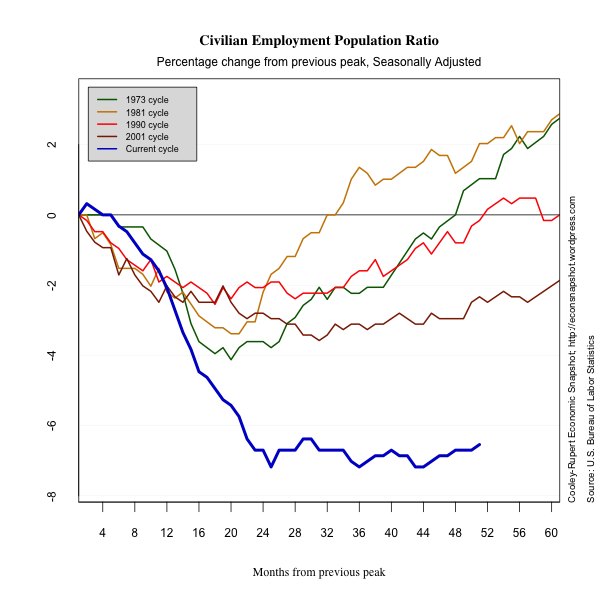
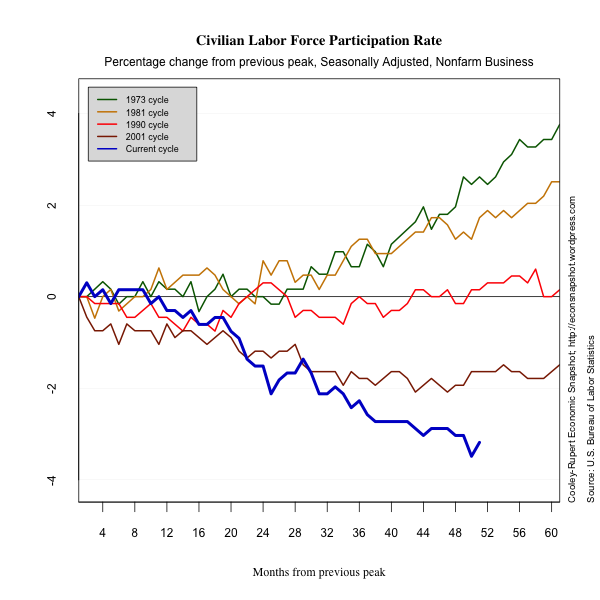
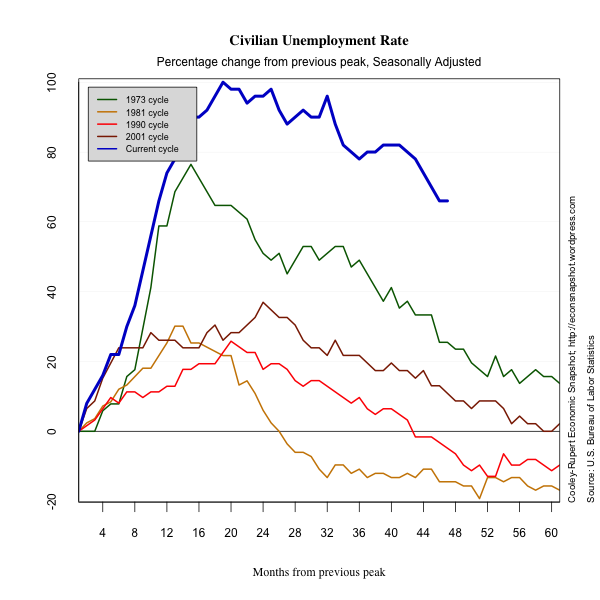
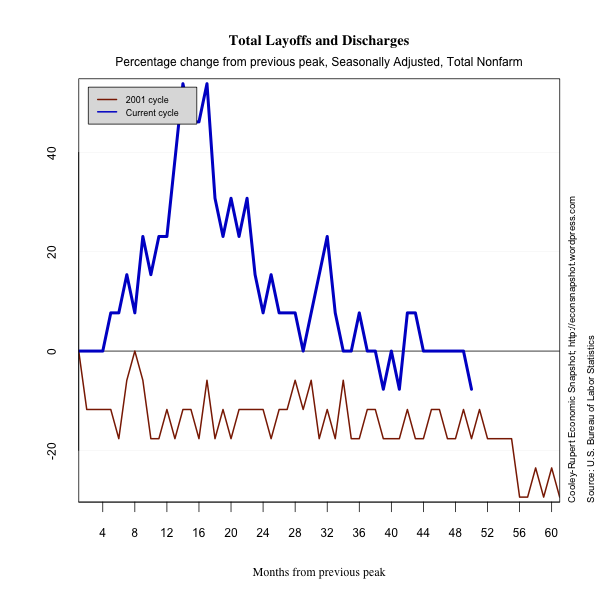
The latest Employment Situation report from the Bureau of Labor Statistics shows non-farm payroll employment rose by 227,000 jobs in February. Prior payrolls were revised upwards for January and December. These indicate a continued improvement in labor market conditions but at the same modest pace of recent months. The total number of unemployed remained essentially constant. This reflects the fact that labor force participation increased in February, perhaps an encouraging sign. The household survey showed an increase in labor force participation of about 0.2%, while participation declined through much of 2011. The new participants kept the number of unemployed at the same high level but the number of unemployed because of job loss declined. For comparison, as we did last month, we plot employment as reported by ADP, an association of payroll processors. Many observers view this as a useful early indicator of the BLS numbers.
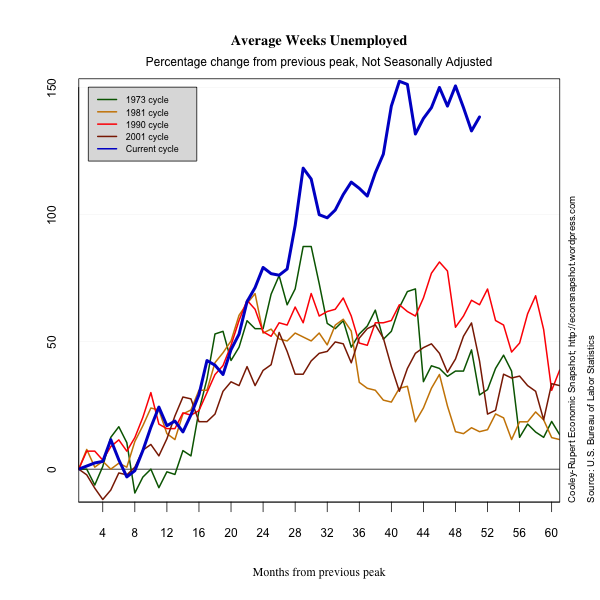
Several indicators, however, suggest deeper problems in the labor market. The number of long term unemployed remained essentially unchanged this past month, and comprise more than 40% of the unemployed. The numbers of people who are involuntarily underemployed, marginally attached to the labor force and the number of people who classify as discouraged workers are essentially unchanged. These suggest the deeper malaise of the labor market is not being dented by the marginal job gains.
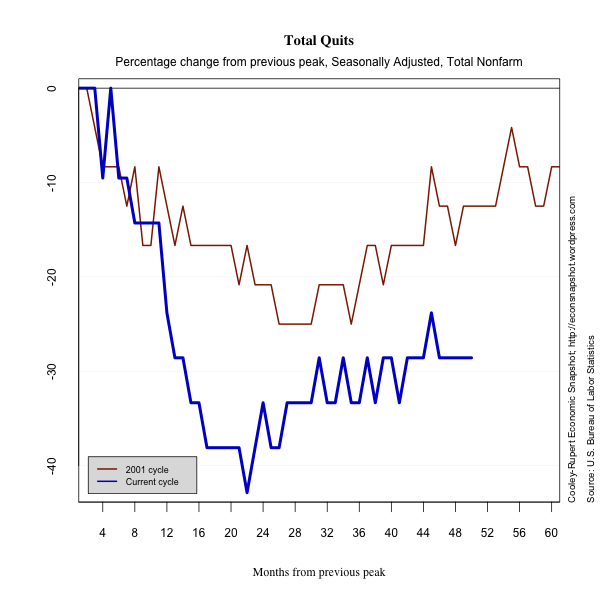
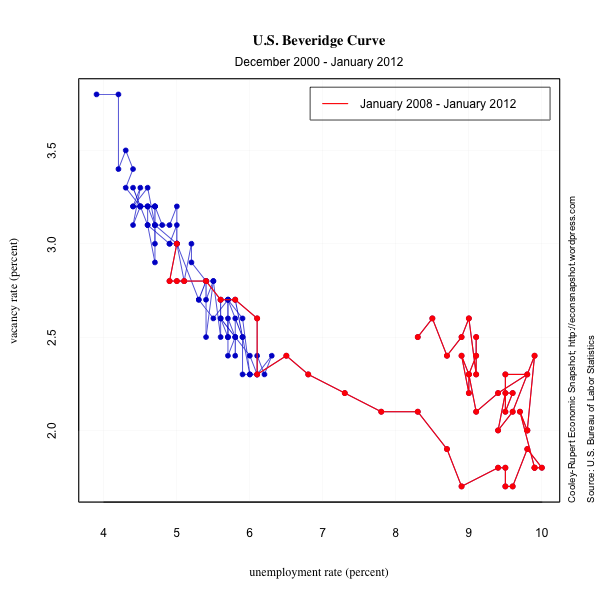
It is interesting to note where the jobs are being added. Employment increased in professional and business services, health care services and leisure and hospitality. There was a modest increase in manufacturing jobs. Most of the job growth seems to be in occupations that require more skills. However, perhaps due to still-cautious employers, although professional and business services added 82,000 jobs in February, just over half of the increase occurred in temporary help services (+45,000). There has been much anecdotal evidence that the skills mismatch in the U.S. economy is holding back a more robust recovery. The JOLTS Survey data for February will give us a better picture of that.
Aggregate Hours of work captures changes in both the extensive margin of labor force adjustment (employment), and the intensive margin (hours of work). Many believe this offers a more accurate picture of the economy. Hours continue to increase consistent with higher employment but average weekly hours has not changed.
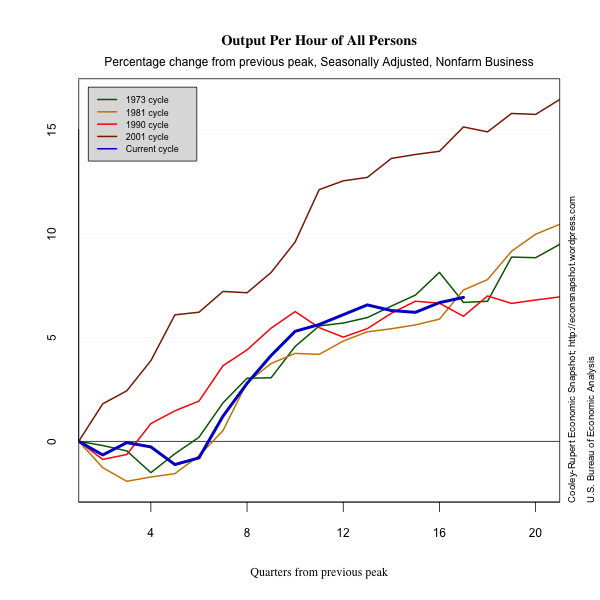
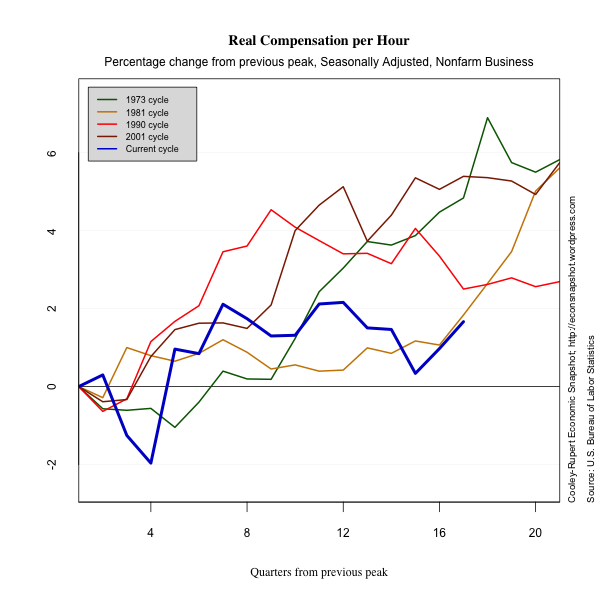
Productivity continues to increase and unit labor costs have risen a little.
 Credit Markets
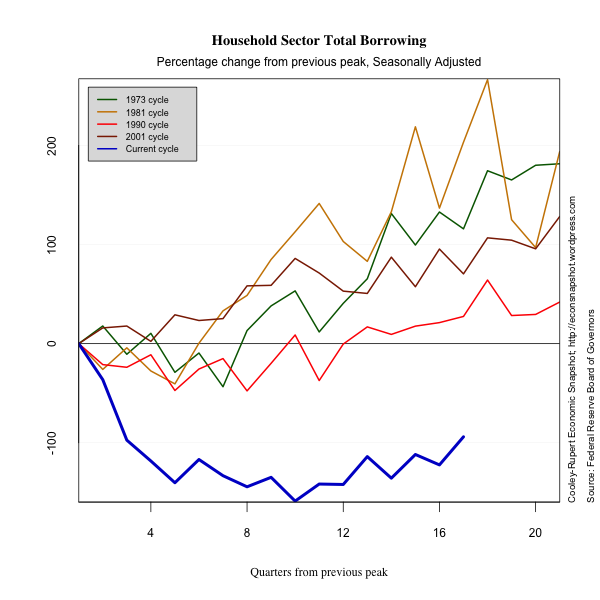
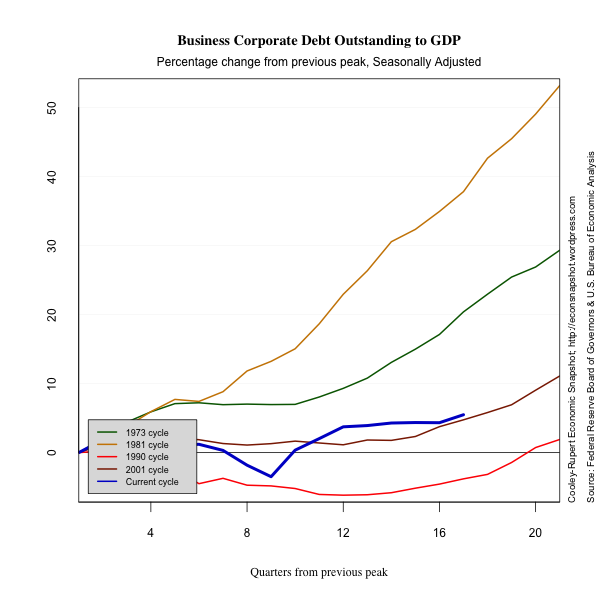
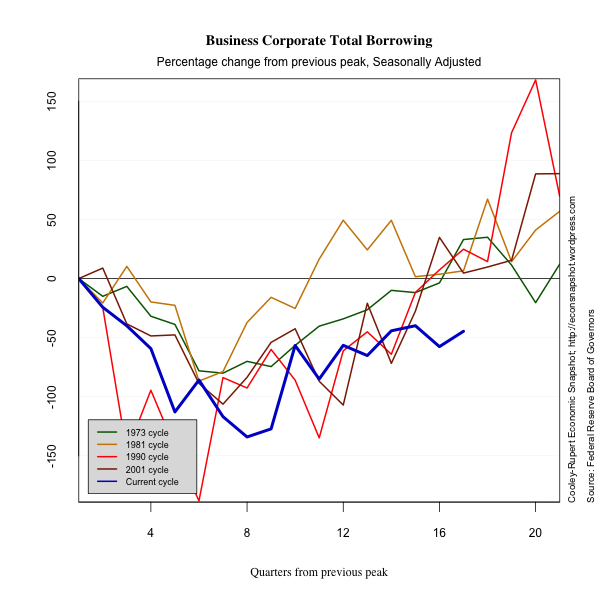
Credit markets continue to show the after-effects of the tremendous increase in leverage the took place prior to the 2007-2009 crisis. Households debt outstanding continues to decline and shows little signs of picking up. Household borrowing is only gradually increasing, but remains well below its level at the peak. Corporate sector borrowing is falling again and corporations continue to lower their debt. The big story in credit markets is the dramatic shift of leverage to the public sector. Public sector debt outstanding is increasing at a faster rate.
*Note 2/9/2012: The graphs for household debt outstanding as a % of GDP and business corporate outstanding as % of GDP were updated. Previous graphs contained errors and were wrong.
Industrial Production and Inflation
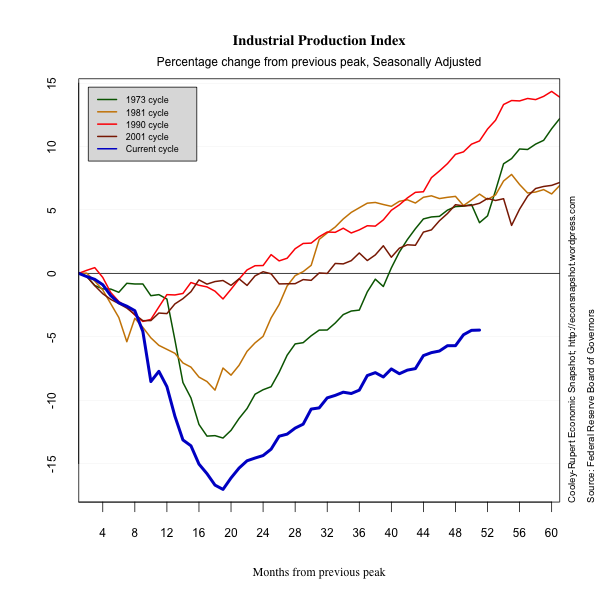
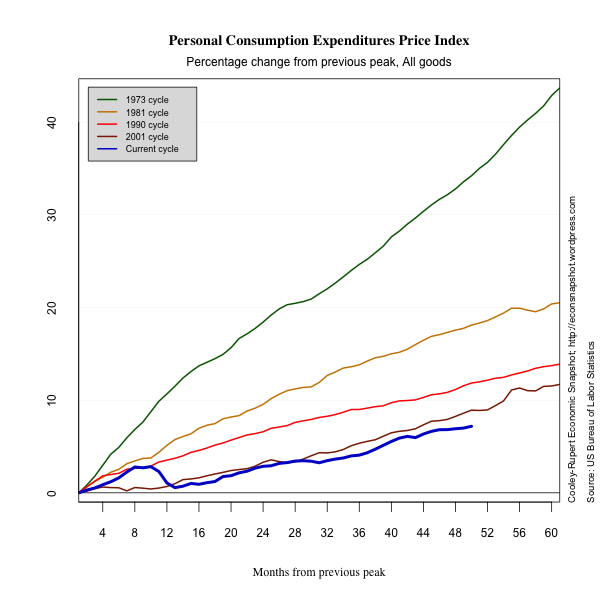
In this section we present some plots of miscellaneous series that reflect other characteristics of this business cycle. The decline in industrial production is dramatic. There is no evidence of inflation or deflation.
Glossary
Compensation includes accrued wages and salaries, supplements, employer contributions to employee benefit plans, and taxes.
Consumer Price Index measures the price paid by urban consumers
for a representative basket of goods and services. Prices are collected from 87 urban areas and from approximately 23,000 retail and service establishments.
Debt Outstanding measures the current level debt owed on credit market
instruments. Credit market instruments include open market paper, Treasury securities, agency and GSE-backed securities, municipal securities, corporate and foreign bonds, bank loans, mortgages, and
consumer credit.
Durables are goods that have an average useful life of at least 3
years.
Employment Population Ratio is the ratio of the number of
civilians in the labor force to the total civilian population.
Exports consist of goods and services that are sold or
transferred by U.S. residents to foreign residents.
Goods are tangible commodities that can be stored or inventoried.
Government Consumption Expenditures and Gross Investment measures
current consumption expenditures by the government in order to produce goods and services to the public and investment in structures and equipment and software.
Gross Private Domestic Investment measures additions and
replacements to the stock of private fixed assets without deduction of
depreciation.
Imports consist of goods and services that are sold or
transferred by foreign residents to U.S. residents.
Industrial Production Index measures real output of
manufacturing, mining, and electric and gas utilities industries.
Job Openings or Vacancies are all positions that are open (not
filled) on the last business day of the month.
Labor Force is defined as the number of unemployed persons plus
the number of employed persons.
Labor Force Participation Rate is the ratio of unemployed persons
to the number of persons in the labor force.
Net Worth equals to total assets minus total liabilities. Assets
include owner-occupied real estate, consumer durables, and equipment and software owned by nonprofit organizations.
Nondurables are goods that have an average useful life of less
than 3 years.
Nonresidential Fixed Investment measures investment by businesses
and nonprofit institutions in nonresidential structures and in equipment and software.
Personal Consumption Expenditures measures the value of goods and services purchased by households, nonprofit institutions that primarily serve households, private non-insured welfare funds, and private trust funds.
Residential Fixed Investment measures investment by businesses and households in residential structures and equipment, primarily new construction of single-family and multifamily units.
Services are commodities that cannot be stored or inventoried and
that are usually consumed at the place and time of purchase.
Total Borrowing measures the flow of new credit market liabilities during the period. Credit market liabilities include open market paper, Treasury securities, agency and GSE-backed securities, municipal securities, corporate and foreign bonds, bank loans, mortgages, and
consumer credit.
